FireHoseReel | BNB Daily Analysis #18🔥 Welcome To FireHoseReel !
Let’s dive into BinanceCoin (BNB) analysis.
👀 BNB 1H Overview
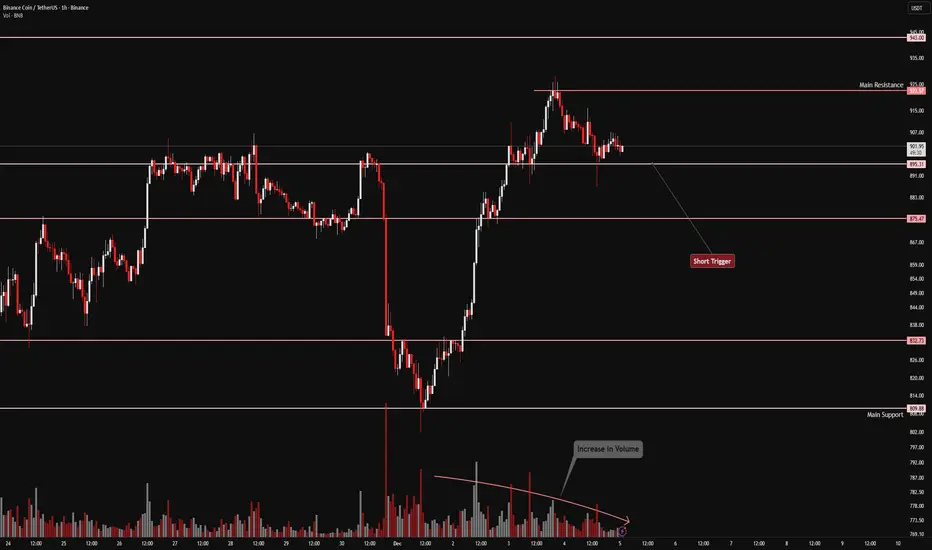
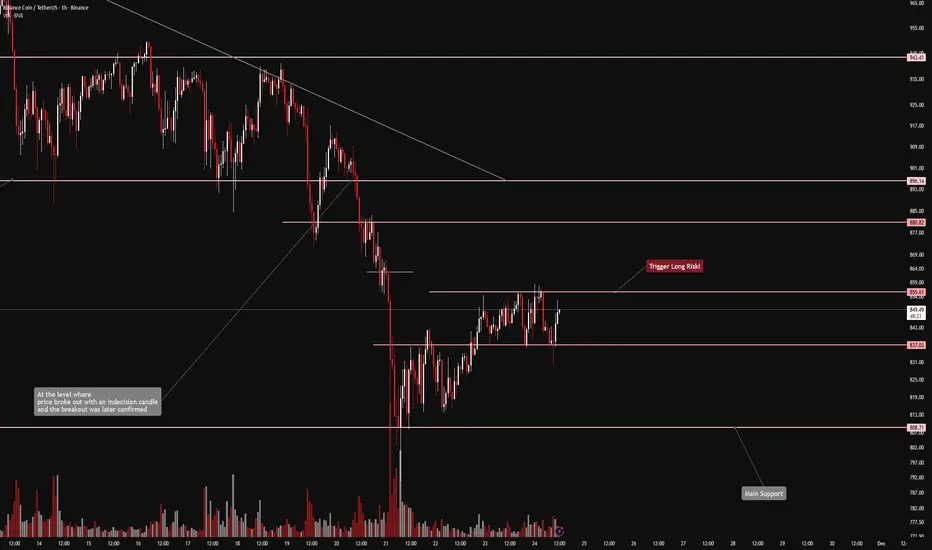
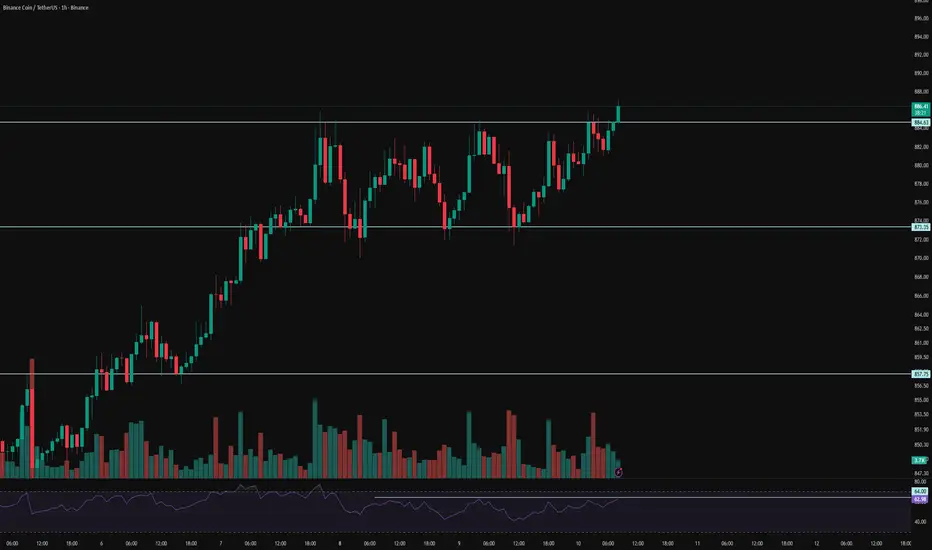
BNB is still holding the same position as yesterday, and due to the holiday period, the market hasn’t shown major changes. I’ve only adjusted the newly formed resistance slightly and moved it to $898.22.
📊 Volume Analysis
BNB volume was very low yesterday, but today it’s showing a moderate increase. Sundays usually bring more activity than Saturdays, so with rising volume, any trigger activation could lead to a faster move.
✍️ BNB Trading Scenarios
🟢 Long Scenario:
A breakout above the newly formed resistance at $898.22, supported by rising buy volume, could act as a risky long trigger. The next key long level lies around $922.57.
🔴 Short Scenario:
A 15-minute base has formed in this zone, which may offer a quick entry with a tight stop. The main short trigger is at $877.33—a confirmed break with volume could validate a short entry.
🧠 Protect your capital first. No setup is worth blowing your account. If risk isn’t controlled, profit means nothing. Trade with rules, not emotions.
Binancesmartchain

FireHoseReel | BNB Daily Analysis #16🔥 Welcome To FireHoseReel !
Let’s dive into BinanceCoin (BNB) analysis.
👀 BNB 1H Overview
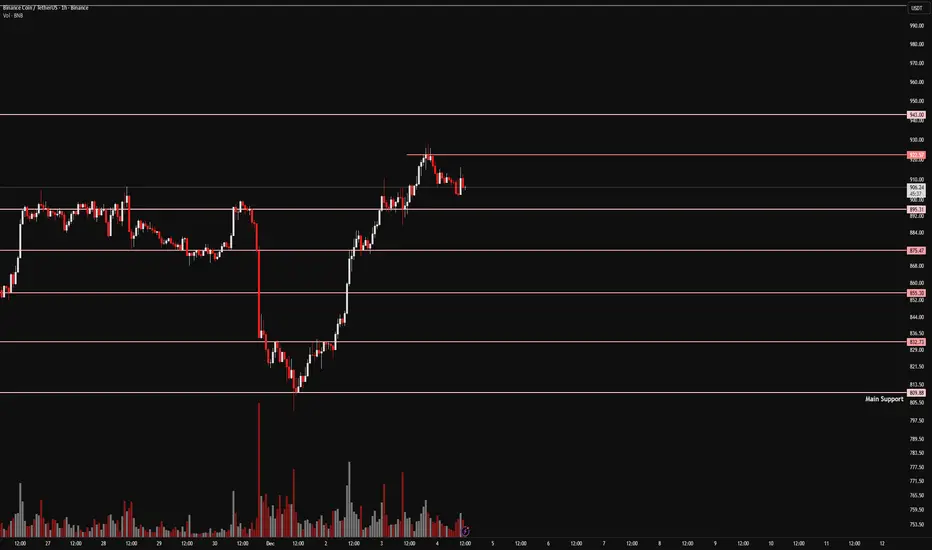
BNB is currently hovering near a key support zone. A breakdown below this level could trigger a deeper correction toward lower prices.
📊 Volume Analysis
Trading volume has dropped sharply at this corrective level. A new surge in either buy or sell volume could ignite a strong momentum move.
✍️ BNB Trading Scenarios
🟢 Long Scenario:
A breakout above $922.57 with rising buy volume could offer a solid long opportunity.
🔴 Short Scenario:
A breakdown below the current support at $895, accompanied by strong selling pressure, could trigger a valid short setup.
🧠 Protect your capital first. No setup is worth blowing your account. If risk isn’t controlled, profit means nothing. Trade with rules, not emotions.
FireHoseReel | BNB Daily Analysis #15🔥 Welcome to FireHoseReel!
Let’s dive into the Binance Coin (BNB) analysis.
👀 BNB – 1H Overview
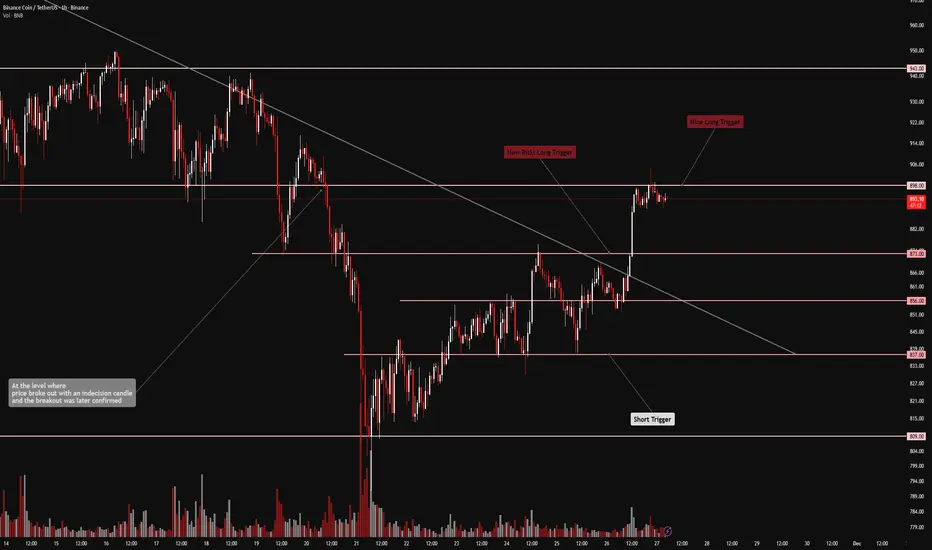
BNB has successfully activated its long trigger and is now moving higher.
At the moment, BNB is forming a higher low compared to the previous bottom, which strengthens the bullish structure and keeps the upside continuation in play.
📊 Volume Analysis
After the long trigger was activated, BNB volume increased strongly, supporting the upward move.
If buying pressure remains sustained, BNB can continue its rally toward the next key resistance zone.
✍️ BNB Trading Scenarios
🟢 Long Scenario
The main long trigger is already active.
However, the risk-on long trigger will activate with a break above the current high, offering a more aggressive continuation setup.
🔴 Short Scenario
If BNB forms a lower high and a lower low below the $895 level, strong selling pressure could emerge.
That said, on the 4H timeframe, there is still a high probability that this short scenario may fail.
FireHoseReel | BNB Daily Analysis #9🔥 Welcome To FireHoseReel !
Let’s dive into the current BNB market structure and key levels.
👀 BNB – Market Structure & Trade Scenarios
After activating its trigger, BNB is currently trading just below a key resistance zone.
A clean breakout above this resistance could activate our long trigger, making this area a very strong zone for potential long positions after confirmation.
📊 Volume Behavior
Pay attention to volume — over the past few days, volume dropped noticeably, but we’re now seeing early signs of rising buy volume.
While this increase may not be fully visible on the 4H timeframe, on multi-timeframe analysis, the growth in buying pressure toward this resistance is clearly forming.
✔️ BNB/BTC – Relative Strength Check Looking at the BNB/BTC pair, price is currently sitting near a strong support level.
If this support is lost, it would signal a decline in BNB’s relative strength versus Bitcoin.
However, a solid reaction and bounce from this level could help trigger the resistance breakout on the BNB/USDT pair.
On the 4H timeframe, BNB/BTC still holds a slightly bullish structure, but on higher timeframes it appears bearish, meaning we must stay cautious.
📌 Trading Scenarios for BNB
Below are the key scenarios that can be used alongside your own trading strategy:
🟢 Long Scenario
A breakout above $898, confirmed with rising buy volume, can activate our long trigger and offer a valid buy entry.
The current area is a good preparation zone for a potential long after confirmation.
🔴 Short Scenario
For shorts, it’s best to focus on naturally bearish patterns, as supported by Dow Theory, such as:
• Failure Swing
• Non-Failure Swing
• Double Top
A break of newly formed lows with increased sell volume can present strong short opportunities.
🛞 Risk Management & Disclaimer
Please remember to always use proper risk management and position sizing. Nothing in this analysis is financial advice. The market can change quickly, so always trade based on your own strategy, research, and risk tolerance. You are fully responsible for your own trades.

FireHoseReel | BNB Daily Analysis #8🔥 Welcome FireHoseReel !
Let’s dive into the current BNBUSDT Structure .
🔷 BNB Market Update & Trade Scenarios
After our initial trigger was activated, BNB moved higher and the long position was successfully entered. Price is now trading at a major resistance zone, and a confirmed breakout above this area could activate the next long trigger. If the position had been opened earlier with a lower-risk entry, this secondary trigger would now provide a strong opportunity to scale into the position with confirmation.
📊 Volume Insight
From a volume perspective, the breakout and acceptance above the 873 level were supported by a clear expansion in trading volume, confirming strong buyer participation. During the pullback phase, volume noticeably declined, which signals a healthy and controlled correction, not aggressive distribution. For continuation toward the 898 resistance, we now need to see a fresh and decisive increase in buying volume to validate sustained bullish momentum.
📌 Below are the key scenarios based on the current BNB market structure, which can be used alongside your own trading strategy. 👇🏻
🟢 Long Scenario
A clean breakout above the 898 resistance, confirmed by a strong bullish candle close and rising buy volume, could offer a high-quality long setup.
The stop-loss can be safely placed below the most recent local low to maintain a favorable risk-to-reward profile.
🔴 Short Scenario
If price forms a lower high followed by a lower low, or prints a bearish structure such as a failure swing or non-failure swing, with volume confirmation, a valid short setup may emerge—especially since the higher-timeframe market cycle still carries bearish pressure.
🛞 Risk Management & Disclaimer
Please remember to always use proper risk management and position sizing. Nothing in this analysis is financial advice. The market can change quickly, so always trade based on your own strategy, research, and risk tolerance. You are fully responsible for your own trades.
FireHoseReel | BNB Daily Analysis #7🔥 Welcome FireHoseReel !
Let’s break down the current BNB structure and important triggers.
BNB – Short-Term Market Structure Update
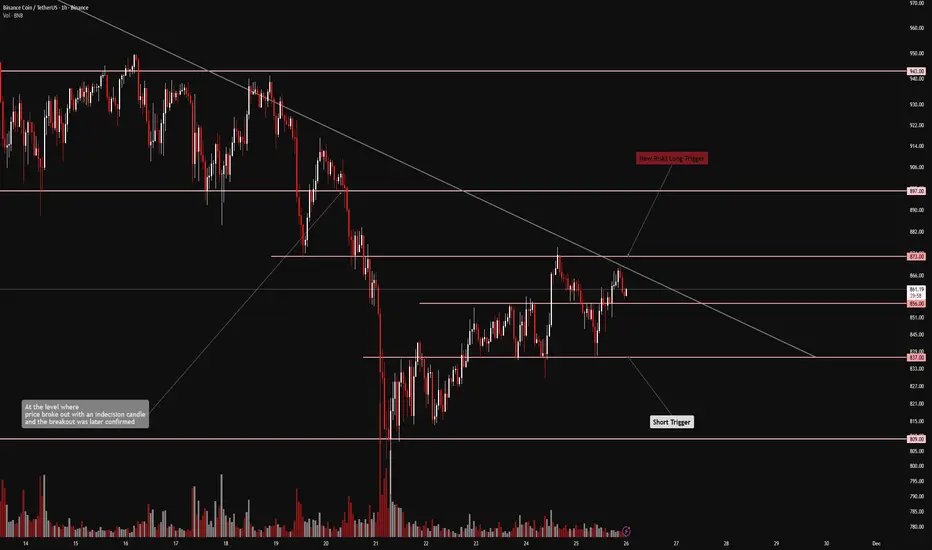
Since yesterday, BNB formed an almost equal low around $837 and bounced upward. However, on the 1H timeframe, it printed a lower high compared to the previous peak and failed to break the $873 resistance.
A break above the high activates our long trigger, while a break below the low activates the short trigger.
📊 Volume Analysis
Pay close attention to volume to understand internal market behavior.
After the heavy market drop, BNB formed a critical higher-timeframe support near $809, followed by a sharp drop in volume.
The first strong volume expansion, combined with trigger activation, will act as confirmation either for opening new positions or for holding existing ones.
🔁 BNB/BTC Perspective From the BNB/BTC pair, it appears price is possibly forming a fake breakout at the top of its trading range.
If this fakeout plays out, BNB’s relative strength against Bitcoin may weaken, allowing:
• BTC dominance to rise
• USDT dominance to increase
• And BNB to activate its short trigger
On the flip side, if BTC dominance and USDT dominance both drop, BNB can move upward, activating the BNB/USDT long trigger.
This potential fakeout is also accompanied by a volume divergence, which increases its technical significance.
📌 Trading Scenarios
The active scenarios for BNB are outlined below and can be used depending on how price reacts.
🔼 Long Scenario
• A breakout above the multi-timeframe high at $873
• Must be accompanied by a clear increase in volume
This provides a risky long setup toward the next resistance.
If that resistance shows signs of breaking, we can add to the position, since the main long trigger sits at $897.
🔽 Short Scenario
• A breakdown below the newly formed support at $837
• Must be confirmed by a strong increase in sell volume
• Only with volume confirmation does this become a valid short trigger.
🛞 Risk Management & Disclaimer
Please remember to always use proper risk management and position sizing. Nothing in this analysis is financial advice. The market can change quickly, so always trade based on your own strategy, research, and risk tolerance. You are fully responsible for your own trades.
FireHoseReel | BNB Daily Analysis #5🔥 Welcome FireHoseReel !
Let’s dive into the analysis of BNB (Binance Coin).
👀 BNB – 1H Timeframe Analysis
On the 1-hour chart, BNB is currently moving inside a clear trading range.
If the top of the range breaks, we get a risky long trigger.
If the bottom breaks, we get a clean short trigger.
We now have to wait and see which direction the market chooses so we can position ourselves accordingly.
Since USDT.D is still high, I personally lean slightly more toward a bullish reaction from BNB.
📊 Volume Indicator Insight
Pay close attention to the volume indicator.
It clearly shows that BNB is range-bound, because volume has been declining inside this box.
A breakout from the range will represent reduced absorption + a new directional move.
So the first strong volume spike will likely give us a valid entry signal.
✔️ A Different Perspective – BNB/BTC Pair Checking the BNB/BTC pair helps a lot.
Just like before, it’s still moving inside its own box, but currently leaning slightly downward.
This means BNBUSDT is behaving similarly to BTCUSDT, and the triggers become much clearer when analyzing both pairs together.
Trading Scenarios
Related entry scenarios are written in the continuation of the analysis and can be used depending on how price reacts.
🔼 Risky Long Scenario
A long position becomes valid if:
• $855.61 resistance breaks, and
• A noticeable increase in buy volume confirms a clean breakout from the trading range.
🛞 Risk Management & Disclaimer
Please remember to always use proper risk management and position sizing. Nothing in this analysis is financial advice. The market can change quickly, so always trade based on your own strategy, research, and risk tolerance. You are fully responsible for your own trades.
FireHoseReel | BNB Daily Analysis #4🔥 Welcome FireHoseReel !
Let’s dive into the analysis of BNB (Binance Coin).
👀 BNB – 1H Timeframe
BNB is currently breaking through its multi-timeframe resistance around $842.
If price forms a higher low above this zone, we can take it as a valid confirmation for bullish continuation.
Keep in mind: the long trigger sits at $880, which makes this setup a bit risky.
📊 Volume Analysis
The volume indicator is showing rising multi-timeframe buy volume, which is different from previous behavior on the left side of the chart.
This suggests a healthy convergence of buying pressure, showing that sellers are weakening, market fear is fading, and investors are slowly stepping back in to accumulate at these levels.
✔️ BNB/BTC Pair Perspective To look at things differently, we also check the BNB/BTC pair, which helps us understand the structure more deeply.
The pair is still in the same condition as yesterday, with one difference:
The multi-timeframe resistance at 0.0991 could become a risky long trigger.
A breakout above this zone may push momentum into the BNB/USDT pair as well.
✍️ Let’s break down the trading scenarios for BNB on the 1H timeframe.
🔼 Long Scenario:
We need:
• Strong buyer support and increased participation
• Continued multi-timeframe volume convergence
• Breakout of key resistance zones on both BNB/USDT and BNB/BTC
If these conditions align, we can take a low-risk (0.5%) long entry on the breakout.
If needed, we can also add to the position on higher resistance breakouts.
🔽 Short Scenario:
A breakdown of the key support levels on the chart + clear selling pressure can give us a valid short or exit signal.
This breakdown may also require a break of USDT dominance resistance, which would strengthen the bearish move.
🛞 Risk Management & Disclaimer
Please remember to always use proper risk management and position sizing. Nothing in this analysis is financial advice. The market can change quickly, so always trade based on your own strategy, research, and risk tolerance. You are fully responsible for your own trades.

FireHoseReel | BNB Daily Analysis #3🔥 Welcome FireHoseReel !
Let’s dive into the analysis of BNB (Binance Coin).
👀 BNB – 1H Timeframe
On the 1-hour chart, BNB has formed a solid support around $808.17, right after the drop we mentioned in previous analyses.
Price also has a local resistance at $842.26, and a breakout on either side can give us confirmation for the next move.
However, going long from this zone is not ideal. A long setup would be more reasonable at higher levels during a pullback of this bearish leg — and for that, we need USDT dominance to reject downward.
📊 Volume Analysis
Looking at volume, one key detail stands out:
The multi-timeframe correction of this bearish move has come with decreasing buy volume.
If price moves back down and breaks the support again, we can look for a fresh short position.
✔️ BNB/BTC Pair Analysis Since we analyze things differently, let’s also check the BNB/BTC pair.
This pair is currently sitting on its own support and moving slightly upward.
But what matters is this: BNB/BTC seems to be forming a potential bearish pattern on this timeframe. If the structure completes, I’ll include it in the next analysis update for you.
✍️ Now let’s check the trading scenarios for BNB on the 1H timeframe.
🔽 Short Scenario
A short setup becomes valid if:
• BNB/BTC breaks below 0.009691,
• Confluence with BNB price breaking below $808.71,
• Increased sell volume,
• A clean candle close under the defined support zones.
This combination gives us a strong short trigger.
🔼 Long Scenario
A long setup requires:
• Breakout above $896,
• A few retests (rejections) into this zone,
• Followed by a confirmed breakout with increased buy volume.
This long scenario is still far from current price, and once BNB reaches that zone, I’ll post the best updated scenario for you.
🛞 Risk Management & Disclaimer
Please remember to always use proper risk management and position sizing. Nothing in this analysis is financial advice. The market can change quickly, so always trade based on your own strategy, research, and risk tolerance. You are fully responsible for your own trades.

FireHoseReel | BNB Daily Analysis #2😄 Hey! How’s everything? Hope you’re doing great!
🍾 Welcome to FireHoseReel — make sure to follow and enjoy the analysis along the way.
If you ever want a custom chart breakdown, just leave a comment and I’ve got you.
😎 Now let’s jump into the analysis of my favorite coin: BNB .
👀 BNB – 4H Timeframe
BNB recently gave us a short trigger on the 4-hour chart after breaking its key support at $896. Price dropped right toward our first target at $818, hit it cleanly, and is now stuck in a “mid-zone” with no clear direction.
Even on a multi-timeframe view, we currently don’t have any valid entry trigger, so we need to wait for new structure formation before planning the next move.
📊 Volume Analysis
Our volume indicator played a major role here:
Once the support broke and the short trigger activated — exactly as mentioned in yesterday’s analysis — sell pressure increased sharply.
Whales also started selling their BNB as soon as the support failed, and many traders used this opportunity to enter short positions.
Volume is still showing bearish pressure, and the last two 4H candles had a strong increase in selling activity, turning into clear downward momentum.
✔️ Now let’s analyze something different — BNB/BTC pair
On the 4H timeframe, this pair is still moving inside its trading range and has managed to maintain its relative strength against BTC.
However:
• A breakout above the range high at 0.010162 could trigger a strong bullish move
• A breakdown below the range low at 0.009800 could lead to a deeper correction in the BNB/USDT pair and accelerate the bearish momentum there
For now, the pair holds a bullish bias, but we need confirmation through an actual breakout.
✍️ Current Scenarios
We don’t have a new setup today, as yesterday’s short position already played out and is still valid.
For a new entry — long or short — we need BNB to build a fresh market structure and give us a clean trigger.
Until then, patience is the best strategy.
🛞 Risk Management & Disclaimer
Please remember to always use proper risk management and position sizing. Nothing in this analysis is financial advice. The market can change quickly, so always trade based on your own strategy, research, and risk tolerance. You are fully responsible for your own trades.
FireHoseReel | BNB Daily Analysis #1😄 Hey! How’s it going? You good?
🍾 Welcome to Fire Hose Reel!
Hit that follow button and enjoy the analysis ahead. And if you ever want a custom chart breakdown, just drop a comment — I got you.
😎 Let’s jump into the analysis of my favorite coin : BNB
👀 BNB on the 4-hour timeframe
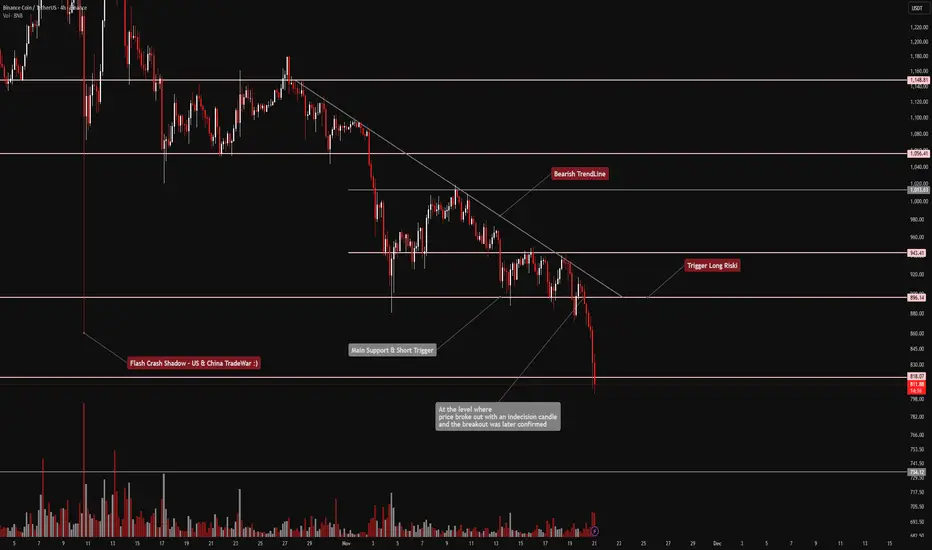
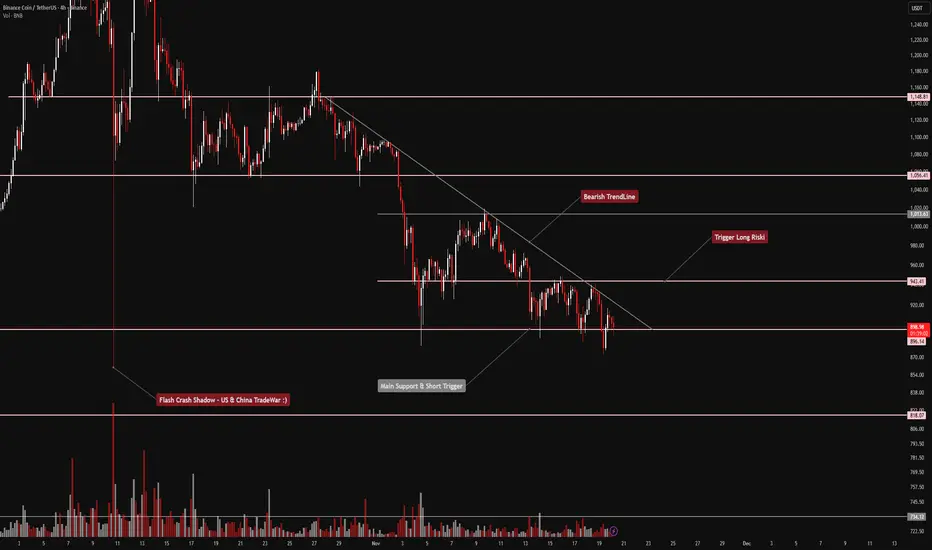
After the recent flash crash in the market, BNB entered a corrective phase. A descending trendline (dynamic resistance) has formed, and every time price touches it, we see a retracement.
Right now, BNB is walking right along a major support zone. Losing this area could push price down toward the next support.
This key support sits around $896, and a breakdown below it could intensify the bearish trend, adding momentum to the downside and breaking price out of this triangle-shaped structure.
📊 Volume Indicator
Looking at the volume below the chart, every touch of the trendline has caused sellers to step in, sometimes even breaking strong support levels. When that happens, the volume bars spike upward, signaling increased selling pressure.
At the moment, if sell volume continues rising, BNB could lose the $896 support and move further downward.
✔️ Now let’s analyze something different — BNB/BTC pair
On the 4-hour timeframe, BNB/BTC hit an important resistance level and got heavily rejected, pushing price downward.
Here’s the key point:
BNB’s relative value against BTC is still higher, and just like the USDT pair, it’s sitting on a major support.
If this level breaks, maximum selling pressure could kick in and cause a strong drop.
✍️ Trading Scenarios (Long & Short)
🔼 Long Scenario
• A breakout above the descending trendline
• Confluence with the $943 resistance
• Strong buy volume confirming the breakout
This setup is a bit risky, since higher timeframes are still leaning bearish. Tight stop-loss & quick partial take-profits are recommended.
🔽 Short Scenario
The current level where price is hovering can act as a good support, but if this zone breaks with selling pressure, price could move downward.
That gives us a clean opportunity to open a short trade on the breakdown.
🛞 Risk Management & Disclaimer
Please remember to always use proper risk management and position sizing. Nothing in this analysis is financial advice. The market can change quickly, so make sure you trade based on your own strategy, research, and risk tolerance. You are fully responsible for your trades.
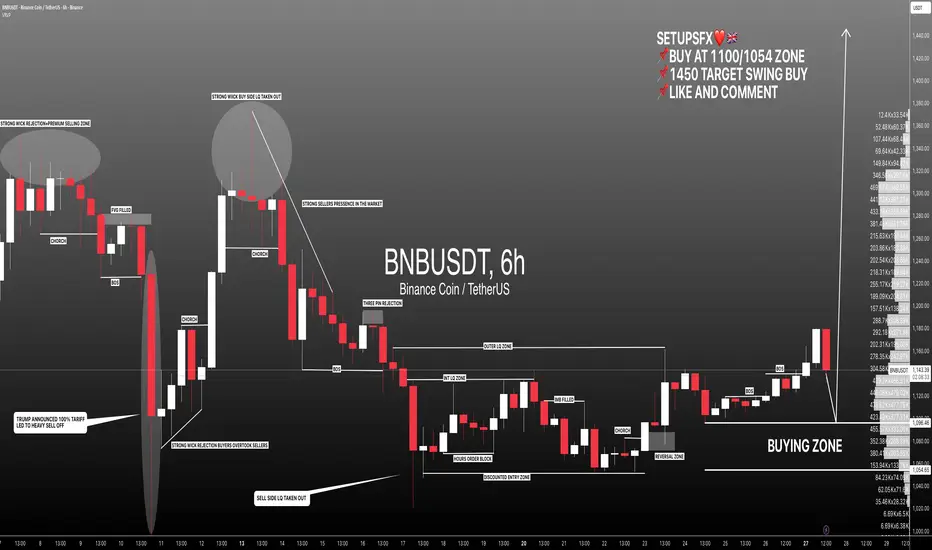
#BNBUSDT: Targeting 1450, One Swing Entry And Target**BINANCE:BNBUSDT**
Buyers still have control in the market in the daily time frame. However, there is still sellers’ pressure for the short term which is favourable. We want the price to reach our buying zone and move sharply upwards.
This is possible as there is major news coming up this week on Friday which is the Non-Farm Payroll (NFP) data. This economic data will influence the crypto market and other financial instruments.
Our target is to swing buy and close the position at 1450. However, the final closing price is at your discretion.
If you find our work helpful please like and comment.
Team Setupsfx_
BNB 1H Analysis - Key Triggers Ahead😃 Hey , how's it going ? Come over here — Satoshi got something for you!
⏰ We’re analyzing BNB on the 1-Hour timeframe.
👀 On the 1-hour timeframe of Binance Coin we can see that this coin, the popular token of Binance exchange with very strong backing, has formed a very important resistance at $885. With a breakout and confirmation above this level, and if the PPI news is positive, BNB could start another strong upward move.
⚙️ The key RSI level for this coin is at 64, and breaking above this level could give BNB higher volatility and even a price surge.
🕯 The volume, size, and number of green candles are increasing, and it seems we are almost exiting the range structure. With buying pressure and rising volatility, BNB could form more green candles and experience solid price growth.
🌒 On the 1-hour timeframe of the BNBBTC pair we can see that it has been rejected from the 0.007915 zone, which has created a trigger for a breakout at this level. If this zone is broken, BNB could also break its marked resistance in the USDT pair and move upward.
💡 This coin had resistance at $885, which has now been broken, and it is moving upward. A pullback to this resistance also happened during this breakout, which was executed well. For confirmation, you can also check the 15-minute timeframe.
❤️ Disclaimer : This analysis is purely based on my personal opinion and I only trade if the stated triggers are activated .
HolderStat┆BNBUSD 645 gate opens 730BNB price surged out of a steep falling channel and later coiled inside a tight consolidation rectangle, igniting a vertical drive that now hovers under the 645 USDT horizontal cap. Holding the breakout origin at 600‑610 keeps the upside narrative intact; clearance of 645 exposes the 720‑730 objective derived from the earlier channel depth.

Trade Setup Alert : BNB Levels to Watch 👀 Welcome to my Trading View Analysis and Trading Channel Here , we share the latest market analysis, trading signals, and key insights together .
Ready for smarter trades ? ⭐️
📊 BNB Technical Analysis – Key Zone in Focus for the Next Move
The BNB coin recently broke above the critical $584 resistance level and has successfully consolidated above it. This marks the second time the price has touched this zone, and in response, a strong bullish candle has formed — indicating a clear respect for this important area.
📍 Key Levels & Potential Trade Setups
Currently, the $584–$618 range acts as a decision zone, and price action here will likely determine the next major move.
🟢 If the price breaks above $618:
✅ A long position trigger is confirmed
🎯 Bullish targets:
First target: $732
Second target: $793
🔴 If the price drops below $584:
✅ A short position trigger is activated
🎯 Bearish target: $531
🧠 Additional Insights:
The 3 SMA indicator is currently positioned above the consolidation zone, potentially acting as dynamic resistance.
This area holds strategic importance for the Binance Smart Chain (BSC) ecosystem, making price behavior here highly significant.
⚠️ Final Notes:
We are at a crucial inflection point in the market. So:
Watch candlestick behavior closely
Maintain proper risk management
Wait for clear breakout confirmation before entering any trade
I love you all so much . 👀
don't forget about capital management and risk management .
Be careful with your positions . 🥇

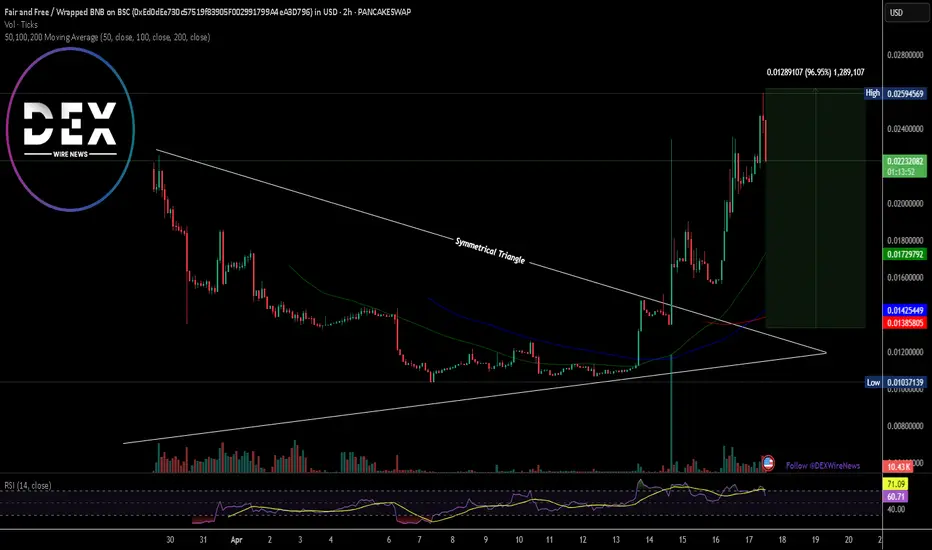
$FAIR3 Broke Out of a Symmetrical Triangle Surging 96% in 2 DaysThe price of Fair and Free token ($FAIR3) surged 96% for the past 2 days amidst breaking out of a bullish symmetrical triangle pattern.
Built on the Binance smart chain blockchain ecosystem, the aim of the project is to advocate for a Web3-based system that empowers creators through ownership of their data and intellectual property, decentralized monetization, and AI-assisted tools.
The goal is to establish a more equitable creative ecosystem where creators directly benefit from their work.
While listed only on BingX as the only popular CEX, this BNB chain token might just be gearing up for another legged up as more CEX listings could pave way for a break out.
The Asset holds a Coin Market cap profile Rating score of 87%, this is a metric derive by Coin market cap to highlight legits projects from Honey pots scams, and with a rating of 87%, $FAIR3 is on a cusp of a another legged up.
With the RSI at 69, the token has consolidated after the bullish campaign, we might experience a respite before another bullish run to shake off weak hands.
On a bullish note, data from Defilama shows about $5.431 Billion has been locked in Total value lock (TVL) in the Binance Smart chain ecosystem. This data shows a growing number of Defi and crypto projects being built and integrated into the chain, hinting on a level of trust that projects have on the BNB chain.
Fair and Free Price Data
The Fair and Free price today is $0.024145 USD with a 24-hour trading volume of $2,452,407 USD. Fair and Free is up 26.01% in the last 24 hours. The current CoinMarketCap ranking is #714, with a market cap of $22,595,600 USD. It has a circulating supply of 935,814,213 FAIR3 coins and a max. supply of 935,814,213 FAIR3 coins.
#LITUSD 1DAYLITUSD (1D Timeframe) Analysis
Market Structure:
The price is currently testing a key support level, which acts as a critical decision zone. If the support holds, a bounce may occur, signaling a potential bullish move. However, if the price breaks below the support and retests it as resistance, further downside may follow.
Forecast:
- A buy opportunity may arise if the price shows a strong bounce from the support level.
- A sell opportunity could be considered if the support level breaks down and gets confirmed as resistance after a retest.
Key Levels to Watch:
- Entry Zone: A buy position can be considered if bullish confirmation appears at support, while a sell setup requires a confirmed breakdown and retest.
- Risk Management:
- Stop Loss: Below support for buy trades and above retest resistance for sell trades.
- Take Profit: Targeting key resistance levels for buy setups and lower support zones for sell setups.
Market Sentiment:
The market is at a critical level where price action confirmation is necessary. Traders should wait for a clear reaction at the support level before making a decision.

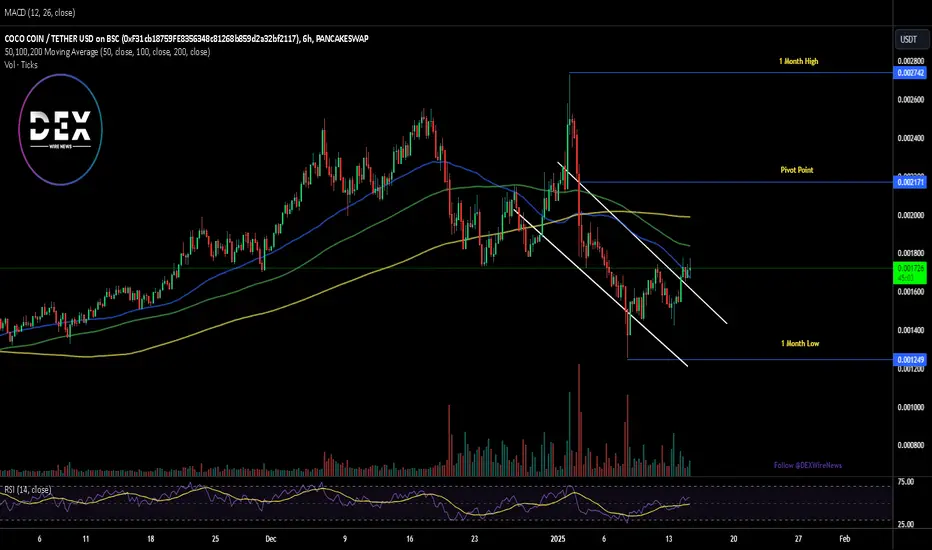
Breaking: COCO Poised for 50% Surge Amidst Falling Wedge PatternCOCO Coin ( NASDAQ:COCO ), a community-driven token built on the BNB network, has been making waves since its launch in 2024. The project, symbolized by the iconic Viral Frog, emphasizes organic, community-led growth and boasts robust fundamentals. Following a sharp retracement of nearly 50% from its all-time high on January 2, 2025, COCO now presents an intriguing opportunity for investors as it forms a bullish falling wedge pattern.
Technical Analysis
As of the time of writing, NASDAQ:COCO has gained 4%, trading within a bullish engulfing pattern. The daily price chart reveals a falling wedge pattern, a classic bullish reversal signal. Notably, yesterday’s candlestick broke through the upper boundary of the wedge, signaling a potential upward trend.
The Relative Strength Index (RSI) is currently at 56.68, indicating a neutral zone that provides ample room for further price growth. With the RSI neither overbought nor oversold, NASDAQ:COCO ’s price action aligns with the potential for a 50% surge. Furthermore, the trading volume in the last 24 hours stands at $1,661,011, reflecting strong market activity despite a recent 32.30% decline.
Token Overview
COCO Coin’s foundation is built on transparency and security. The project raised $24.37 million through contributions between June 29 and August 2, 2024. Demonstrating its commitment to fairness, the team refunded all contributions by August 7, 2024, and airdropped new tokens at a 1:10 ratio. Liquidity was added on August 5, 2024, and permanently locked by August 12, 2024. Additionally, COCO’s smart contracts have been audited by Certik, ensuring investor confidence.
The project’s user base has grown rapidly, with over 170,000 token holders since its launch. Daily trading volumes range between $1 million and $3 million, showcasing strong liquidity and market interest. COCO’s decentralized application (DApp) further enhances its ecosystem, offering a secure and user-friendly platform for its community.
Market Performance and Metrics
- All-Time High: $0.002686 (January 2, 2025)
- Current Price: 34.28% below the ATH
- All-Time Low: $0.0006904 (September 28, 2024)
- Market Cap: $60,148,126
- Fully Diluted Valuation: $60,148,126
Despite its retracement, COCO’s price has increased by 11.30% over the past week, outperforming both the global cryptocurrency market (+1.10%) and its BNB Chain peers.
Future Prospects
COCO’s roadmap outlines ambitious plans, including marketing campaigns and strategic partnerships in Q3 2024, new feature launches in Q4 2024, and ecosystem expansion in Q1 2025. These initiatives aim to solidify COCO’s position within the BNB Chain ecosystem and attract further user participation.
The project’s market-making team ensures liquidity and price stability, minimizing volatility and fostering a conducive environment for active trading. With a strong community-driven model and a focus on user engagement, NASDAQ:COCO is well-positioned for sustained growth.
Conclusion
COCO Coin presents a compelling opportunity for investors, driven by its robust fundamentals and promising technical setup. The breakout from the falling wedge pattern, coupled with a favorable RSI and strong community backing, suggests that NASDAQ:COCO could achieve a 50% surge in the near term. As the project continues to execute its roadmap and expand its ecosystem, it remains a noteworthy contender in the BNB Chain landscape
Cheems Token ($CHEEMS): Set for Breakout Amid Bullish IndicatorCheems Token ($CHEEMS), the dog-themed memecoin built on the Binance Smart Chain, has captured the attention of crypto enthusiasts and traders alike. Boasting a vibrant community across platforms like X and Telegram, and a market cap exceeding $211 million, $CHEEMS is showing strong signs of a potential breakout. Let’s delve into the technical and fundamental aspects driving this momentum.
Technical Analysis
The daily price chart of $CHEEMS reveals a symmetrical triangle pattern, often considered a precursor to significant price movement. This setup indicates a period of consolidation, with the possibility of a breakout in either direction. However, current indicators favor a bullish scenario.
Relative Strength Index (RSI)
With the RSI sitting at 55, $CHEEMS is neither overbought nor oversold, suggesting room for upward movement. This metric lends credence to the bullish thesis, signaling a potential price surge.
Key Moving Averages (MA)
$CHEEMS is trading above critical moving averages, a bullish signal that reinforces the likelihood of upward momentum. Additionally, the chart displays a bullish engulfing pattern, further strengthening the breakout narrative.
Price Targets
Based on the technical setup, $CHEEMS could experience a 50-100% price increase, targeting its one-month high or even achieving new all-time highs.
Project Overview
Cheems Token pays homage to the "lord of memes," a Shiba Inu beloved by the crypto community. The project aims to unite those who have faced challenges in the volatile crypto market, offering a sense of community and hope.
Unique Features
$CHEEMS stands out by:
- No Control Permissions: The project has relinquished control of the contract.
- No Tax Income or Team Reserves: $CHEEMS is 100% market-driven, with no hidden agendas.
- Community Focus: The token’s ethos is rooted in meme culture and collective growth.
Use Cases
The token serves various purposes, including:
- Swapping: Seamless token exchanges.
- Investing: Opportunities within its ecosystem.
- Ecosystem Projects: Supporting decentralized applications and innovations on the Binance Smart Chain.
Market Performance
$CHEEMS has a daily trading volume of $7.76 million, though this marks a 78.10% decrease from the previous day. This dip could signify a temporary lull before the anticipated breakout.
Historical Performance
- All-Time High: $0.000005139 on November 25, 2024, placing the current price 26.18% below its peak.
- All-Time Low: $0.00000003343 on September 4, 2023, with a staggering 17,825.78% increase since then.
Market Metrics
- Circulating Supply: 200 trillion tokens.
- Fully Diluted Valuation (FDV): $211.37 million, assuming the maximum supply of 220 trillion tokens.
Future Outlook
Cheems Token remains committed to its roots in meme culture while expanding its presence on the Binance Smart Chain. The project’s roadmap emphasizes continued building and innovation, ensuring long-term viability.
Where to Trade $CHEEMS
$CHEEMS tokens are available on decentralized exchanges like PancakeSwap V3 and centralized platforms such as Gate.io. The most active trading pair is LISUSD/CHEEMS on THENA FUSION, with a 24-hour trading volume of $10,694.54.
Conclusion
Cheems Token combines strong technical indicators with a unique, community-driven ethos, positioning itself for significant growth. As the crypto market braces for a potential breakout, $CHEEMS’s vibrant community and robust fundamentals make it a compelling contender in the memecoin space. Whether you’re a seasoned trader or a newcomer, $CHEEMS offers a unique blend of humor, resilience, and opportunity.

BNB SWING LONG IDEA - ALTCOIN SEASON - BNB CHAINBNB is one of the most stable coins in the crypto market. With Binance officially backing it, BNB is relatively safer compared to other altcoins.
Technical Analysis: The price hit and wicked into the monthly demand zone during the August 5th dump, showing a strong rejection and initiating an upward trend. This move established a weekly demand zone by breaking the weekly structure, and as it did so, it created a daily demand zone, which is a significant area for me.
Currently, the price is back into the daily demand and has reached the optimal trade entry zone according to the Fibonacci levels. I anticipate an upward movement from here in the coming days.
Targets: The initial target is $613-$619, with potential to reach the all-time high at $722.
Note: Watch out for the U.S. Presidential Election, as it may cause volatility with long wicks that could stop out positions.

#UNFIUSDT #4h (ByBit) Rising wedge near breakdownUnifi Protocol printed an evening star and seems about to lost 200MA support, let's try a short.
⚡️⚡️ #UNFI/USDT ⚡️⚡️
Exchanges: ByBit USDT
Signal Type: Regular (Short)
Leverage: Isolated (5.0X)
Amount: 5.1%
Current Price:
4.5160
Entry Targets:
1) 4.5045
Take-Profit Targets:
1) 3.803
Stop Targets:
1) 4.856
Published By: @Zblaba
NYSE:UNFI BYBIT:UNFIUSDT.P #Unifi #DAO unifiprotocol.com
Risk/Reward= 1:2.0
Expected Profit= +77.9%
Possible Loss= -39.0%
Estimated Gaintime= 1 week

Why BNB will Break Above $4,000: A Technical Analysis BNB, the native token of the Binance blockchain ecosystem, has been exhibiting remarkable strength and resilience amidst the recent market downturn. While the overall cryptocurrency market has experienced significant volatility, BNB has held its ground and demonstrated a strong potential for continued growth. This article delves into the technical and fundamental factors that support BNB's bullish outlook and suggest its price could surpass $4,000 in the coming months.
Technical Analysis:
Daily Timeframe:
BNB has consistently formed bullish triangles on the daily timeframe, breaking out of each pattern with upward momentum. The most recent breakout propelled BNB from $300 to $600, marking a remarkable 100% gain. This pattern suggests that BNB is poised for another significant upward move.
Weekly Timeframe:
Currently, BNB is trading within a horizontal accumulation pattern on the weekly timeframe, a consolidation phase that has lasted for over 1,000 days. However, within this larger consolidation, BNB has established a tighter trading range, creating a spring-like effect. This pattern suggests that a breakout from the horizontal range and a surge towards $5,000 could be imminent.
Monthly Timeframe:
On the monthly timeframe, BNB has never exhibited bearish sentiment, consistently trading within an ascending channel. This uptrend has been further reinforced by a recent retest of the lower channel boundary, demonstrating strong support and a continuation of the uptrend.
Fundamental Factors:
Binance Ecosystem Growth:
The Binance ecosystem has experienced tremendous growth in recent years, expanding its services, user base, and transaction volume. This growth has directly benefited BNB, increasing its utility and demand.
BNB Burning Mechanism:
Binance regularly burns significant amounts of BNB through its buyback and burn program. This mechanism reduces the circulating supply of BNB, creating scarcity and driving up its price.
Staking Rewards:
BNB holders can earn attractive staking rewards by locking up their tokens and participating in various validation nodes. These rewards further enhance the token's value and incentivize long-term holding.
Inflation Resistance:
Unlike fiat currencies, BNB's supply is capped, making it inherently resistant to inflation. This characteristic positions BNB as a hedge against inflation and a store of value.
Conclusion:
BNB's technical analysis and fundamental factors paint a compelling picture of a token poised for significant growth. The consistent bullish patterns, strong ecosystem growth, token burning mechanism, staking rewards, and inflation resistance all contribute to BNB's bullish outlook. While market conditions can always change, the weight of evidence suggests that BNB has the potential to break above $4,000 and continue its upward trajectory.

the magical 3rd wavecrab harmonic pattern:
X=$298
A=$0.009
AB=0.61 XA
BC=0.38 AB
0.78 BC=$3.32
0.88 BC=$4.25
1.6 BC=$25.7
0.78 XA=$32.24
2 BC=$65.66
0.88 XA=$91.2
2.24 BC=$118.4
2.6 BC=$300
1.13 XA=$1153
3.6 BC=$3495
1.27 XA=$5046
4.23 BC=$15950
1.41 XA=$21190
1.6 XA=$184227
