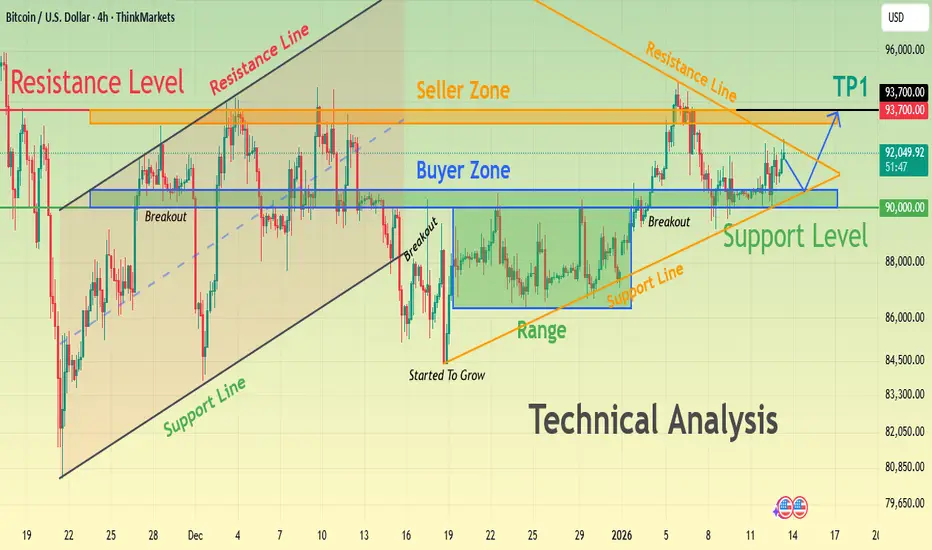
BTCUSD Consolidation Before the Next Big MoveHello traders! Here’s my technical outlook on BTCUSD (4H) based on the current chart structure. Bitcoin is trading within a broader bullish structure after reclaiming key levels and breaking above previous consolidation zones. Earlier on the chart, price respected a rising support line and formed a series of higher lows, signaling growing buyer strength. After a brief pullback, BTC entered a consolidation range, where the market paused before continuing higher. This range acted as an accumulation zone, and the subsequent breakout confirmed renewed bullish momentum. Currently, BTCUSD is trading above the Buyer Zone around the 90,000–91,000 area, which aligns with previous resistance turned support. Price recently broke out from this zone and is now consolidating just below the Seller Zone / Resistance Level near 93,700. This resistance also aligns with a descending resistance line, increasing its significance and making it a key reaction area. My scenario: as long as BTCUSD holds above the Buyer Zone and respects the rising support line, the bullish structure remains intact. A clean breakout and acceptance above the 93,700 Resistance Level would confirm continuation toward the next upside target (TP1). However, a strong rejection from resistance could lead to a corrective pullback back into the Buyer Zone before any further attempt higher. For now, price remains compressed between support and resistance, and a decisive move is likely soon. Please share this idea with your friends and click Boost 🚀
Bitcoin (Cryptocurrency)
BTCUSDT: Pullback To 93K Support Before Return of Bullish TrendHello everyone, here is my breakdown of the current BTCUSDT setup.
BTCUSDT previously transitioned from a strong bearish impulse into a recovery phase, where price formed a well-defined upward channel, signaling a corrective bullish structure. Within this channel, Bitcoin produced higher highs and higher lows, confirming temporary buyer control after the sell-off. During this phase, price also formed a consolidation range, reflecting a pause and balance between buyers and sellers before the next move. As price advanced, BTCUSDT approached a major Resistance Zone around 95,500–96,000, where selling pressure became evident. Multiple tests of this area failed to produce acceptance above resistance, and a clear rejection / test occurred at the top of the channel. This behavior indicates supply dominance at higher levels. Following the rejection, price broke below the upper channel structure and pulled back toward the Support Zone near 93,000, which previously acted as both demand and a breakout level.
Currently, BTCUSDT is trading below the resistance zone and showing signs of weakness after the failed breakout attempt. The recent breakout below minor support suggests a potential continuation to the downside, while the broader structure remains vulnerable as long as price stays capped below resistance.
My Scenario & Strategy
My primary scenario remains bearish while BTCUSDT trades below the 95,500–96,000 Resistance Zone and continues to show rejection from the upper channel. Any pullbacks toward resistance that show weakness or rejection may offer short opportunities, with downside continuation toward the 93,000 Support Zone as the first objective. A decisive breakdown below support would open the door for a deeper corrective move.
However, a strong breakout and acceptance above resistance would invalidate the short bias and signal a shift back toward bullish continuation. I believe there will be a correction to around 93K, and then a resumption of the bullish scenario.
That's the setup I'm tracking. Thank you for your attention, and always manage your risk.

Bitcoin Ranges as Middle East Tensions Raise Sell-Off RiskBitcoin( BINANCE:BTCUSDT ) has experienced both bullish and bearish moves over the past few days under the influence of various news events, resulting in a clear ranging structure.
One key factor that must be considered for Bitcoin and other risk assets is the escalation of tensions in the Middle East. This situation can act as a catalyst for sudden sell-offs across Bitcoin and the broader crypto market.
Currently, Bitcoin is trading near resistance lines, as well as the Cumulative Short Liquidation Leverage($93,150-$92,970), and has reacted precisely to the Potential Reversal Zone(PRZ) .
From an Elliott Wave perspective, Bitcoin appears to be completing a Double Three Correction (WXY) within this short-term range.
I expect Bitcoin to make another attempt toward the lower line of the ascending channel.
If this level breaks, we should be prepared for a deeper decline toward the Cumulative Long Liquidation Leverage zone($90,360-$89,360).
First Target: $90,773
Second Target: $89,903
Stop Loss(SL): $90,923
Points may shift as the market evolves
CME gap: $88,720-$88,120
What do you think about Bitcoin in the short term? I’d love to hear your thoughts!
Cumulative Long Liquidation Leverage: $87,125-$86,000
💡 Please respect each other's opinions and express agreement or disagreement politely.
📌Bitcoin Analysis (BTCUSDT), 1-hour time frame.
🛑 Always set a Stop Loss(SL) for every position you open.
✅ This is just my idea; I’d love to see your thoughts too!
🔥 If you find it helpful, please BOOST this post and share it with your friends.

BTCUSDT: Compression Before the Move (IH&S Inside Triangle)Hi!
Price is still moving inside a symmetrical triangle, showing clear compression and indecision. An inverse head & shoulders is visible, but the breakout so far is weak and needs confirmation.
Short-term expectation:
A push-up is likely toward the gray resistance zone around 91,330. From there, a reaction/pullback is expected, with the price potentially dropping back toward the bottom line of the triangle.
Key scenarios:
• Bullish: Clean break and hold above the upper trendline → targets 93,200 – 93,500
• Bearish: Rejection from resistance and breakdown of the lower trendline → downside toward 89,400 – 89,000
This is still a patience zone. Let price show its hand before committing.

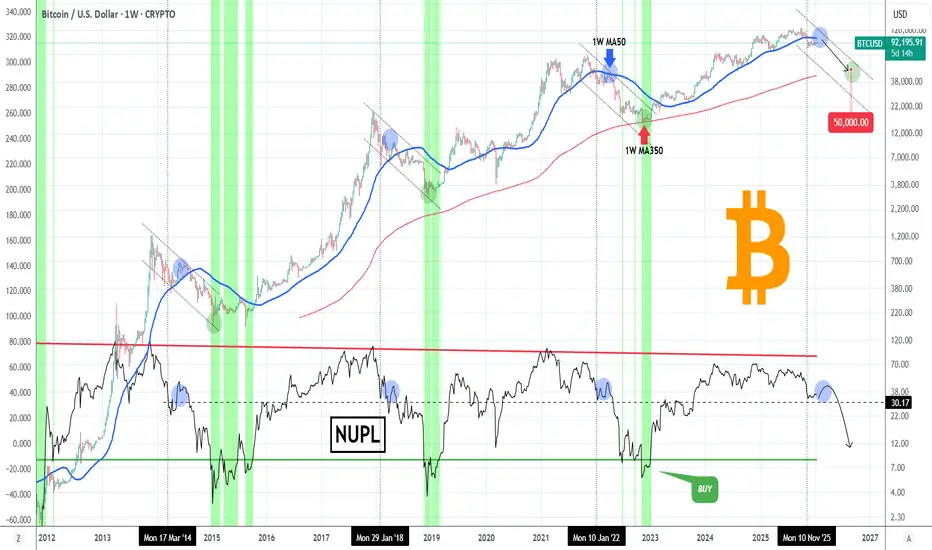
BITCOIN This is one of the best indicators for buying the bottomBitcoin (BTCUSD) continues to consolidate during these (almost) past 2 months as it is headed towards a 1W MA50 (blue trend-line) test, where it was rejected on the last Bear Cycle and started its Stage 2. This Stage is what typically leads to the Cycle bottom, which is essentially the most optimal level for a long-term investor to enter/ buy.
One of the best indicators to call out a Cycle bottom is the Net Unrealized Profit Loss (NUPL). As you can see (black trend-line), when this has historically hit its green line, BTC was on excellent buy opportunity levels (green vertical zones) as the Bear Cycle bottom was priced immediately after.
The last Cycle bottom also happened to be exactly on the 1W MA350 (red trend-line), which the March 2020 COVID flash crash also approached. As a result, it would be no surprise to see BTC hit that level on the next Cycle bottom as well, which according to its current trajectory, this test could be around $50000. But as mentioned, the strongest buy indication would be the NUPL touching its green trend-line regardless of BTC's price at the moment.
So what do you think? Will the NUPL be a indicator that you will look out for? Feel free to let us know in the comments section below!
---
** Please LIKE 👍, FOLLOW ✅, SHARE 🙌 and COMMENT ✍ if you enjoy this idea! Also share your ideas and charts in the comments section below! This is best way to keep it relevant, support us, keep the content here free and allow the idea to reach as many people as possible. **
---
💸💸💸💸💸💸
👇 👇 👇 👇 👇 👇
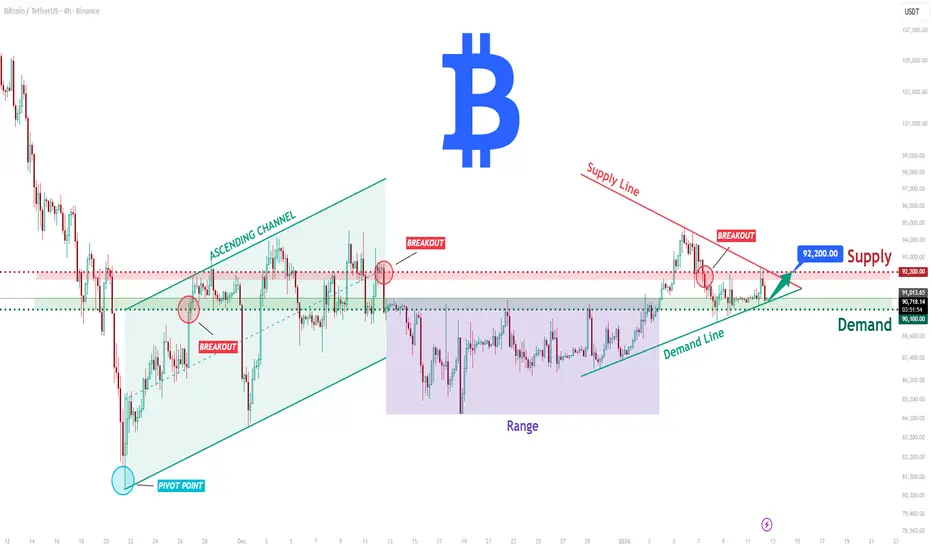
BTCUSDT Long: Demand Holding at 90,100 - Eyes on 92,200 SupplyHello traders! Here’s a clear technical breakdown of BTCUSDT (4H) based on the current chart structure. After a strong bearish move, BTC formed a clear pivot low, from which price transitioned into a bullish recovery phase. From this pivot point, the market developed a well-defined ascending channel, confirming a shift in market structure and increasing buyer control through a sequence of higher highs and higher lows. This channel guided price higher until BTC reached a key Supply Zone around 92,000–92,200, where selling pressure emerged. At this supply area, price experienced a rejection and breakout failure, indicating that sellers are actively defending this level. Following the rejection, BTC briefly broke below short-term structure and moved into a consolidation range, reflecting temporary balance between buyers and sellers. More recently, price has started to recover again, respecting a rising Demand Line, which signals that buyers are still defending the broader bullish structure.
Currently, BTC is trading between a key Demand Zone near 90,100–90,300 and the overhead Supply Zone around 92,200. This area represents a critical decision zone for the market, where the next directional move is likely to be defined.
My scenario: as long as BTCUSDT holds above the Demand Zone and continues to respect the rising demand trend line, the bullish bias remains valid. I expect buyers to attempt another push toward the 92,200 Supply Zone. A clean breakout and acceptance above this level would confirm bullish continuation and open the door for further upside. However, a strong rejection from supply followed by a breakdown below demand would weaken the structure and increase the probability of a deeper corrective move. For now, price remains in a compression phase between demand and supply — patience and proper risk management are key. Manage your risk!
BTC - Structure Flip, Next Leg Loading...BTC just did something important.
Price broke above a key resistance, and that level has now flipped into support. This kind of structure shift usually confirms that the previous range is done and a new leg is starting.
That said, this doesn’t mean price can’t breathe.
A pullback toward the $92,000 demand zone is still possible, especially since it lines up nicely with the lower blue trendline. If that happens, it would still be considered a healthy correction.
As long as structure holds, the expectation remains the same:
one more impulse higher, with the $100,000 round number acting as the next magnet.
⚠️ Disclaimer: This is not financial advice. Always do your own research and manage risk properly.
📚 Stick to your trading plan regarding entries, risk, and management.
Good luck! 🍀
All Strategies Are Good; If Managed Properly!
~Richard Nasr

BTCUSD – The Uptrend Is Being ReinforcedAs the market waits for key macroeconomic data, BTCUSD is telling a clear and constructive technical story: price is building a solid base for a sustainable uptrend, rather than reacting in a chaotic way to short-term news.
Looking at the chart, Bitcoin continues to maintain a structure of higher lows, closely respecting a long-term ascending trendline. Each corrective move has stalled precisely within demand zones, confirming that active buying interest remains present. Most importantly, price is now holding firmly above the Ichimoku Kumo — a strong signal that the bullish trend is being accepted by the market, not merely forming a temporary technical rebound.
The 89,400 USD zone is acting as a key support level. Repeated positive reactions from this area clearly highlight it as a defensive zone for buyers. In a constructive scenario, as long as BTCUSD continues to hold above this support and absorb short-term volatility, the next upside objective points toward 94,900 – 95,000 USD, aligning with the upper supply zone and previous reaction highs.
When combined with the news backdrop, as long as CPI data does not come in excessively “hot” , Bitcoin has a solid foundation to extend its current bullish momentum. Technical structure remains supportive, while overall market sentiment is gradually stabilizing — a combination that favors continuation rather than reversal.

BTCUSD I Potential Accumulation BreakoutWelcome back! Let me know your thoughts in the comments!
** BTCUSD Analysis - Listen to video!
We recommend that you keep this on your watch list and enter when the entry criteria of your strategy is met.
Please support this idea with a LIKE and COMMENT if you find it useful and Click "Follow" on our profile if you'd like these trade ideas delivered straight to your email in the future.
Thanks for your continued support!

BTC Daily Bear Flag - Pullback inboundBitcoin has been trying to consolidate for the past month after falling from it's peak in November of $121k. The structure of this bear flag is 3 months in the making and far from complete - expect a pullback into the $90-91k level in short order.

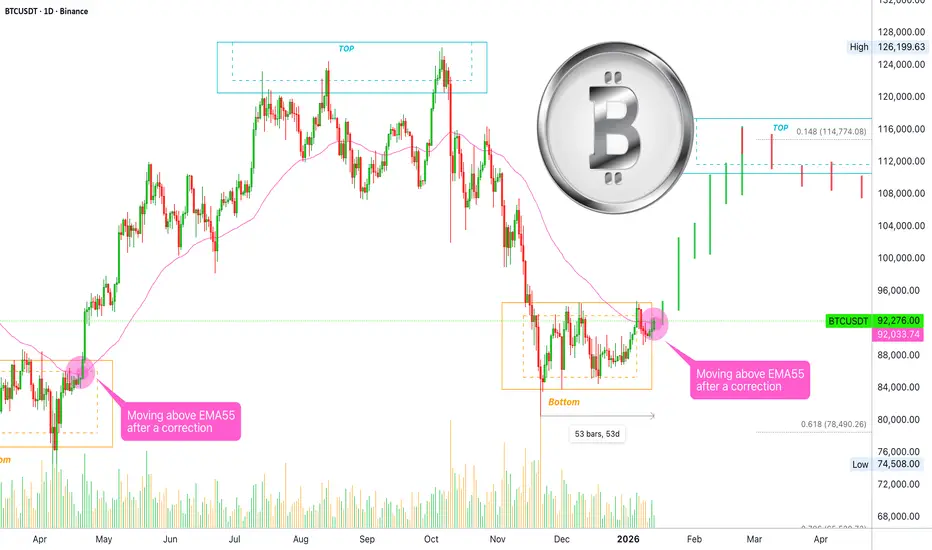
Bullish continuation confirmed —Bitcoin moves above EMA55Once the action moves and closes daily above EMA55, a major advance is fully confirmed.
The last time Bitcoin moved above EMA55, after a correction/coming from a low point, was 21-April 2025. This development resulted in massive growth and a new all-time high, the continuation of the bullish trend.
Bitcoin started to go down 7-October to hit bottom 21-November. The entire move lasted 46 days. From 21-November through 13-January 2026, we have 53 days. So the recovery period has been going longer than the entire correction. This is enough to say that the bearish move is over.
Now, Bitcoin already moved once above EMA55 on the fifth of January just to be rejected. A classic rejection. The rejection ended up being a minor retrace and now we are back above this level.
The move you are seeing now will take Bitcoin above $100,000 for sure. Bitcoin is likely to hit $110,000 and it is possible going a bit higher. Anything goes. It can go even higher or peak a bit lower. After the relief rally, it goes back down to produce a lower low. After the final low, the market will settle and start a new cycle. This new cycle can last years, just like we saw Bitcoin growing from November 2022 until October 2025.
The next one can be: The low August 2026 with a high some time around 2029. The low can happen in June, July, August, October, November... Who knows. There can be strong variations because the market is more mature now, it is bigger now, and it is very hard to predict exact dates.
We know that some time around Q3 the market will be resting in order to go bullish again.
Q1 2026, NOW!, we get strong bullish action.
Thank you for reading.
Namaste.
#BTCUSDT #12h (Bitget) Descending trendline breakout [LONG]Bitcoin looks ready for short-term recovery after regaining 100EMA support and pulling back to it.
⚡️⚡️ #BTC/USDT ⚡️⚡️
Exchanges: Bitget Futures
Signal Type: Regular (Long)
Leverage: Isolated (8.0X)
Amount: 4.7%
Current Price:
92299.9
Entry Zone:
92024.8 - 90186.8
Take-Profit Targets:
1) 96927.7
2) 101312.3
3) 105696.9
Stop Targets:
1) 86234.0
Published By: @Zblaba
CRYPTOCAP:BTC BITGET:BTCUSDT.P #12h #Bitcoin #PoW bitcoin.org
Risk/Reward= 1:1.2 | 1:2.1 | 1:3.0
Expected Profit= +51.1% | +89.6% | +128.1%
Possible Loss= -42.8%
Estimated Duration= 3-4 weeks

BITCOIN (BTCUSD): Road to 100k
Bitcoin finally completed a bullish accumulation within
a huge ascending triangle pattern on a daily..
There is a high probability that the market will continue
rising now.
The next strong resistance cluster is 98800 - 101200 area.
I think that it will be reached soon.
❤️Please, support my work with like, thank you!❤️
I am part of Trade Nation's Influencer program and receive a monthly fee for using their TradingView charts in my analysis.

BTC Stalls at Premium After Vertical Rally — Liquidity Below Hi Guys!! On the H1 chart, Bitcoin has just completed a strong impulsive bullish leg, breaking cleanly above the EMA 89 and accelerating straight into a clearly defined resistance zone around 95,700. This type of vertical expansion typically reflects aggressive buy-side execution, but it also leaves the market structurally imbalanced. As price reaches the resistance area, momentum noticeably slows and candles begin to compress, signaling that buyers are no longer willing to chase at premium levels while early longs start to take profit.
The current price action should be read as a post-impulse distribution and pause, not immediate trend continuation. With price holding just beneath resistance and failing to produce strong bullish follow-through, the probability increases that the market will rotate lower to rebalance. Below current price lies a series of stacked liquidity pools and inefficiencies, first around 94,080, then 93,146, and deeper toward 91,800–90,900, which also aligns closely with the rising EMA structure. These levels represent logical downside magnets where sell-side liquidity rests after the sharp rally.
From a market structure perspective, a pullback into these zones would be technically healthy, allowing Bitcoin to mitigate the imbalance created by the impulsive move and test whether demand is genuinely strong or merely momentum-driven. If price reacts positively and shows acceptance within the lower liquidity zones, that would provide a stronger base for a renewed bullish continuation later on. However, only a clean and sustained acceptance above the 95,700 resistance would invalidate the corrective scenario. Until then, Bitcoin remains in a premium consolidation phase, with downside liquidity acting as the dominant draw before the next major directional decision.

BTC Roadmap 2026-2027 ~ $320KHello BTC Watchers.
A quick update on BTC outlook for 2026 and a possible target for the next 2 years.
Incase you missed the explanation on the logarithmic chart, I mapped out the date-ranges, as well as how far the price fell logarithmically after each top. You'll see the word "lines" on the chart. This simply indicates the amount of diagonal trendlines it has fallen. By using this pattern-dedicated approach, a commonality is found which may be useful in speculating a future price. Because if not for past history, how else would we speculate on the future?
It's interesting to note that the past 3 ATH's (all time high's) are each lower than the previous if you compare it not to price but to the "lines". Even the fifth high (the one coming next) will be on a lower click-line than the previous, and that estimate is already over 300k. This is a really helpful way to speculate a future high because usually, on a regular-view chart, the zone above the ATH is uncharted territory. You could use a Fibonacci trend-based extension, but this is limited to the cycle that you're using for input points. Logarithmic chart + indicators factor in the entire history of the price.
This would mean the new peak could be in 2026 around USD 300k.
It's important to note that this ay not be a straight line up. As you'll see, although the price has been increasing exponentially, there have been periods of hard pullbacks or corrections. These are great times to enter the market, NOT when the price is close to the peak of the curve (in green).
So currently, it's likely we're seeing the beginning of a slow bearish cycle / correction or dip in the road before starting another impulse wave up towards a new ATH.
In the short term, it may seem like we're bullish due to the flag patterns showing up everywhere. But in reality, this is more likely a corrective bounce up before another minus 20% - 30% drop:
Moreso, before we consider a MEANINGFUL reversal we must first see a daily candle close ABOVE the 200d MA< which is the upper grey:

Is The BTC Bitcoin MONSTER Trade Setting Up? My Trade Plan.🔥 Is Bitcoin’s Next Big Move Starting Right Now?
Another close look at Bitcoin today 👀📊 — and we’re seeing the move we discussed in yesterday’s video starting to play out.
After yesterday’s aggressive volatility ⚡, price has now delivered the break of structure we were watching for. On the 30-minute chart, the market is printing a clear higher high and higher low sequence 📈 — a constructive sign for bullish continuation.
Price is also holding above the Point of Control and value area on the volume profile 🧠📉, which adds further strength to the current structure.
If we stay patient and continue to build positions strategically, as outlined in recent videos, this setup has the potential to develop into something much larger 🚀. Especially if Bitcoin transitions into a higher-timeframe bullish trend — potentially even a broader trend reversal.
That said, it’s still early days ⏳. We don’t assume — we wait for confirmation.
What I’m watching next is a clean break above the previous highs, followed by strong support on the retest 🔁. A successful break and hold above that level would open the door for another high-quality Buy opportunity ✅📈.
Let’s see how price behaves from here.
⚠️ Not financial advice. Always manage risk.

Injective (INJ) – Spot Long Setup Amid Sector StrengthThere’s been a noticeable bounce across several gaming and Web3 tokens in the last 24 hours, and Injective (INJ) could be one of the next to follow. With broader sentiment improving and technicals stabilizing, we're watching INJ closely for a potential continuation higher in the short to medium term.
🔹 Entry Zone: $5.20–$5.45
🔹 Take Profit Targets: $7.00–$8.00 (TP1), $10.00–$12.00 (TP2)
🔹 Stop Loss: Just below $5.00
We’re currently accumulating INJ around the support range, aiming to ride a potential move higher over the coming weeks. The setup offers a clean structure with a defined invalidation and multiple reward zones, aligning well with recent sector momentum.
🔔 Always manage your risk appropriately.

MSTR Trade Setup – BTC Correlation PlayMicroStrategy NASDAQ:MSTR caught a strong bid in yesterday’s session, driven by upward momentum in Bitcoin (BTC). With MSTR’s heavy BTC exposure, it often mirrors crypto market trends—and right now, it’s pressing against a key resistance zone.
🟢 Setup:
We're watching the $173.00 resistance level for a potential breakout and clean retest. A successful confirmation above this zone would trigger a long spot entry. Volume confirmation and BTC’s price action will be critical for conviction.
🎯 Targets & Risk:
TP Zones: $200–$230, then $280–$320
Stop Loss: Below $155
This is a momentum-based setup tied closely to BTC’s direction. Monitoring both charts is essential for trade management.

Is Our Bitcoin Monster Trade Really Shaping Up? So Far So Good.In the last two videos, we’ve been tracking this potential monster trade 👀📈.
In this video, we take it to the next stage 🔍.
So far, everything is looking solid ✅ — we’re securing profits 💰, however the next level is a bit more delicate ⚠️ as price is now trading into a key resistance zone. A deeper pullback is definitely possible from here.
Either way, here’s a full breakdown of the charts and my current analysis 📊🧠.

Lumens Back up to a Quarter each in 2020inflation mechanism is gone, and the bottom barrel supply distribution is complete
nowhere to go but UP when everyone is either a FOMO buyer in the money, or a bagholder along for the reunion tour


SOL 1D Update: Looking to establish new uptrendSOL update.
SOL is now establishing a new short-term uptrend after spending months inside a descending channel. The key shift is structural: price has broken out of the downtrend and is no longer making lower lows. Instead, it’s holding above former support around the $125 level and building higher lows, which is exactly what you want to see in an early trend transition.
The move higher toward the $140–145 area has been more controlled and constructive than prior bounces. Instead of sharp relief moves that fade immediately, SOL is grinding higher and holding gains, suggesting real demand rather than just short covering.
This strength is also starting to show up across the Solana ecosystem. Several SOL meme coins are attempting to break out of their own basing structures, which typically happens when SOL itself stops trending down and begins to lead. That kind of breadth is important and often precedes stronger continuation if it sustains.
Key levels to watch:
As long as SOL holds above $125, the uptrend structure remains intact.
Acceptance above $145 opens the door for a move toward the $160–180 region, where heavier resistance sits.
A failure back below $125 would invalidate the breakout and shift this back into range behavior.
Overall, SOL’s character has changed from sell-the-rip to buy-the-dip. It’s still early and likely to be choppy, but the market is finally starting to lean in the right direction. If this structure holds, both SOL and its meme ecosystem have room to expand further.

Bitcoin is completing a bullish triangle (12H)Since we marked the red arrow on the chart the price has entered a bearish phase
This phase appears to be a complex correction likely a double structure as we can observe an ABC plus X wave followed by a triangle formation
We are currently at the end of the second corrective wave with only one wave Wave E of this triangle remaining Once Wave E completes within the green zone the price may enter a bullish phase
In this scenario the recovery will only begin after the completion of Wave E This means that all movements from the current low until now have been part of corrective action and the bearish phase Therefore we can anticipate Bitcoins recovery target to reach around 106000 dollars
It is expected that the price will find support moving from the red zone toward the green zone after which stronger bullish movements could follow
Targets have been clearly marked on the chart for reference
Important A daily candle close below the invalidation level will negate this analysis and suggest a different market scenario
If you have a coin or altcoin you want analyzed, first hit the like button and then comment its name so I can review it for you.
This is not a trade setup, as it has no precise stop-loss, stop, or target. I do not publish my trade setups here.
