BITCOIN Is all hope lost for the Bull Cycle?First of all allow me to begin by saying this: IT IS NEVER FUN to call market tops. Especially on long-term charts, especially on Bitcoin/ crypto. And the reason is that, usually it violently traps most people in. Either for a long time or until they lose all capital. And nobody should take joy in this and as chief analyst here at Tradingshot, I am no exception.
Regardless of that, our thesis here has been pretty simple and for a long time we've been calling for an October exit, as that was when the 4-year Cycle Theory suggested the Bull Cycle would top. I personally hope I am wrong but in all my decades of investing, I learned that 'hope' doesn't get you far here, quite the contrary it teaches you brutal (and often very expensive lessons). The hard facts and historical evidence, point to a new Bear Cycle. And we will keep presenting the charts, the empirical evidence no matter how many followers we lose or how many negative comments we see as they mean nothing to us. Profit making only does.
Now that I got this out of the way, let's see what other key levels Bitcoin (BTCUSD) hit. Yesterday's aggressive decline saw the market making a Low marginally below the Higher Lows trend-line (bottom) of the 3-year Channel Up. Essentially that has been the dominant pattern of the whole Bull Cycle. BTC already closed below its 1W MA50 (blue trend-line) last week, which has historically been a Bear Cycle confirmation, already lost the basic structure of its Bull Cycle rallies by breaking way below the 0.382 Fibonacci retracement level from the previous Higher Low and now faces with the complete breakdown of the pattern - crossing below its bottom.
Needless to say, if BTC closes the week below it, selling could accelerate, with the 1W MA100 (green trend-line), being the market's next long-term Support, where a counter-trend bounce could be possible.
So is this Higher Lows trend-line the last hope of the Bull Cycle? Feel free to let us know in the comments section below!
---
** Please LIKE 👍, FOLLOW ✅, SHARE 🙌 and COMMENT ✍ if you enjoy this idea! Also share your ideas and charts in the comments section below! This is best way to keep it relevant, support us, keep the content here free and allow the idea to reach as many people as possible. **
---
💸💸💸💸💸💸
👇 👇 👇 👇 👇 👇
Bitcoin-btcusd

Bitcoin Warning Signals After October TopBitcoin is breaking back below the $100k level and the channel support drawn from the 2022 lows. This price action suggests that we may be completing the bull cycle that began from those lows—one that lasted roughly three years, similar to previous bullish phases from January 2015 to December 2017 and December 2018 to November 2021.
Given this context, there is now a meaningful risk of a deeper correction. Historically, each new cycle tends to produce shallower percentage pullbacks, but the correction phase is still an important part of the broader market structure. For those looking to position themselves for the next major bull run, it would be safer to wait for the market to undergo a sustained corrective period, potentially lasting around a year, before re-entering with the broader trend.
From an Elliott Wave perspective, Bitcoin may have completed a five-wave impulse within a higher-degree wave (V) of III, aligning with the idea that a higher-degree wave IV correction could now be unfolding. Additionally, from a cyclical standpoint, the market appears to have topped in October 2025, which further supports the probability of entering a bear-market phase.
In summary, Bitcoin may now be transitioning from a multi-year advance into a structurally significant corrective period—one that could provide a healthier foundation for the next major expansionary cycle.
BTCUSD Rebounds From Channel Support — Targeting $93K PullbackHello traders! Let’s break down the current BTCUSD market structure. Bitcoin continues to move within a well-defined descending channel, where price has repeatedly respected both the resistance and support lines. Every touch of the upper boundary resulted in a Turned Around reaction, confirming strong seller dominance throughout the downtrend. After breaking below a key local support, BTCUSD shifted into a deeper bearish phase and moved toward the broader Support Zone beneath $90,000. This level aligns with the lower boundary of the descending channel and has acted as a strong reaction area in previous price swings. Recently, price reached the channel’s support line, where buyers stepped in and formed an early rebound attempt. BTCUSD is now showing signs of a potential short-term correction, with price aiming toward the nearest resistance cluster at $93,000–$96,000, which also represents the mid-channel region and a key retest zone. As long as Bitcoin stays below the descending resistance line, the broader trend remains bearish. However, a corrective move toward TP1 near $93,000 is likely if the current support continues to hold. A rejection from the resistance area could send the price back toward the channel bottom for another test. A confirmed breakout above the descending resistance line would be the first signal of a potential shift in momentum and could open the way for a stronger recovery. Until then, BTCUSD remains in a bearish structure with a possible short-term bullish pullback. Please share this idea with your friends and click Boost 🚀

BITCOIN | LONG BIAS | POTENTIAL REVERSAL AND KEY LEVELS TO WATCHTraders,
Bitcoin is now sitting inside a large falling wedge structure on the daily chart. Wedges of this type often form during trend exhaustion and can precede significant reversals when the lower boundary is reached. This pattern sets the stage for everything that follows in this analysis.
Below is the full breakdown of why I believe Bitcoin is positioned for a potential reaction and where the most important levels are located.
Recap of the Previous Bitcoin Analysis
In the previous IG:BITCOIN analysis
I mentioned two scenarios. Scenario one outlined the following sequence:
• Price pushes into 107k to 108k
• That move sweeps the weak high and taps the AVWAP anchor
• If spot CVD slows or perps shift into net selling, a rejection becomes likely
• That rejection sends price back toward the mid range and possibly into 101k to 102k
• Continuation into the higher timeframe LVN at 98k becomes possible
Every single step unfolded almost perfectly.
Current State of Bitcoin
Bitcoin is now sitting directly on the lower band of the AVWAP anchored from 7 April 2025.
What this means
AVWAP stands for Anchored Volume Weighted Average Price. It calculates the average position of market participants beginning from the chosen anchor point. The April low marked a major shift in trend structure. When price reaches the lower band of an AVWAP anchored to such a significant low, it often acts as dynamic support. This is because it reflects the average entry of early cycle buyers.
If price holds and begins reclaiming from this area, it signals that the strongest hands are defending their positions. If it fails, the market risks a deeper flush into lower demand clusters.
Value Zone Analysis with Fixed Range Volume Profile
To determine whether Bitcoin is inside a significant value region, we use a Fixed Range Volume Profile (FRVP). The range is anchored from the April low to the October high.
Zooming into the profile on the left, price has now re-entered the core value area of this entire swing. The red horizontal line marks the Point of Control, which is the level with the highest traded volume in the entire range. The current low sits almost exactly on this level.
Pixel perfect confluence.
Why this matters
When price returns to the value area after a distribution phase, two possible outcomes appear:
1. Reversal
Buyers defend value and price rotates back toward high volume nodes above.
2. Continuation breakdown
Price accepts below value, meaning even previous buyers are unwilling to re accumulate here. This opens the door to the next low volume pocket and lower demand zones.
Right now, the reaction at this level is critical because we have perfect alignment between the lower AVWAP band and the FRVP Point of Control.
Mathematical Levels and Fibonacci Structure
Now we collect the mathematical evidence. We are sitting at a core AVWAP level and a core FRVP level. Now we check if the market is stretched mathematically.
Bitcoin at the 1.618 Extension
On the four hour spot chart, I apply a Trend Based Fibonacci Extension from A to B and project it from C.
The placement rule
Ask yourself:
What was the last meaningful swing high that ended the previous trend and started the current reversal?
That swing becomes A to B. The first corrective lower high after that becomes C.
Using this structure, Bitcoin has now extended perfectly into the 1.618 level. The 1.618 Fibonacci extension is historically associated with exhaustion. Sharp downlegs often pause, take liquidity, or reverse at this point.
TOTAL at the 2.0 Extension
To confirm that this move is not isolated to Bitcoin, we check the CRYPTOCAP:TOTAL crypto market.
TOTAL reflects the entire crypto market and shows equilibrium conditions.
When Bitcoin and TOTAL stretch at the same time, reaction probability increases.
Start with a retracement from A to B:
Price nearly hit the fifty percent mark but not entirely. Then reverse the tool from B to A. Doing so reveals the extension levels below. Price is now sitting exactly at the 2.0 extension.
Why the 50 percent connects to the 2.0
If a move retraces halfway, the remaining distance becomes the basis of the flipped extension. Doubling that distance gives the 2.0 level.
Because TOTAL did not fully reach the fifty percent retracement, there is a small missing portion. To visualise this, I draw a box between the actual retracement and the fifty percent level. Then I duplicate the box under the 2.0 extension.
The duplicated box lands perfectly on the current low, showing mathematical symmetry.
Additional Mathematical Check
I also check the structure that began after the 10 October crash.
By extending from B to A, the downside projections appear. Price tagged the 1.618 level perfectly.
Full symmetry
Bitcoin at the 1.618
TOTAL at the 2.0
Internal structure at the 1.618
When all three align, the move has reached market wide symmetry. These zones commonly produce strong reactions or reversals.
Summary so far
We now have confluence in four categories:
• AVWAP support
• FRVP Point of Control support
• Fibonacci extensions on BTC and TOTAL
• Mathematical symmetry across multiple swings
Next, we check the internal fuel of the move: order flow.
Order Flow Analysis
Spot CVD Divergence
On both the one hour and thirty minute charts, Spot CVD continues making lower lows while price holds steady. This means aggressive sellers are pushing market sell but price refuses to break down. This can only occur when passive limit buyers absorb the flow.
This is hidden absorption.
Coin Margined Futures CVD
Coin margined CVD shows the same pattern: lower lows while price stays flat.
This indicates aggressive shorting with no continuation.
Why coin margined matters
Coin margined futures use BTC as collateral. When price declines, the collateral loses value. When price rises, shorts lose even more because both their collateral and their position move against them. Coin margined shorts get squeezed harder and faster.
Open Interest
• Stablecoin margined OI: holding steady. Traders continue to open or maintain positions during sell pressure.
• Coin margined OI: compressed during the dump and is now flat. This means shorts are sitting in the market and can be forced out.
Summary
Price stable
CVD falling
OI steady
This is absorption combined with short build-up.
This often leads to a sharp reversal when price begins to lift.
Volume Analysis
Chart:
Accumulation and Distribution (A D Indicator)
The A D indicator shows whether volume flows into candles or out of them.
On the one hour chart, the A/D is trending up while price stays flat. This means buyers are stepping in during down-wicks and absorbing sell pressure. Price is not showing this strength yet, which is typical for accumulation phases.
On Balance Volume (OBV)
OBV measures directional volume flow.
On the last wick down, OBV actually moved up.
This means buyers absorbed the move rather than sellers pushing price down.
This is the classic bullish volume divergence after a liquidity sweep. Both Spot and Perps Confirm
These divergences appear on both spot and perpetual futures. Spot confirmation is the strongest form of validation because it represents real buying without leverage distortion.
The combination of A/D rising, OBV diverging, Spot CVD falling, and Futures CVD falling strongly supports that the sell pressure is being absorbed.
What Happens Next
Based on everything above, I expect Bitcoin to start by taking the weak local high at 99,862. Weak highs form when the wick structure is sloppy and no real sellers defended the level. On fine tick data, this high looks even weaker.
Taking that high breaks the current local structure and potentially triggers a short squeeze. If Bitcoin begins closing four hour candles above 106,200, the next important level is 108,500.
Main Thesis
Bitcoin pushes into the first target zone and performs a Swing Failure Pattern around 115,700. With strong momentum, the move could extend into the 17,300 to 18,000 region.
Invalidation and Downside
If Bitcoin loses support and spends meaningful time below 93,000, the next major support is 84,617. This is the next Point of Control from the AVWAP auction and an extremely important level to watch.
All relevant levels are marked on the charts.
Trade safe and manage risk.
From the depths of the sands,
ThetaNomad
-------------------
If you like my analysis, give it a like and leave a comment so more people can see real analysis without the noise.

BTCUSD Long: Short-Term Correction Eyes $97,500 ResistanceHello traders! BTCUSD continues to trade within a well-defined descending channel, maintaining a broader bearish structure while forming a series of lower highs and lower lows. Throughout the move, the price has created multiple pivot points along both the upper and lower channel boundaries, confirming the strength of this trend. Inside the channel, Bitcoin developed two notable range phases, each reflecting temporary consolidation before continuing downward. A key formation on the chart is the Rounding Top Pattern, which developed near the mid-channel area. This structure signaled weakening bullish pressure and preceded a sharp decline back toward the channel’s lower boundary. After the breakdown, BTC attempted a small recovery, but price failed at the Supply Zone, creating a rejection that aligned with a bearish breakout confirmation.
Currently, the price is approaching the $97,500 short-term target, which sits close to the lower edge of the Supply Zone. This level has acted as a significant reaction area several times, and the market may retest it before deciding the next direction. As long as BTC trades within the descending channel, the broader trend remains bearish, but short-term corrective moves to the upside are possible due to the strong reaction from demand.
My scenario as long as BTCUSD holds above the Demand Zone ($94,000–$94,500) and shows continued strength, a corrective move toward $97,500 remains likely. This level represents the nearest resistance and aligns with previous supply reactions. A clean breakout above $97,500 would open the way for a deeper correction toward the channel’s mid-line or even the upper boundary. However, if price gets rejected at the supply zone again, sellers may regain control and attempt another push back toward the demand area. A confirmed break below the Demand Zone would invalidate the bullish recovery setup and could trigger continuation of the broader downtrend. For now, the structure supports short-term bullish correction, but overall trend remains bearish until the descending channel is broken. Manage your risk!

BTCUSD: Buyers Aiming for a Move Toward 99,000 ResistanceHello everyone, here is my breakdown of the current Bitcoin setup.
Market Analysis
BTCUSD has recently completed a strong downward phase inside a well-defined Downward Channel, where price continuously formed lower highs and lower lows. After reaching the Support Zone around $94,500–$95,200, buyers stepped in and created a fake breakout, followed by a quick recovery — a sign of weakening seller pressure. Following this rebound, Bitcoin formed an Inverse Head and Shoulders pattern, confirming a potential bullish reversal. Price has now broken above the Triangle Resistance Line, signaling the first structural shift from bearish to bullish.
Currently, BTCUSD is consolidating just above the $95,500–$96,000 support zone, which now acts as a retest area for the breakout. As long as BTC stays above the Triangle Support Line, bullish momentum remains intact, and the market structure favors further upward movement. The nearest target for buyers is the $99,000 Resistance Zone, which previously acted as a strong supply area. A successful breakout above $99,000 would confirm bullish continuation and open the way toward higher resistance levels. If price fails to hold above support, a short-term pullback toward the lower triangle boundary may occur before buyers try to regain control.
My Scenario & Strategy
I expect BTCUSD to maintain its bullish bias as long as price trades above the Triangle Support Line and the key support zone. Potential long entries remain valid on retests of the $95,500–$96,000 area, with a primary target at the $99,000 Resistance Zone (TP1).
A confirmed breakout above $99,000 would strengthen bullish momentum and open the next leg upward. However, a breakdown below the triangle structure may lead to a deeper correction toward $94,500. For now, sentiment remains bullish, and Bitcoin appears ready for a continued recovery within the new reversal structure.
That's the setup I'm tracking. Thank you for your attention, and always manage your risk.

Bitcoin Can reach 93000 Bitcoin could reach the price level of $93,000 in the coming weeks.
There is a possibility that after breaking the midline of its long-term weekly channel, it may move up to the indicated FVG level to fill the remaining unfilled orders.
After that, it could start a new bullish rally aiming for the upper boundary of the channel.
This is purely an analysis and should not be considered as financial advice.
Buying or selling is at the trader’s own risk.

BITCOIN Free Signal! Buy!
Hello,Traders!
BITCOIN taps into a major higher-timeframe demand area, reclaiming structure and sweeping downside liquidity. A bullish reaction here may drive price toward the next internal range high.
--------------------
Stop Loss: 88,783$
Take Profit: 94,407$
Entry Level: 91,500$
Time Frame: 1D
--------------------
Buy!
Comment and subscribe to help us grow!
Check out other forecasts below too!
Disclosure: I am part of Trade Nation's Influencer program and receive a monthly fee for using their TradingView charts in my analysis.

BTCUSD Rebounds From Buyer Zone — Correction Toward $101KHello traders! Let’s take a look at BTCUSD (Bitcoin). After an extended bearish phase inside a broad descending channel, price consistently respected both the resistance and support lines, forming a clear series of lower highs. Each touch of the descending resistance line resulted in a Turned Around reaction, confirming strong seller control throughout the structure. Earlier, Bitcoin broke below its local support area, initiating a deeper correction toward the major Support Level near $96,000. This zone aligns with the lower boundary of the descending channel and historically served as a strong reaction area for buyers. Recently, BTCUSD reached the bottom of the structure and is now showing early signs of a potential pullback. Price is attempting to rebound from the Buyer Zone, aiming toward the nearest resistance cluster around $100,800–$101,600, which also forms the lower boundary of the Seller Zone. This level previously acted as support and is now expected to serve as a strong retest area. As long as price remains below the descending resistance line, the overall trend stays bearish. A short-term bullish correction toward TP1: $101,600 remains possible, especially if buyers maintain control above the $96,000 support. However, if BTC fails to break above the Seller Zone, sellers may step in again, potentially pushing the price back toward the major support and even extending the downtrend. A confirmed breakout above the descending resistance would invalidate the bearish scenario and open the door for a stronger recovery. Please share this idea with your friends and click Boost 🚀

Bitcoin: 100K Resistance Watch 88K Overlap.Bitcoin rejected the 105K area NEW resistance/old support. I wrote about this possibility a week ago and highlighted it during my stream. With the new low in progress, this area 95K and 90K are the next support areas to watch for swing trade reversals. Note the 90K to 88K area is a major support and IF cleared, will confirm a significant change to my wave count.
It is IMPORTANT to consider this game as a collection of "IFs". If you were lured by all of the hype and high risk prices above 100K (I talked about this all summer), NOW you get to sit through the associated pain. THESE are prices to be interested in, especially for accumulating for investment. An OPEN mind is required to navigate this arena of incomplete information. Bitcoin can TEST as low as 73K (the pre election all time high) or even lower. How you manage risk through sizing and moderation of leverage (if used at all), is how you will more likely arrive at an optimal outcome.
My chart shows key levels on this specific time frame, the arrow points to a reaction point (100K new resistance), and the illustration of lines highlights a potential scenario that I believe has a higher probability of developing over the coming week or weeks. As of now, the 95K support is broken but not by much, it can reverse quickly. Since there are a number of major supports in this area, the key is to confirm a reversal pattern. It may be in the form of a failed low or double bottom like formation nearer the 90K level. It is within reason to measure profit potential from the 100K area now that it is a new resistance. This is the shorter time horizon perspective ideal for swing trades only.
In terms of the broader view, 88K is major because it is where I have my Wave 1 of this broader wave defined. IF price overlaps this (meaning it goes to 85K with no swift rejection) then it confirms that the current structure is the broader corrective wave (Wave 2). This Wave 2 can potentially see prices in the 50Ks or theoretically lower. I believe extreme low prices are a low probability, but you must be prepared either way. I don't make specific forecasts because I know price is purely driven by sentiment, and sentiment can be extremely irrational.
Lesson: LEARN to assess risk and reasonable possibilities through TECHNICAL analysis along with some fundamental perspective. If you are stuck from much higher prices, you can only blame yourself for consuming too much Michael Saylor content. While the short term price structure is bearish, the bigger picture hasn't changed yet. THIS is what an investment opportunity looks like, NOT pushing all time highs day after day. As an investor you assume the most risk, so how much you risk should always be the focus, not how much you can make. And also consider the question: what has changed fundamentally? Sentiment drives price and when it gets to an extreme, opportunities arise especially when aligned with the fundamental view.
Thank you for considering my analysis and perspective.

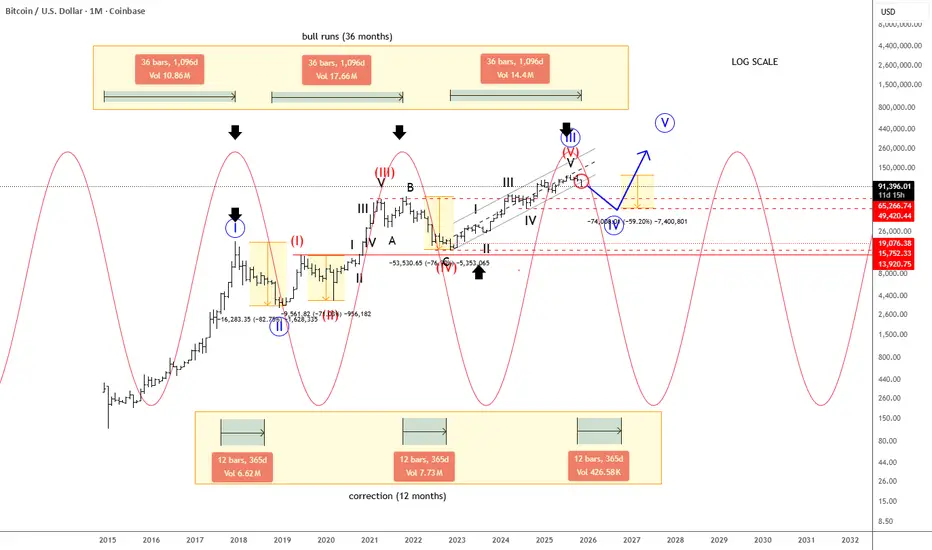
BItcoin super cycle This is what I believe is a scenario we might see.. in which bitcoin goes back to 60k ish and then to 150k then back to 75k then back to 150k before it goes moon shot 1 million dollars in 2031-32 the gains will be minimal for now bull markets will be weak. But wait it out till 2031-32 and youll be likely rewarded.

Bitcoin FOMOThe technical levels I am watching in the near term are:
Upside Resistance:
104800
117,500
All Time High
Downside Support
87,700
84,100
Throughout this bull cycle, starting from the low in November 2022, following the January 2023 Ichimoku breakout that truly triggered the bull trend, and after the ETF launch my Bitcoin friends continue to ask if I am buying Bitcoin. My answer now, as it has been all year, is "no." They invariably come back with incredulousness, "but you're going to miss out!" And of course my favorite, "everyone gets Bitcoin at the price they deserve." I suppose that phrase should make me most deserving having bought my first at $20.
The thing I "know" about Bitcoin, based on its history, is that it always pulls back... bigly. That has been "less bigly" each cycle but the double edged sword of volatility is baked in still, only forgotten at the moment. To update that phrase about deserving price I have my own, "you will always be able to buy Bitcoin again at this price." It's the proper counter-FOMO mindset and borne out by history. If Bitcoin were to suddenly rocket to $200,000 and then retrace by 50% it would put it right back here at $96,000.
But I am told "I just dont understand Bitcoin." No, I do, very well I think. I understand Bitcoin itself intimately but more importantly markets broadly.
I understand markets and what makes them work; human emotion and cyclicality. Bitcoin Maximalists believe that Bitcoin is something different; that the rules do not apply. "There is nothing new under the sun." This is especially true of financial markets and Bitcoin is definitely one of those. By expanding my horizon across all the assets and tickers available to traders over the last 16 years I have seen countless tickers go on to make massive gains, capture the attention and frenzy of investors, and then... invariably... come back. Bitcoin is still priced by humans and this is what humans do. I've endured so many missed opportunities. Many that I felt strong pain about. But after so many exposures to negativity one develops a resilience. That's what those who focus exclusively on one thing fail to appreciate and put themselves at risk out of ignorance.
There are events and busted narratives that have happened this year that explain the stall in what many presumed was the guaranteed road to $1M. I find that these changes have gone largely ignored or at least not spoken of again. The taxpayer funded bailout, excuse me, the Strategic Bitcoin Reserve, is not happening. Microstrategy's shareholders finally forced Saylor to stop diluting shares back in August to buy Bitcoin. And an internal political war over the soul and future of Bitcoin's code has broken out. These are not death knells for Bitcoin themselves but they detract from the optimism. And optimism is the emotion that drives price higher.
What is my long term view? It remains the same now as it has all year; "they" must be tested. Every asset that creates a culture of passionate optimism around it invariably reverts at some point to abject despondency. That is the cycle of greed and fear. Though I read the consternations on social media there still remains hope. When all hope has been given up... then one should become interested. It doesn't matter if that comes following an all time high of $126k or $1000k. That point will come. I'll be fine either way.

Bitcoin One Last DanceBefore the top is in will we have the final leg or not?
Each wave 4 is getting sharper down trend
And each wave 5 is getting weaker up trend
Is there another final leg pushed up to 130K or is the party already over?

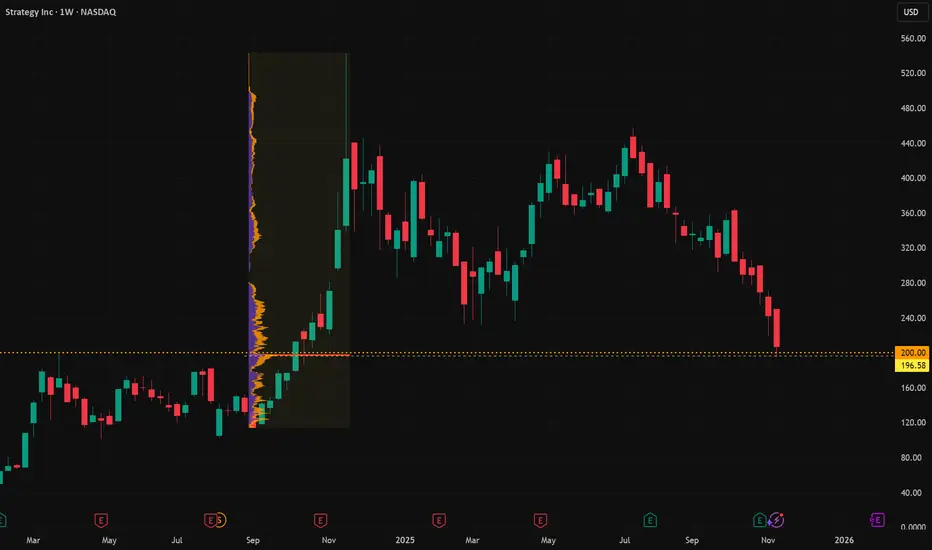
MSTR Short Closed: Michael Burry vibesI started my NASDAQ:MSTR short last November during the retail yeet. I really took a dislike to Saylor telling people to mortgage all they could to buy Bitcoin and then later to buy stock in his company. The history of finance is littered with con men saying and doing such things. History doesn't repeat but it rhymes.
Now the stock sits on a key Support; the March 2024 high and the prime Volume Profile level of the run up. Its time to unwind the position in profit and see what happens next.
MSTR hitting a Support coincides with CRYPTO:BTCUSD also hitting a major Volume Profile Support. The Weekly Ichimoku chart remains bullish. A recovery pullback up could happen from here.
Over the last year I've had to go through the cycle of being "right" and being "wrong" all the while being public in my position among Bitcoin Maxi friends. They enjoyed poking fun at me the whole way. Their arrogance and jabs did not change my mind, rather they gave me some confidence that I was properly contrarian. Hubris never pays off in investing. Every great trade I have made has begun (and lasted) in deep uncertainty. That is what it means to take risk.
I still believe that the narrative of MSTR has yet to completely dissolve among the faithful but I have a habit of always taking profit "too early."
Trade wisely. Stay convicted.
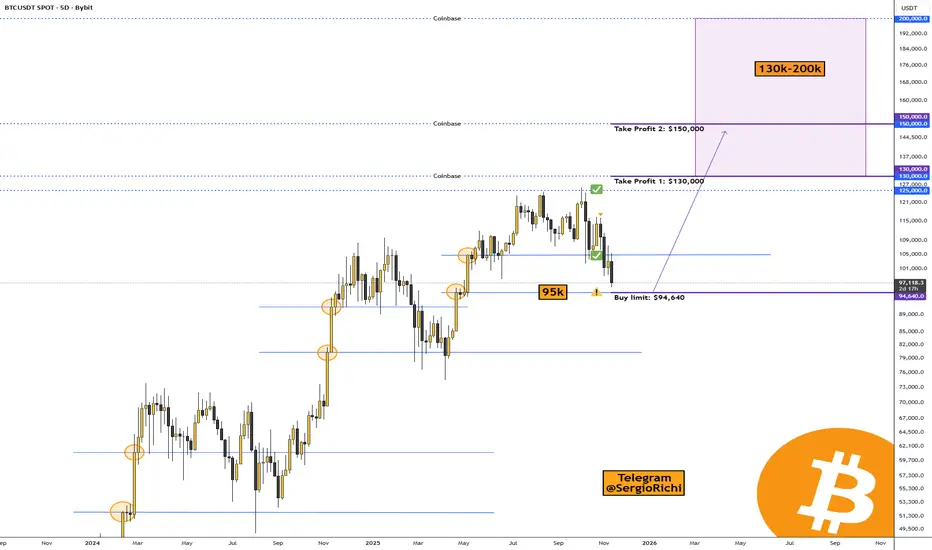
Bitcoin is approaching a key level at $94,640CRYPTOCAP:BTC #Bitcoin — Bitcoin is approaching a key level at $94,640.
The correction in the crypto market continues, and it's now starting in the US stock market.
Bitcoin is nearing an important level on the 5-day timeframe—specifically $94,640.
That's where market makers and big players have placed limit buy orders, and I think we'll see some major trader liquidations there too. For those who trade Bitcoin exclusively, I've marked a buy level.
• Buy limit: $94,640.
• Take Profit 1: $130,000
• Take Profit 2: $150,000
The range for wrapping up Bitcoin's cycle is pretty wide, since there are large orders set up there for taking profits. It's tough to pinpoint exactly where the price peak will be—we can only go by the data we can see.
• Coinbase: $130,000, $150,000, and possibly $200,000.
• Binance: $130,000, $150,000, and likewise, it's unlikely but possible to climb to $200,000.
Based on Elliott waves, we're finishing the 5th upward wave, and I figure the peak will hit in 2026, followed by a straight drop.
Indicator for Bitcoin miners:
The cycle indicator on Bitcoin shows the peak hasn't been reached yet:
Samuel Benner's Cycle and the 2026 Peak
The "200-year farmer chart," often referred to as Samuel Benner's Cycle Chart, is a historical economic forecasting tool created in 1875 by Ohio farmer and self-taught economist Samuel Benner.
It's credited with a "90% success rate" in broad sentiment prediction, and modern applications extend to stocks, crypto, and even solar cycles correlating with recessions.
It's best used as a sentiment gauge, not a precise timer.
Implications for 2026
The chart marks 2026 as a "B" year—a cycle peak in "Good Times," signaling high prices and a time to sell before transitioning to panic and hard times from 2026-2032.
This suggests a potential bull run peak, followed by downturn risks amid global debt, inflation, and geopolitics. As of late 2025, we're in a growth phase approaching this apex, per the model's extensions.
Dear friends, it looks like 2026 will mark the end of the growth cycle for Bitcoin and altcoins, so we'll need to find exit points, bail out of the crypto market, stock up on supplies for 3-5 years, and get busy building bunkers 😀🔥.
BTCUSD Long: Rebound From Demand Line Targets $104K ResistanceHello traders! Bitcoin (BTCUSD) continues to trade within a well-defined structure, showing a gradual transition from a bearish phase toward potential accumulation. After an extended decline inside the Descending Channel, the market found strong support around the $100,600–$101,000 Demand Zone, where a fake breakout occurred — signaling liquidity grabs and renewed buyer interest. This zone has acted as a major reaction area multiple times, marking it as a key demand region. Following the rebound from this level, BTCUSD formed a Pivot Point near $101,200, initiating a mild bullish recovery along the Demand Line, which now serves as dynamic support. However, price remains capped below the $104,000 Supply Zone, an area that aligns with both the upper boundary of the current Range and the previous Fibonacci Arc retracement, where sellers previously re-entered the market.
Currently, Bitcoin is consolidating between $101,200 support and $104,000 resistance, reflecting indecision before a potential breakout. If buyers manage to defend the Demand Line and reclaim $103,000, a move toward $104,000 and possibly higher could follow, completing the short-term recovery phase. Conversely, a confirmed breakdown below $101,000 would invalidate the bullish scenario, likely driving price back toward the $100,000–$99,600 zone for another liquidity test.
I expect the current structure suggests Bitcoin is in a neutral-to-bullish phase, with attention focused on how price reacts around the Demand Line and Range boundaries. A strong rebound from current levels could trigger the next leg toward $104,000 resistance. Manage your risk!

BTCUSD: Bulls Defend $102K Zone — Eyeing Breakout Toward $107KHello everyone, here is my breakdown of the current Bitcoin setup.
Market Analysis
BTCUSD is trading within a well-defined triangle formation after a period of volatile movements between $102,500 and $107,000. The chart shows that price recently rebounded from the Triangle Support Line, aligning with the $102,000–$103,000 Support Zone, where buyers have consistently stepped in to defend this level. This zone has acted as a strong accumulation area, confirmed by multiple bounces and rejection wicks signaling absorption of selling pressure.
Currently, after a fake breakout to the downside, BTCUSD quickly recovered, retesting the Resistance Zone near $105,000–$105,500, which also aligns with the Triangle Resistance Line. This confluence area represents the next key reaction point. A confirmed breakout above this resistance would indicate a potential continuation of the broader bullish trend, while a rejection here could lead to a short-term correction back toward the support base. The market behavior shows constructive consolidation, with higher lows forming along the support trend line — a sign that buyers are gradually regaining control. As long as BTCUSD remains above $102,000, the short-term structure favors further upside movement within the triangle, aiming toward the $106,500–$107,000 resistance area.
My Scenario & Strategy
As long as Bitcoin holds above the $102,000–$103,000 Support Zone, the bullish outlook remains valid. The first upside objective (TP1) is the $106,500–$107,000 Resistance Area, where traders should watch for potential rejection or breakout signals. A confirmed breakout and close above $107,000 could trigger an extension toward $109,000–$110,000, aligning with the upper boundary of the triangle and the previous reaction zone.
However, if BTCUSD fails to hold above $102,000, this would invalidate the bullish scenario and open the way for a deeper pullback toward $100,000–$99,000, where fresh buying interest may emerge. For now, the structure supports buying pullbacks while price remains above the ascending Triangle Support Line, as momentum continues to favor the bulls.
That's the setup I'm tracking. Thank you for your attention, and always manage your risk.

BITCOIN on a 6-month Low! Bear Cycle starting based on GOLDBTC?Bitcoin (BTCUSD) hit $96000 today for the first time in 6 months (since May 07). For a long time we presented evidence (spearheaded by the 4-year Cycle) of why October was a strong candidate for a market top and so far this continuous correction validates all the data.
Today we circle back to an old favorite of ours, the GOLDBTC ratio. During the previous Bull Cycle, a Double Bottom on that ratio was what confirmed the start of BTC's 2022 Bear Cycle. On the current Cycle, we had this Double Bottom in August and since then, the GOLDBTC ratio has been rising.
Even on previous Cycles, a rise on this ratio always coincided with a BTC Bear Cycle. Based on that evidence too, the next Bitcoin Bear Cycle should be over before 2026 ends.
As a side-note for investors, keep in mind that a rise on the GOLDBTC ratio doesn't necessarily mean that Gold will rise while only Bitcoin falls. Both can fall at the same time, the ratio highlights pace, it just indicates that Gold can also decline in value but less aggressively than Bitcoin.
So are we in a Bitcoin Bear Cycle? Feel free to let us know in the comments section below!
---
** Please LIKE 👍, FOLLOW ✅, SHARE 🙌 and COMMENT ✍ if you enjoy this idea! Also share your ideas and charts in the comments section below! This is best way to keep it relevant, support us, keep the content here free and allow the idea to reach as many people as possible. **
---
💸💸💸💸💸💸
👇 👇 👇 👇 👇 👇

Strategy: Downward Pressure Intensifies Strategy has continued to develop downward pressure as anticipated since our last update, bringing it closer to the targeted low of the turquoise wave 2. Our alternative—and now grayed-out—Target Zone has been breached to the downside, allowing us to remove the alternative scenario of a premature breakout to the upside. Investors who speculated on this alternative and entered within the alternative Target Zone with a stop 1% below the lower edge have likely been stopped out by now. For now, we are still allowing some room for turquoise wave 2 to move lower; however, it should find its bottom above the support at $102.40 to set the stage for wave 3 to advance further above the resistance at $674.18.

BITCOIN – LEVELS TO WATCHTraders,
We dumped. Now we are in a controlled recovery. The question is not only “are we going up” but “where will the market make its real decision.” Right now the chart is giving us two very clean checkpoints.
1. What happened
We lost the weekly open and sold off.
Spot was selling too, so the dump was real.
After the low, spot started buying again and price reclaimed above the big wick. That looks like a failed attempt lower.
Markets left a really weak low behind at ~99k. I am convinced we will sweep this low somewhere in the coming weeks.
Funding is negative while price is moving up. Shorts are still in the market. This is how squeezes start.
2. First decision zone: 107.300 to 108.000
This area is important because several things come together.
107.300 is a weak high. It stopped at a clean level without strong rejection. That often means liquidity is still sitting above it.
The AVWAP anchored from 7 April is there. Price is below it for the first time since that move. When price comes back into an AVWAP from below the market often reacts because old buyers meet new sellers.
We also have an LVN just below. That tells us the market did not trade much there before. Price likes to test that kind of gap.
So 107k to 108k is our first place to watch the data. If spot keeps pushing and perps do not start selling we can break it. If CVD stalls there it can be a take profit zone.
3. Accumulation and Distribution
On both the 1 hour and 4 hour spot charts the Accumulation/Distribution line tells an important story.
Price made a clear new low after the dump.
The A/D line did not make a new low. It actually started to turn up.
That is what traders call a bullish divergence. Price is still falling but the money flow is already improving.
In simple words. While candles were going down someone was quietly buying.
That means the bounce we see now is not just short covering or a random spike. It was prepared by real spot demand.
Futures can show a similar thing but spot is the cleaner signal because it is not influenced by funding, leverage or hedges.
When real buyers step in while shorts are still in the market it often creates the right conditions for a squeeze.
4. OBV check
On the 4h OBV you can see it popping up from the base after the dump. OBV going up while price is moving up means volume is supporting the move. This agrees with the spot A/D story. It is better when price and OBV move together than when price moves alone.
5. Scenario 1
Price pushes into 107k to 108k.
That sweep takes the weak high and tags the AVWAP.
If at that point spot CVD slows down or perps start to sell we can reject.
A rejection there can send price back into the mid zone and even lower towards 101k to 102k and in extension back to the HTF LVN near 98k.
This is the simple “first resistance holds” idea.
6. Scenario 2
This is the one I am leaning toward.
Price breaks and holds above 108k.
Shorts do not get their reaction.
Spot keeps supporting and funding stays negative to flat.
Then the market has room to go for the next real liquidity pool which is 117k to 118k.
7. Why 117k to 118k matters
On the liquidity heatmap there is clear resting liquidity higher up. Price often travels to those areas because that is where orders are.
The golden pocket of the previous move sits in this same zone. Many traders watch this fib area so reactions there are common.
Several AVWAP bands from earlier dates are meeting around 117k to 118k. When AVWAPs from different anchors cluster together it creates a stronger level because different groups of traders all care about that price.
Between the current price and that zone there are imbalances and LVNs. That means the market moved quickly there before and did not build volume. These thin areas often get filled on the next push.
8. How to read it in real time
Above 108k and spot CVD still rising means squeeze is on.
Above 108k and funding still negative means shorts are paying to stay wrong.
Lose 108k again after a sweep and see CVD roll over means scenario 1 is playing.
Price can just dump down without getting more liquidity. But looking unlikely based on the data right now.
So if Bitcoin can break and hold above 108k there is not much in the way until 117k to 118k.
Final view
We dumped on real flow.
We are recovering with spot support.
We have a clear first test at 107k to 108k.
Break and hold and the magnet becomes 117k to 118k because of liquidity, golden pocket, AVWAP confluence and imbalance.
TLDR;
Bitcoin sold off hard, but the data says the low was bought. Spot A/D started rising while price was still making new lows, funding turned negative and price reclaimed above the wick, which tells us real buyers stepped in while shorts stayed in their positions. Now price is climbing back toward 107k to 108k where a weak high and the April AVWAP are waiting, so that is the first place the market can decide if this recovery is just a bounce or the start of a squeeze. If buyers keep showing up there and we push through, the path above is thin and the next real pocket of liquidity, AVWAP confluence, imbalance and even the golden pocket of the earlier move all sit together around 117k to 118k. That is why this recovery matters. It is not just candles going up. It is positioning, spot flow and liquidity all lining up.
If you enjoy this type of analysis or find it helpful, leave a like or drop a comment. I don’t ask for anything in return — I share this to help traders understand what’s really happening behind the charts. It also helps me see if people actually read and value these breakdowns, so if it helped you, let me know below.

BTC Daily Scene — Still Not GreenAs you know from my previous publication, I’m still expecting Bitcoin to reach 100,000 and below.
The invalidation zone of my previous bearish scenario was 105,465 .
At the moment, Bitcoin tried to approach that zone but failed to even touch it , which only confirms its intention to keep heading down toward my target area — 100,000 and lower .
My global downside target is 83,000 , but for now, I only expect 100,000, since I don’t believe Bitcoin will drop straight to 83K in one go.
⸻
⚠️ Disclaimer:
This is not a trading signal, just my personal analysis.
Always trade according to your own system and use stop losses.
⸻
💬 Follow me so you don’t miss my daily Bitcoin analysis — the story continues!

In 2026 Bitcoin should trade to the $60k-$80k RegionOn October 23rd, I published an update on Bitcoin titled “Is Bitcoin About to Shed Its 6-Figure Price Tag?” … and that post certainly struck a nerve.
A number of Bitcoin defenders were quick to tell me I was wrong. As it turned out, those same voices had to face the public reality that their conviction was misplaced, and my analysis proved correct in the short term.
To be clear, I remain agnostic when it comes to Bitcoin’s investment merits. My focus is purely on the wave structure, counting 5’s and 3’s nothing more. I cover most tier-1 cryptocurrencies, and while I remain bullish on Bitcoin over the long term, I continue to expect further downside in the intermediate term once a minor B-wave retracement higher completes.
Ultimately, my analysis continues to suggest a bottoming region between $60,000 and $80,000 sometime in 2026, from which Bitcoin can begin a primary-degree rally. Until that region is reached, Bitcoin may be best viewed as a vehicle for shorter-term trades of minor degree, rather than a sustained long-term hold.

BTCUSD Bulls Aim Higher: Buyers Eye Breakout Toward $107,500Hello traders! Let’s take a look at the current BTCUSD structure. After an extended corrective phase within a descending movement, the market found solid support near the $100,000–$100,200 Buyer Zone, which aligns with both the horizontal Support Level and the lower boundary of the broader structure. This zone has repeatedly triggered strong buying reactions in the past, confirming it as a key demand area. Recently, Bitcoin began forming a bullish correction channel, where price has been developing higher highs and higher lows, suggesting early signs of trend recovery. Within this structure, buyers successfully defended the Buyer Zone, followed by a steady rise toward the $107,000–$107,500 Resistance Level — a zone that previously acted as a Seller Zone during prior rejections. At the moment, BTCUSD is consolidating inside this ascending channel, trading slightly below resistance. The market may attempt another push toward TP1 at $107,500, which aligns with the upper resistance line and marks a potential short-term target. If price manages a confirmed breakout above this level, we could see further continuation toward the next resistance around $111,000. However, if the price faces rejection at the current resistance, a temporary pullback toward the Support Line or Buyer Zone ($100,200–$101,000) could occur before the next wave of growth. The structure remains bullish as long as Bitcoin stays above the ascending Support Line. Please share this idea with your friends and click Boost 🚀
