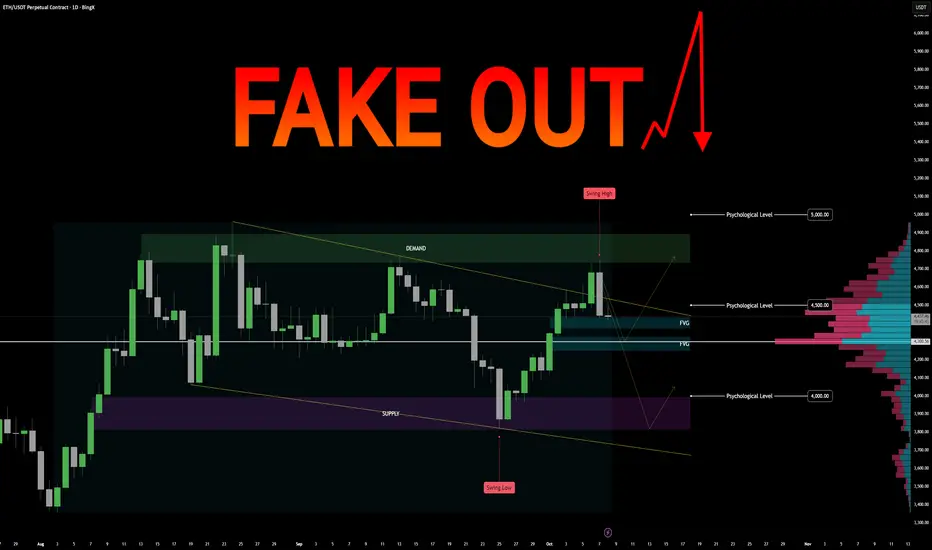
$ETH Market Assessment Incoming FAKEOUT? ETH/USD Perpetual – Market Assessment
Key Zones
Demand: 4737 – 4895
Supply: 3818 – 3994
Fair Value Gaps (FVGs): 4433, 4326
Anchored Volume Node: 4300 (significant liquidity cluster)
Psychological Levels : 4000, 4500, 5000
Recent Swing Points: High 4753, Low 3821
Technical Structure
High-Time Frame (HTF) Analysis:
Pattern: Bullish flag
Interpretation: Indicates potential continuation to the upside if price breaks above the flag resistance.
Daily-Time Frame (DTF) Analysis:
Pattern: Bearish channel
Interpretation: Suggests a slightly bearish pressure on the daily trend; caution required for long positions.
Volume and Liquidity:
Anchored volume node at 4300 aligns closely with FVGs at 4326 and 4433 – this area may act as strong support on pullbacks.
Scenario Planning
Bullish Scenario:
Price holds above demand zone (4737–4895).
Break above recent swing high at 4753 confirms bullish momentum.
Potential targets: 4895, 5000 psychological resistance.
Pullbacks likely to find support at FVGs (4433, 4326) or volume node (4300).
Bearish Scenario:
Price fails to hold demand zone and breaks below recent swing low 3821.
Next support: supply zone 3818–3994, then psychological level at 4000.
FVGs and volume node may temporarily slow the downside movement.
Summary / Notes
HTF indicates bullish continuation potential; daily trend shows bearish pressure.
Demand and supply zones, FVGs, and volume nodes are key levels for trade planning.
Monitor price reactions at swing points, psychological levels, and liquidity clusters to confirm trade setups.
Trade management should consider both bullish and bearish contingencies, with SLs placed near key FVGs or volume nodes.
Bitcoin (Cryptocurrency)
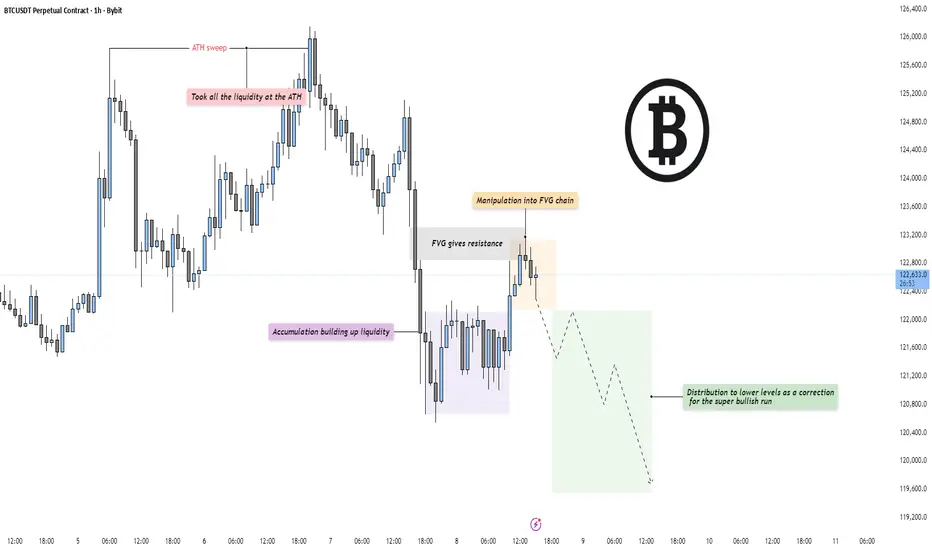
BTC - Distribution after ATH sweepMarket Context
Bitcoin has completed a clear liquidity sweep at the all-time high (ATH) and is now transitioning into a corrective phase. After taking all the liquidity above the prior high, price aggressively rejected and shifted structure to the downside, signaling that smart money may now be engineering a retracement. The move lower has found a temporary pause within a lower accumulation zone where liquidity is rebuilding.
Fair Value Gaps & Manipulation
Following the ATH sweep, price manipulated back into a fair value gap (FVG) chain, where it met resistance. This area acted as a precise reaction point, rejecting further bullish attempts and confirming the FVG as an active supply zone. Each touch into this chain has resulted in lower highs, supporting the idea that distribution is underway. The fair value gaps below are likely to be targeted next as price seeks efficiency.
Liquidity Dynamics
Liquidity above has already been collected — the current draw now lies beneath. The accumulation zone below current price holds resting sell-side liquidity, and the market could aim to fill those inefficiencies before finding new demand. A retracement into these lower levels would act as a healthy correction to the prior bullish impulse, maintaining structural balance.
Final Thoughts
The market has shifted from an aggressive expansion phase to a potential distribution stage. With liquidity taken at the highs and FVGs now providing resistance, the bias leans toward a corrective move lower before any renewed bullish continuation. A break below the local accumulation floor would confirm deeper targets.
If this breakdown helped clarify the current BTC structure, a like is always appreciated — and let me know: are you positioning for the correction, or waiting for the next bullish leg to form?
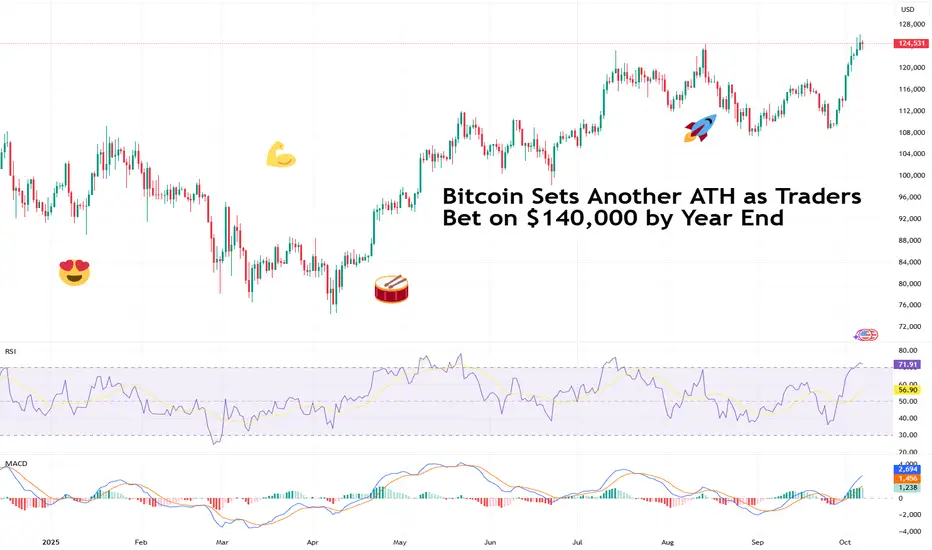
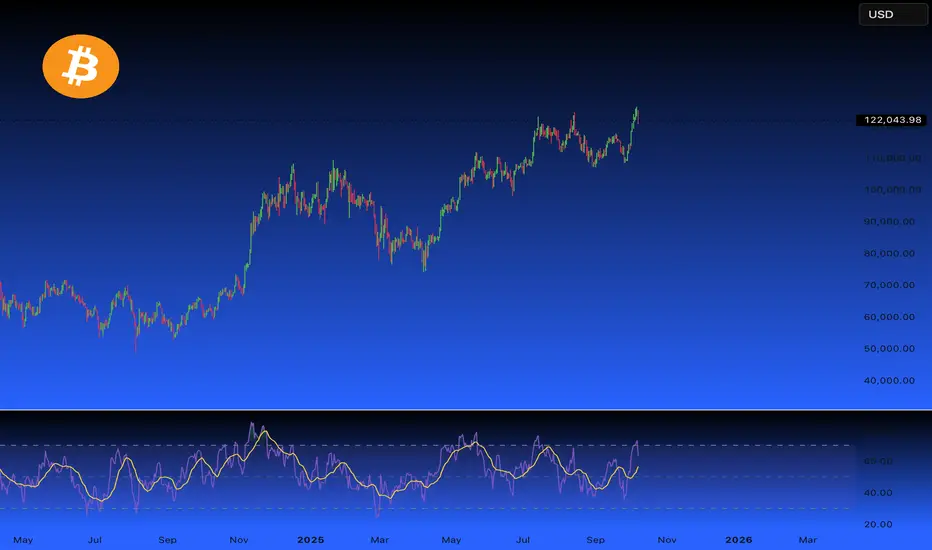
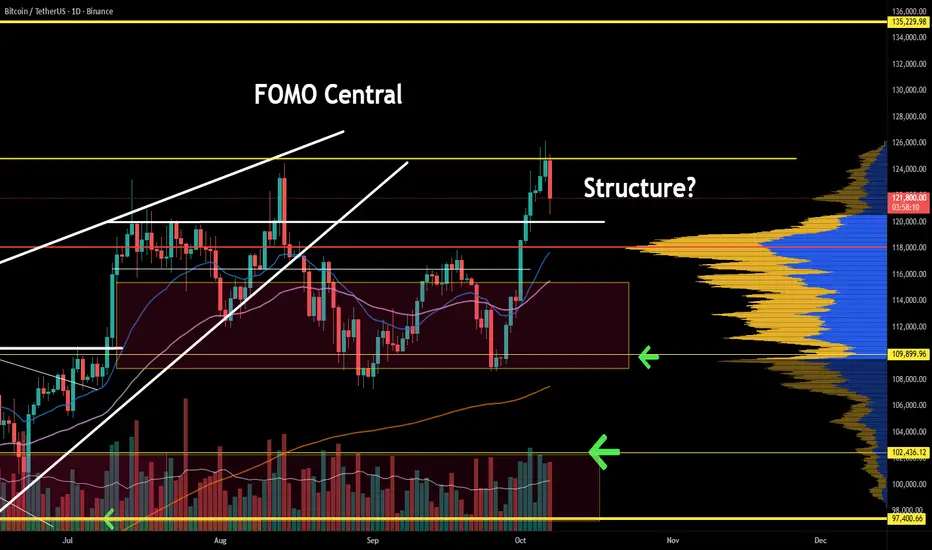
Bitcoin Sets Another ATH as Traders Bet on $140,000 by Year EndBlink and you’ll miss it. Bitcoin’s recent leg up caught lots of traders unprepared. After sinking below $110,000 few weeks back, the OG coin slingshotted to a fresh record high above $126,000 this week. Not a bad way to start October Uptober .
Now, traders are adding to bets that the price will crack $140,000 by year end. How realistic is that?
🌕 “Uptober” Strikes Again
October has a reputation in crypto lore and it’s living up to it.
Over the last 13 Octobers, Bitcoin BITSTAMP:BTCUSD has ended in the green 10 times. The pattern is set to continue as the coin rides a broader wave of optimism fueled by the Fed’s rate cuts, a messy US government shutdown, and the return of that dangerous four-letter abbreviation: FOMO.
But the real kicker? Spot Bitcoin ETFs are on fire.
US-listed Bitcoin ETFs kicked off the month with their second-best week ever, attracting $3.24 billion in net inflows — nearly matching their record of $3.38 billion set in November 2024. Are we… so back ?
💥 Options Traders Go Big: $140K or Bust
In the options market, optimism is loud and clear. Data from Deribit shows open interest piling up around the $140,000 strike for contracts expiring in December — meaning plenty of traders are betting we’ll see new highs just in time for the holiday season. (Not that easy to gift a BTC now, is it?)
At the same time, a few cautious traders are hedging with puts, just in case this turns into another one of those “too-fast, too-furious” rallies.
📈 You Get a Record and You Get a Record
It’s not just Bitcoin exploring new horizons. The S&P 500 SP:SPX and the Nasdaq Composite NASDAQ:IXIC both logged their 30-something record closes of 2025, powered by relentless AI strength ( some huge OpenAI deal ) and investors betting that rate cuts will stretch the bull run.
But also, gold bugs are turning into the Scrooge McDucks of the market, backstroking through piles of gold in impenetrable fortresses.
The shiny stuff OANDA:XAUUSD is up 55% year to date and hovering just under $4,000 per ounce, a milestone that would make even die-hard crypto bulls nod in respect.
Apparently, the market’s hot across the board.
🧠 Why Bitcoin’s Rally Makes Sense (Kind Of)
Underneath the euphoria, there’s some logic to this madness:
• Lower rates = cheaper money. When the Fed cuts, non-yielding assets like Bitcoin suddenly look more attractive.
• Inflation’s still sticky. Investors want something that can’t be printed at will. The US government shutdown only strengthened that flow of cash.
• Institutional influx is real. ETFs, family offices, and even corporate treasuries are allocating to Bitcoin BITSTAMP:BTCUSD , Ethereum BITSTAMP:ETHUSD , and Solana PURPLETRADING:SOLUSD.
At its current market cap of $2.5 trillion, Bitcoin is now bigger than Amazon NASDAQ:AMZN ($2.4 trillion), the world’s fifth-largest company .
🧭 The “Uptober” Mindset
Here’s where psychology comes in. After weeks of choppy sideways trading, boredom gave way to disbelief — then disbelief turned to excitement. Now? We’re entering the danger zone where conviction and euphoria start to blur.
Some veterans call this the “emotional compression” phase — when every dip feels like an entry and every green candle feels eternal. But cycles never die; they just rotate. Those who chase late often learn that momentum cuts both ways.
Still, momentum traders have history on their side. Every October since 2012 (barring 2018, 2014, and 2012), Bitcoin has delivered solid gains. It’s hard to argue with a pattern that reliable — until it breaks.
🤔 What Could Trip Up the Bulls
Even the most euphoric chart has risk baked in:
• Profit-taking. After a 100% gain over the past twelve months, short-term traders can decide to lock in profits fast.
• Macro shocks. One bad inflation print ECONOMICS:USCPI or a hawkish Fed comment could cool the mood.
• Overheated sentiment. When everyone in your barbershop agrees it’s going up, it usually doesn’t — at least not immediately.
The chart’s near-term support sits between $120,000–$122,000. Lose that, and a retest of $110,000 is possible. Hold it, and $140,000 becomes more than just a meme.
📢 $140K by Year-End: Dream or Data?
Statistically speaking, Bitcoin would need roughly a 4% monthly gain from here to hit $140,000 by December. Considering it’s already up over 100% year-to-date, that’s not outrageous.
To get there, the stars must stay aligned:
• ETF inflows keep building momentum.
• The Fed sticks to its dovish script.
• Stocks stay buoyant, giving traders room to take risk.
• No black swans, no rug pulls, no sudden panic tweets.
If all that holds, a single Bitcoin closing the year north of $140,000 isn’t fantasy. It’s just crypto doing what crypto does — defying logic, gravity, and your risk management plan.
👉 Off to you : Where do you see Bitcoin by end of year? Cast your predictions in the comment section!
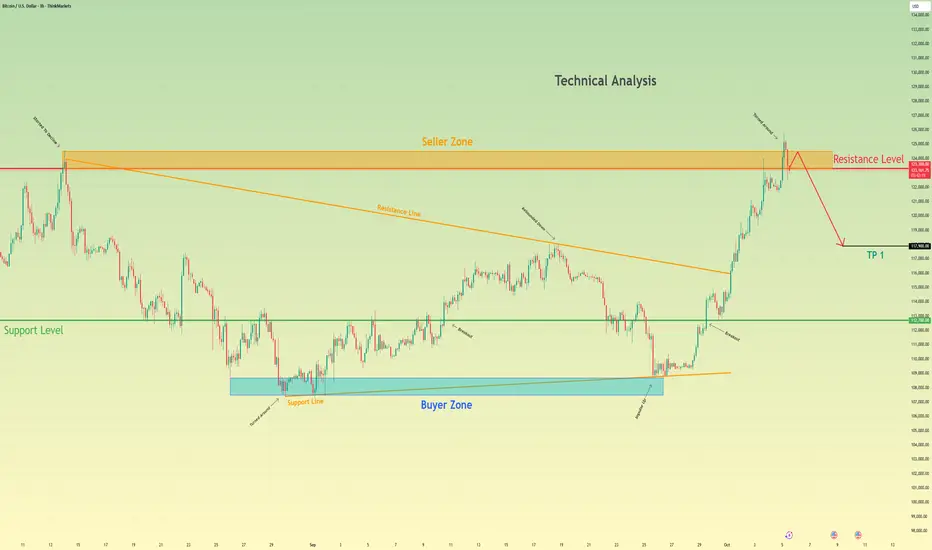
Bitcoin (BTC/USD) – Short SetupHi guys!
let's dive into btc:
BTC has recently broken down from its ascending channel, signaling a potential shift in short-term momentum. After the breakout, the price could go toward the previous structure zone around $122,000–$123,500, which now acts as a potential supply area.
There are two potential entry zones for short positions:
First Entry: Around $122,000, where price may face initial rejection from minor resistance.
Second Entry: Toward $123,500, aligning with the upper boundary of the recent supply zone for a better risk–reward ratio.
Both setups target the $118,400–$118,000 demand zone, which overlaps with the previous consolidation base and channel support.
As long as BTC trades below $125,500, bearish momentum is likely to remain dominant in the short term. However, a confirmed close above this level could invalidate the short setup and signal a possible re-entry into the ascending structure.
Disclaimer: As part of ThinkMarkets’ Influencer Program, I am sponsored to share and publish their charts in my analysis.

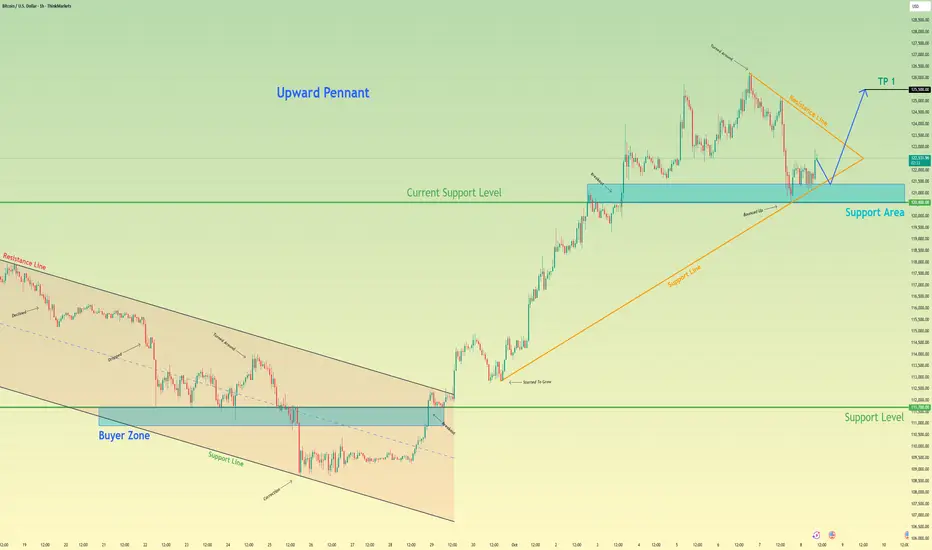
Bitcoin will Bounce From Pennant Support and Rally HigherHello traders, I want share with you my opinion about Bitcoin. The market structure for Bitcoin has recently undergone a major transition from bearish to bullish, following a decisive reversal from the 111700 support level. This shift triggered a breakout from the previous descending channel and gave rise to a new upward pennant pattern, a clear signal of strengthening bullish sentiment. After setting a new all-time high around 126000, BTC has entered a short-term corrective phase, retracing toward the 120600 area, which coincides with both the pennant’s ascending support line and a key horizontal support zone. To me, this pullback looks like a textbook healthy correction within an ongoing uptrend, allowing the market to consolidate before the next move higher. I anticipate that buyers will step in around this level, defending the support and initiating a strong rebound. If the price holds and bounces off the pennant’s support line, it could trigger a bullish breakout, resuming the upward momentum. Based on this outlook, my TP target remains set at 125500. Please share this idea with your friends and click Boost 🚀
Disclaimer: As part of ThinkMarkets’ Influencer Program, I am sponsored to share and publish their charts in my analysis.
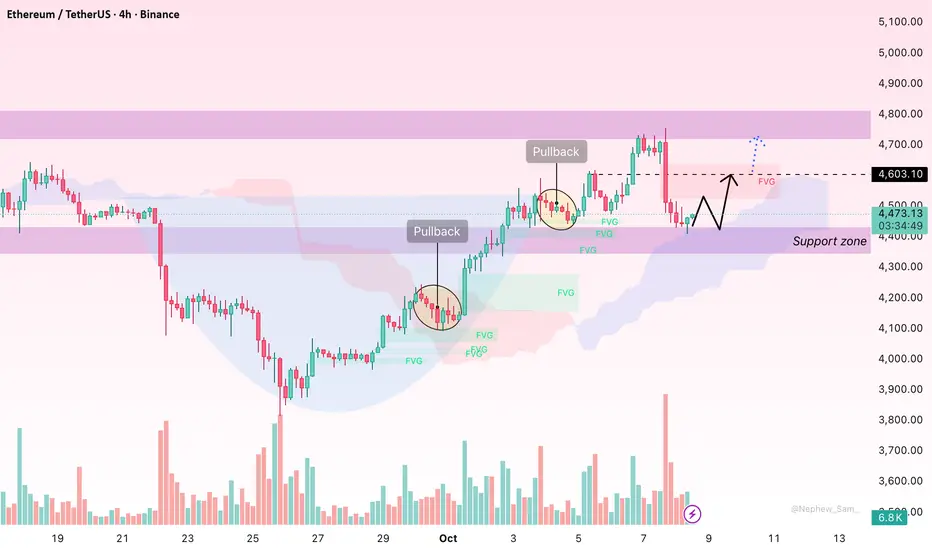
ETHUSDT: Minor Pullback After Rally, Signs of Ongoing RecoveryHello everyone, after reaching the recent peak near $4,500, Ethereum is showing signs of a mild correction. However, the decline quickly stabilised around $4,440, where buyers re-entered, and the Ichimoku cloud continues to provide solid support on the 4H chart.
Technically, ETH remains in a bullish structure with a consistent pattern of higher highs and higher lows. The Fair Value Gaps (FVG) created during the previous rally are yet to be fully filled, suggesting the market could see brief retests before resuming its upward movement.
The recent pullback is mainly driven by macro factors. Comments from several Fed officials hinted that monetary tightening could persist longer than expected, strengthening the USD and real yields, thereby putting pressure on risk assets like cryptocurrencies. At the same time, stronger-than-expected CPI and PCE data in the US have reignited inflation concerns, further boosting the dollar. This, combined with a temporary rotation into safe-haven assets, triggered short-term profit-taking in Ethereum.
Nonetheless, the medium-term uptrend remains intact. As long as the price stays above $4,400–$4,350, Ethereum is likely to recover towards $4,500 and potentially extend to $4,600. The short-term invalidation level lies at $4,350 — a close below that could open the door to a deeper pullback towards $4,250.
Personally, I believe this is just a “breather” in Ethereum’s broader bullish trend.
What about you — do you think ETH will soon reclaim $4,500, or will it need one more dip before rallying higher again?
The Market Doesn't Care About Your Thesis"The market can remain irrational longer than you can remain solvent." - John Maynard Keynes
A month ago, I wrote about the brutality of trading and introduced a concept I called the "trading pandemic" - when a chain of events clouds judgment, breaks confidence, and brings down even the best traders.
Life has a dark sense of humor. Shortly after publishing that post, I found myself living through exactly what I'd described.
The Storm That Found Me
Last week, I took significant losses. Not from ignorance. Not from recklessness. But from something far more dangerous: the very conviction that makes me a disciplined trader became the weight that pulled me under.
My thesis wasn't built on hopium or hunches. It was constructed on macro fundamentals:
The Setup:
IG:BITCOIN halving cycle suggesting the rally should fade by September
TVC:GOLD due for a correction as recession stress builds
SP:SPX primed for a rollover amid a macro death cross between inflation ECONOMICS:USINTR and unemployment ECONOMICS:USUR
The U.S. government shutdown on October 1st - echoing 2008 crisis conditions
And the blackout of key data reinforcing the uncertainty
Everything pointed to significant market stress. The fundamentals weren't just bearish - they were screaming. I waited patiently for the setup. I did the analysis. I had conviction backed by historical parallels and macro reality.
Then the market did what it does best: it ignored the script and wrote its own story.
When the Market Rewrites the Rules
Week two of October, IG:BITCOIN didn't just hold - it broke through ATH. TVC:GOLD continued its relentless climb. SP:SPX kept grinding higher with controlled strength that suggested continuation, not exhaustion.
Not with the kind of instability you'd expect during a government shutdown. Not with the fear you'd anticipate when economic data goes dark. But with the kind of structural strength that signals something bigger is happening beneath the surface.
What I started seeing instead was a completely different story unfolding:
Dedollarization accelerating faster than models predicted
Sovereigns accumulating TVC:GOLD at record pace
Institutional capital flooding IG:BITCOIN breaking cycle theory entirely
SP:SPX pricing in policy accommodation before stress even surfaced
Assets moving as if they're pricing in a paradigm shift, not a recession
The thesis wasn't wrong about stress in the system. It was wrong about how markets would price that stress.
Maybe this resolves later and my macro read proves correct on a longer timeframe. Maybe this controlled bull market is just an extended distribution before the real move down. Or maybe - and this is the hardest thing to accept - the market is telling me the playbook changed, and I'm still trading the old game.
I expected liquidation, but the market priced transformation.
The Paradox of Deep Conviction
Here's what last week reminded me: The same deep macro understanding that separates sophisticated traders from noise traders is also the double-edged sword that can cut you down.
You don't forget that conviction without risk management is dangerous. You know this. I know this. But when your thesis isn't just technical - when it's built on macro lens, death crosses, historical crisis parallels, cycle theories - conviction doesn't feel like opinion anymore. It feels like inevitability.
And that's when you start making exceptions:
"The 2008, and year 2000 parallels are undeniable - history doesn't lie"
"Government shutdown + data blackout = liquidity stress is coming"
"Dedollarization and sovereign gold buying confirms the global system is cracking"
" TVC:GOLD can’t keep climbing into a deflationary panic."
" Halving cycles has been the most accurate prediction of IG:BITCOIN for over a decade."
You're not abandoning your principles. You're just... trusting the depth of your research. This isn't a coin flip - you've done the macro work. You understand what's happening at a structural level.
But sometimes, conviction blinds you to what price is screaming: the rules changed.
When Fundamentals and Price Disagree
Here's the hardest pill to swallow: You can have an airtight macro thesis and still get destroyed if the market is playing a different game than the one you're analyzing.
I wasn't wrong to study the 2008 crisis parallels. I wasn't wrong to watch the unemployment-inflation death cross. I wasn't wrong to position for stress when the government shut down and economic data went dark. I wasn't even wrong about sovereign de-risking - that's actually happening.
But I was wrong about what markets would do with that information.
The markets didn’t ignore stress they front-ran the policy response.
Assets aren't climbing despite the fundamentals - they're climbing because of what those fundamentals imply about the future of fiat currencies, monetary policy, and the global financial system.
TVC:GOLD isn't rallying because everything's fine - it's rallying because sovereigns are losing faith in dollar hegemony
IG:BITCOIN isn't breaking halving theory because technicals matter less - it's breaking them because institutional adoption is rewriting the cycle dynamics
SP:SPX isn't ignoring the shutdown - it's pricing in that monetary policy remains accommodative no matter what happens
I was positioned for crisis.
The market was positioning for transformation.
Same data, entirely different interpretation and timeline...
When Knowing Isn't Enough
Nothing I learned this week was new. I got reminded.
Reminded that macro analysis tells you what might happen, not when or how markets will price it.
Reminded that historical parallels inform probabilities but don't dictate outcomes - especially when structural forces are shifting.
Reminded that when fundamentals say "crisis" but price action says "transformation," you don't fight price - you reassess your interpretation of the fundamentals.
Reminded that the market doesn't humble you because you're ignorant. It humbles you because you forgot that being right about the problem doesn't mean being right about the solution markets will price in.
The irony? The conviction that comes from deep macro research, from understanding sovereign behavior, from recognizing historical patterns - that same conviction blinds you to the moment you stop asking "What if markets are pricing this differently than 2008?" and start insisting "I know what's coming because I know what happened before."
The Trading Pandemic, Revisited
The trading pandemic isn’t when you’re lost.
It’s when you’re certain - certain enough to ignore what price is saying.
You stop asking “What if this time it’s different?” and start defending why it shouldn’t be.
You stop respecting liquidity dynamics and start fighting them.
And when you’re already drained personally or emotionally, that conviction turns to concrete. You don’t bend - you break.
The Double-Edged Sword
Here's the brutal truth: What makes us sophisticated traders - deep macro research, historical pattern recognition, fundamental analysis - is precisely what makes the storm hit us harder when markets reprice the narrative.
The trader who randomly bought IG:BITCOIN , TVC:GOLD , and SP:SPX in September and held? They're up significantly.
Not because they saw the shift - but because they had no thesis to be wrong about.
But when you lose after being this prepared - after reading every indicator, watching every pattern - it shakes more than confidence. It shakes identity.
Because if you can be this right on fundamentals and still be this wrong on timing, what does that say?
It says the market just handed you a gift wrapped in pain: the reminder that understanding the fundamentals doesn't guarantee understanding how markets will discount those fundamentals.
What the Market Reminded Me
Not taught. Not showed. Reminded.
That 2008 parallels matter less when the monetary system itself is being questioned
That a macro death cross doesn’t guarantee a crash - it can precede a reflationary melt-up.
That government shutdown + data blackout doesn't always trigger fear - it can mean "Fed will do whatever it takes"
That Bitcoin breaking halving cycles isn't a bug - it might be the feature of institutional adoption
That being unable to get updated economic data doesn't stop markets from pricing in what they expect that data to show
That when fundamentals and price diverge, price is telling you your interpretation is early
The Humbling Truth
Maybe my macro thesis resolves later - markets realize the stress, panic ensues, and the correction comes. Maybe this controlled bull market across IG:BITCOIN , CAPITALCOM:GOLD , and equities is just a longer distribution phase before reality hits.
Or maybe I'm watching the market tell me in real-time that we're not repricing a 2008-style crisis - we're repricing the end of dollar dominance, and I'm still trying to trade it like 2008.
Either way, it doesn't matter right now. What matters is that I was positioned for my version of the story, and the market is writing its own.
The government shut down October 1st. Data went dark. And instead of fear, markets priced in transformation. Instead of crisis, they priced in paradigm shift.
I was trading the problem. They were trading the solution.
Moving Forward
The losses hurt not because I didn’t know better - but because I did.
I knew that fundamentals don’t dictate timing.
I knew liquidity rules all.
But I trusted the thesis more than the tape.
Maybe it all reverses. Maybe it doesn't. But my job isn't to insist on my macro thesis - it's to respect what's happening right now and position accordingly, even when it contradicts everything my research suggests should happen.
The infinite game continues. The conviction that hurt me last week is the same conviction that's made me successful countless times before. I'm not trying to kill the macro analysis. I'm trying to keep it humble in the face of price action.
Final Word
The market only truly beats the trader who quits.
But it tests the trader who stays by reminding them, again and again, that mastery isn't having the right macro thesis. It's respecting price action even when - especially when - it contradicts every fundamental you've studied.
October 1st came. Government shut down. Data went dark. Death crosses formed. 2008 parallels aligned. Halving Cycle completed.
And yet, here we are - breaking every rule the old playbook taught us.
My thesis might still be right eventually. But "eventually" doesn't pay the bills, and it certainly doesn't save your account when you're positioned for a crisis and the market is pricing a transformation.
This week was expensive tuition for a lesson I already knew:
The market can remain irrational - or perhaps perfectly rational in a way you don't yet understand - longer than you can remain solvent betting against it.
Rise, remember, and keep playing the infinite game. 💚

Bitcoin Strategic Outlook: Macro and Technical SummaryMacroeconomic Context
Global liquidity is rising again. Over 50 rate cuts across G-20 economies, combined with China’s multi-trillion-yuan stimulus, have added roughly US $5 trillion to global liquidity this year. The world has entered an easing cycle, supporting risk assets.
The U.S. Federal Reserve has started cutting rates but remains cautious: strong fiscal spending on AI infrastructure and tight labor markets could reignite inflation. Analysts expect a pause in early 2026 if price pressures return. Real rates and Fed communication remain the key variables for traders.
Early-Cycle Momentum & Dollar Weakness
Global growth sits in an early-cycle phase. Manufacturing softness contrasts with steady service demand, while fiscal dominance—large government spending—keeps nominal growth near 3 %. Liquidity injections from China and other markets stabilize collateral values and suppress volatility. The U.S. dollar has weakened as capital rotates globally; historically, Bitcoin outperforms during dollar downtrends and post-geopolitical shocks, adding a macro tailwind.
Institutional Demand
U.S. spot ETFs continue to reshape supply. BlackRock’s IBIT surpassed US $15 billion in six months, while corporate holders of Bitcoin doubled to 134 firms. ETF and treasury accumulation now absorb most new issuance, muting volatility and creating a structural floor. Exchange outflows are at two-year highs, confirming long-term accumulation by whales and institutions.
Regulation & Policy Clarity
The GENIUS Act (2025) established a U.S. stablecoin framework, and FASB now requires fair-value accounting for crypto. Together with SEC listing standards, these changes reduce uncertainty for large investors. The U.S. shift toward clarity has improved confidence and should sustain institutional inflows.
Technical Overview
After eight months of consolidation, Bitcoin broke to new highs above $100 k. June’s monthly candle formed a bullish pin bar, confirming demand near $102 k. Indicators remain neutral with balanced funding rates.
Key technical levels:
• Resistance $125 k – major sell zone; breakout opens $130 k–$135 k.
• Intermediate $104 k–$100 k – psychological support.
• Strong support $95 k–$90 k – 200-day EMA zone.
Losing $90 k risks a correction toward $82 k–$74 k.
On-Chain and Sentiment
Glassnode data show whales accumulating and exchange balances shrinking. Bitwise and Fidelity both note that ETFs and corporations now hold enough BTC to reduce daily float meaningfully. Market sentiment is bullish but measured—investors expect high volatility yet maintain multi-year confidence.
Expert Consensus
Standard Chartered, Tom Lee, and ARK Invest project $150 k–$200 k by end-2025, citing liquidity growth and adoption. VanEck and long-term macro investors place decade-end targets above $500 k–$1 million. RBC Capital Markets warns that inflation shocks could pause rate cuts; traders should watch CPI and real-yield trends closely.
Strategic Outlook
1–3 months: Range trading $112 k–$125 k. Break above $125 k → $130 k–$135 k target. Below $116 k → test $112 k support.
6–12 months: Liquidity expansion and ETF inflows point to $150 k–$200 k. Best opportunities likely on pullbacks to $95 k–$100 k.
3–5 years: Fixed supply, corporate adoption, and de-dollarization support an upward bias; structural forecasts $500 k–$1 million remain plausible.
Key Takeaways
Global liquidity is the dominant driver—monitor rate cuts and USD trends.
Institutional accumulation provides downside protection.
$125 k resistance defines near-term risk/reward.
Macro risks: renewed inflation, Fed policy reversals, geopolitical shocks.
Conclusion
Bitcoin enters Q4 2025 with a supportive macro backdrop, rising institutional demand, and technically strong structure. The path is volatile, but the long-term narrative of Bitcoin as a scarce, non-sovereign asset remains intact.
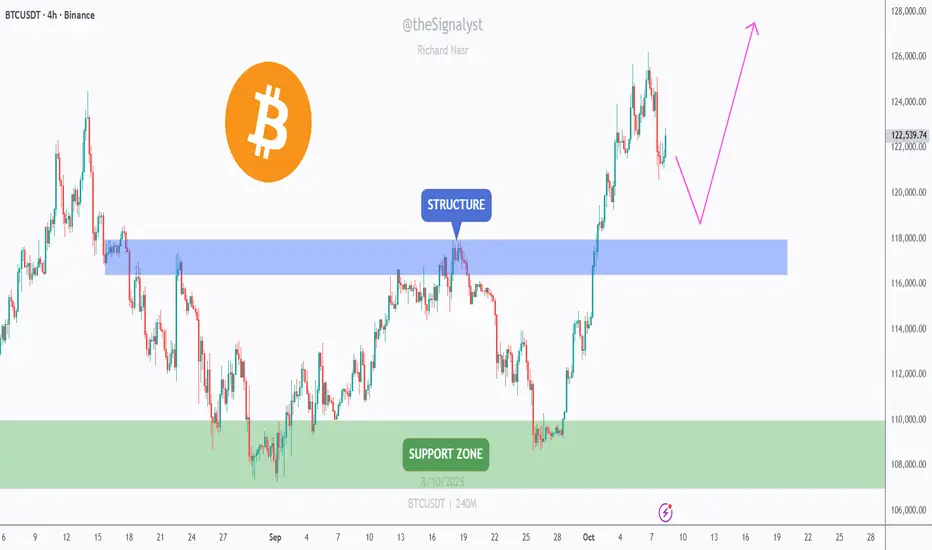
BTC – Eyeing a Retest of the $118K Structure!CRYPTOCAP:BTC broke above the $117K–$119K structure (blue zone) with strong momentum.
I’m now watching for a pullback to this area to form a higher low and resume the uptrend.
As long as price holds above $117K–$119K, I’ll look for trend-following longs toward $125K–$128K, then the $130K handle.
If the blue zone fails, the next support sits at $106K–$110K (green zone), where bulls may regroup.
⚠️ Disclaimer: This is not financial advice. Always do your own research and manage risk properly.
📚 Stick to your trading plan regarding entries, risk, and management.
Good luck! 🍀
All Strategies Are Good; If Managed Properly!
~Richard Nasr
Bitcoin Roadmap Before FOMC Minutes – Correction or New ATH?Today, we have one of the most important macro events — the FOMC Meeting Minutes
Let’s quickly understand what it is and why it could shake the crypto market
What are FOMC Minutes?
They’re the detailed notes from the last Federal Reserve meeting, showing what members discussed about interest rates, inflation, and the economy.
Markets carefully read every line to find hints about future rate cuts or continued tightening.
Why does it matter for Bitcoin?
When the Fed turns dovish (hinting at lower rates), risk assets like Bitcoin usually rally But when the tone is hawkish (worried about inflation), investors move to cash or bonds, causing crypto to dip.
Let’s take a look at Bitcoin ( BINANCE:BTCUSDT ) on the 4-hour timeframe .
Before analyzing the chart, let’s quickly review what defines a strong uptrend :
1-Higher Lows(HL):
Each new low should form above the previous one, showing that buyers are stepping in earlier each time.
2-Higher Highs(HH):
Each new high should be higher than the last, confirming that bullish momentum is still in control.
3-Structure Respect:
The new low should not break below the previous high — if it does, it doesn’t necessarily mean the trend is over, but it indicates a weakening of the bullish structure.
Based on the points above, Bitcoin failed to form a new Higher Low(HL) during the past 24 hours, and the previous high was retested .
These signals indicate a loss of bullish momentum, suggesting that we might see at least a short-term correction from a technical perspective.
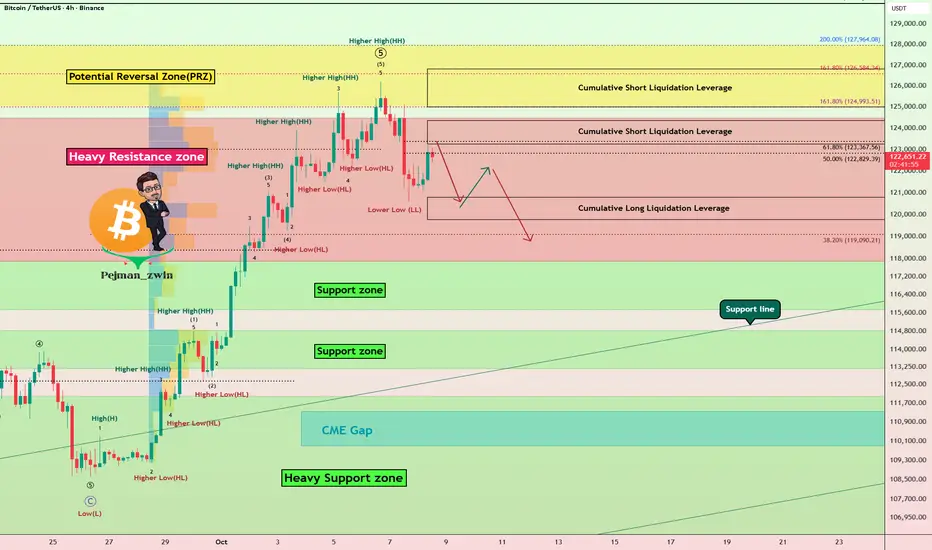
Bitcoin has already started to bounce back nicely from the Potential Reversal Zone (PRZ) and is currently trading in a Heavy Resistance zone($124,474-$117,900) .
In terms of Elliott Wave theory , it seems that with the formation of a Lower Low(LL) , Bitcoin has completed at least a series of impulsive waves , and we can now expect corrective waves .
I expect Bitcoin to drop to at least Cumulative Long Liquidation Leverage($120,779-$119,957) before the FOMC Meeting Minutes start and could continue to rise or correct depending on the tone of the FOMC Meeting Minutes .
Note: You should note that these days, Bitcoin has a higher correlation with the SPX500( SP:SPX ) index than before, so if there is a sudden movement in Bitcoin, one of the reasons could be a sudden movement in the SPX500.
Do you think this bullish move could lead to a new all-time high (ATH) for Bitcoin again!?
Cumulative Short Liquidation Leverage: $124,350-$123,244
Cumulative Short Liquidation Leverage: $126,813-$125,000
CME Gap: $111,355-$109,915
Please respect each other's ideas and express them politely if you agree or disagree.
Bitcoin Analysis (BTCUSDT), 4-hour time frame.
Be sure to follow the updated ideas.
Do not forget to put a Stop loss for your positions (For every position you want to open).
Please follow your strategy and updates; this is just my Idea, and I will gladly see your ideas in this post.
Please do not forget the ✅' like '✅ button 🙏😊 & Share it with your friends; thanks, and Trade safe.
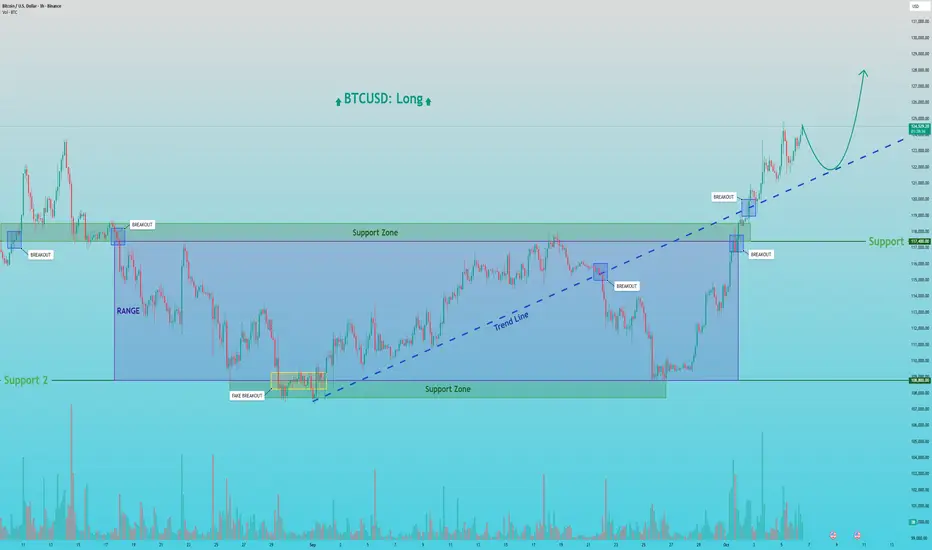
BTCUSD: Is This the Breakout to a New All-Time High?Hello everyone, here is my breakdown of the current Bitcoin setup.
Market Analysis
From a broader perspective, the price action for Bitcoin has been complex, culminating in a powerful breakout. After a fake breakdown below the 108800 Support level, the price reversed strongly, broke out of its consolidation range, and also pushed above a major trend line.
This series of events shows significant bullish strength. Currently, after this strong breakout, the price is in a natural corrective phase, pulling back to retest the broken structures from above.
My Scenario & Strategy
My scenario is built on the idea that this breakout is valid and the uptrend will continue. I see the current pullback as a classic retest, offering a potential opportunity to join the new bullish momentum.
I'm looking for the price to complete its correction to the broken trend line. A confirmed and strong bounce from this line would be the key signal for me that the pullback is over and the primary trend is ready to resume.
Therefore, the strategy is to watch for this bounce. A successful defense of the trend line would validate the long scenario. My new target for the next impulsive wave higher is 128000, which would be a new ATH.
That's the setup I'm tracking. Thank you for your attention, and always manage your risk.
Bitcoin Hodlers are happy campers - BUT🕷️ 🌕 🦇 In Switzerland it’s now 11:50 PM 🕷️ 🌕 🦇
I’m tired from a long day in the markets, but I feel I have to get this one out because it’s important for many of you holding Bitcoin.
In my last post, I said we’d run upward to reach the Hagopian Line, and here we are, even higher.
We’ve just tagged the U-MLH for the third time.
There’s an old pattern from the futures markets that farmers once noticed. It’s called the “Three Drives” pattern.
The old farmers knew that when this pattern appeared, it was time to hedge their crops, or add to their hedge.
When I was a student at MarketGeometry, Tim Morge explained this pattern, and ever since it’s served me well as a signal for a trend reversal.
I don’t know exactly how this will help each of you, but I’m sure it’s worth a heads-up. Whether you decide to hedge, close your positions, or just HODL until the sun burns out, it’s something to keep in mind.
Meanwhile, the Harvest Moon is shining into my office tonight, twinkling with a strange grin... 🌕
Time for me to rest.
Good night, everyone.
🌾 🌾 🌾 🌾 🌾 🌾 🌾

Bitcoin getting rejected at all time highBTC is preparing for another BOS; however, it seems that big players want to suppress the price. Momentum remains bullish, and so does the trend, but more importantly, the sentiment is still bullish. A bearish response that fails to produce a lower low is an opportunity to accumulate.
Bitcoin - The path remains clearly bullish!💰Bitcoin ( CRYPTO:BTCUSD ) remains bullish either way:
🔎Analysis summary:
For the past 1.000 days, Bitcoin has simply been heading higher. Considering that the previous bullruns lasted about 800 days, Bitcoin is ready for a correction. But market structure tells us, that Bitcoin remains bullish, even if we see a short term correction in the near future.
📝Levels to watch:
$50.000, $1.000.000
SwingTraderPhil
SwingTrading.Simplified. | Investing.Simplified. | #LONGTERMVISION

Bitcoin can Fail its Retest and Fall to 117900 pointsHello traders, I want share with you my opinion about Bitcoin. The market for Bitcoin has shown a significant sign of exhaustion and reversal after establishing a new all-time high at the 126000 level. Although this peak was preceded by a strong breakout from a prior downward wedge, the rally failed to sustain, leading to a sharp sell-off. This has shifted the market structure to a bearish bias, confirmed by a decisive breakdown below the key 123300 level. Currently, the price of BTC is in a minor corrective phase, rallying back towards this broken structure. This price action is setting up a classic retest of former support as new resistance. In my mind, this retest presents a high-probability opportunity for sellers. I expect that the price will make a small upward movement into the seller zone near 123300. I think a confirmed rejection from this area will validate the bearish reversal and trigger the next impulsive move downwards. Therefore, I have placed my TP at 117900, targeting a significant area of prior price action and liquidity. Please share this idea with your friends and click Boost 🚀
Disclaimer: As part of ThinkMarkets’ Influencer Program, I am sponsored to share and publish their charts in my analysis.
BTC's situation+next targets and expected movementsBitcoin, as you can see, is within a descending wedge. If it breaks down, the price could drop below $100k, but we should wait for the breakout confirmation.

BITCOIN (BTCUSD): Important Breakout
Bitcoin broke and closed above a major resistance cluster
based on a previous ATH.
A confirmed break of structure indicates a highly probably bullish continuation.
The next resistance is 128000.
It might be the next goal for the buyers.
❤️Please, support my work with like, thank you!❤️
I am part of Trade Nation's Influencer program and receive a monthly fee for using their TradingView charts in my analysis.

Setting the Bar Higher: $129,812 First, But $138,888 in SightSetting the Bar Higher: $129,812 First, But $138,888 in Sight 🎯📈
Bitcoin just posted two new All-Time Highs in a week, followed by a modest 3% pullback . In past cycles, that kind of drop would be minor.
But today, it feels different — because it is.
We’re in the part of the cycle where dips are fuel, not fear.
Much like Armand “Mondo” Duplantis , Bitcoin doesn’t launch with everything it’s got.
It clears bars intentionally — just enough to break records and keep the momentum flowing.
When Duplantis needs a bigger pole, it’s because he’s moving faster than expected.
Sound familiar?
🔹 Next technical bar: $129,812 (0.618 Fib)
🔹 Real target: $138,888 — where the vault gets serious
🔹 Momentum intact, shorts wrecked, runway loaded. Again. 🚀
“Off the runway... (got a bigger pole)” 🔄⏫
Translation? The next jump isn’t just coming. It’s being engineered.
Perspective Shift 🔄
“Sometimes it’s not about how high you go — but how consistently you clear new heights. Bitcoin isn’t rushing ATHs. It’s pacing them with precision. ”
Disclaimer: These charts and analyses reflect my personal opinion only. I am not a financial advisor. Nothing here is financial advice. Trading involves risk, and you are fully responsible for your own decisions. Trade wisely, develop wisdom and remember to have FUN!.
One Love,
The FXPROFESSOR 💙

We predicted this downturn - page accuracy will spook you out!Hey, guys.....
just wanted to say our analysis of the market is really playing out.
This bearish momentum should continue to 114,228$ very easily. Thereafter, it should continue to 106,607$ to create a new low for the past few months.
we don't think that the bearish price action will stop here though, 92,249$ is the price we expect price to hit within the next 2 months or less.
I think this should be the final aggressive bull move we have in the market for the next few months and the bears should take full charge from here.

$Solana $250+ or DOWN 216?In our recent post, we perfectly predicted the touch of 250 and 190.
Price has now reversed off the supply zone and is making its way back up, lets see what the potential out come for the next two weeks are!
Solana (SOL/USDT) 1H Chart Analysis
Current Price: ~$232
Trend : Price is was inside a clear ascending channel, respecting support and resistance lines - however has now breached resistance.
Key Levels
Support Zones:
$225 → Psychological support + 4H FVG.
$216 → Deeper 4H FVG and strong volume node. ( + 4 Hour Fib GP )
$200 → Major psychological level + prior supply zone flip.
Resistance Zones:
$250 → Psychological resistance + demand zone.
$275 → Next major resistance if $250 breaks.
Bullish Scenario
If SOL holds above $225 and consolidates within the trend channel, price could retest $250.
Break and close above $250 may extend rally toward $275.
Bearish Scenario
Failure to hold $225 could drag SOL to the $216 FVG or even $208.
A breakdown of $208 increases risk of revisiting $200.
Summary
Market structure remains bullish as long as price respects the rising trendline.
$225 is the key short-term pivot: holding above favors $250+, losing it opens downside risk toward $216–200.
Let me know what you think!

TradeCityPro | Bitcoin Daily Analysis #190👋 Welcome to TradeCity Pro!
Let’s dive into today’s Bitcoin analysis. The market, after experiencing a decline, is now ready to resume its primary bullish trend.
⏳ 1-Hour Timeframe
Yesterday, after Bitcoin confirmed a break below the channel, it retested the channel and activated the trigger at 123493, leading to a brief bearish movement.
📊 The first support zone was 122574, but the price didn't react to it, resulting in a break below. The next key support zone was 120835, where the price reacted and formed a low.
✨ After the price found support at 120835, a peak formed at 122084, creating a compression between 120835 and 122084.
📈 Currently, after breaking above the compression range, a bullish movement has started, and the price has reached back above 123491.
⚡️ The good thing about the correction to 120835 is that many long positions that hadn’t taken profit were now closed, reducing selling pressure in the market. This provides Bitcoin a chance to continue its bullish trend with a more structured approach.
🚀 However, if the price fails to break the previous high of 126042, a lower high would form, which is a sign of weakness in the bullish trend.
🎲 If that happens, and if the price stabilizes below 120835, we’ll get confirmation of a bearish shift in this timeframe. But for now, this hasn’t happened, and the market momentum remains bullish.
🔍 For a new position, if you haven’t opened a position after breaking 122084, there is no valid trigger at the moment, and we should wait for the market to create a proper structure for entry. Otherwise, the only trigger we have right now is breaking 126042.
🔽 For a short position, I am waiting for the trend change scenario to unfold before considering any short triggers.
❌ Disclaimer ❌
Trading futures is highly risky and dangerous. If you're not an expert, these triggers may not be suitable for you. You should first learn risk and capital management. You can also use the educational content from this channel.
Finally, these triggers reflect my personal opinions on price action, and the market may move completely against this analysis. So, do your own research before opening any position.

BITCOIN This is the last Resistance standing.Bitcoin (BTCUSD) got rejected (and is currently pulling back) on the Higher Highs trend-line that started on July 14. This is technically the last Resistance before a complete technical bullish break-out that will take the market to a new pattern out of this 3-month consolidation phase.
Until that happens, there are high probabilities to extend this pull-back all the way to the 0.382 Fibonacci extension ($119.5k), which is the minimum level that all similar corrections within these 3 months pulled back to.
As you can see such similar corrections have all been on 4H RSI Bearish Divergences, which have been Lower Highs against BTC's Higher Highs, typical indicator of a Top.
So what do you think will happen next, pull-back or break-out? Feel free to let us know in the comments section below!
-------------------------------------------------------------------------------
** Please LIKE 👍, FOLLOW ✅, SHARE 🙌 and COMMENT ✍ if you enjoy this idea! Also share your ideas and charts in the comments section below! This is best way to keep it relevant, support us, keep the content here free and allow the idea to reach as many people as possible. **
-------------------------------------------------------------------------------
💸💸💸💸💸💸
👇 👇 👇 👇 👇 👇

Ethereum Targets $4,800 as Bullish Trend Stays StrongHello everyone, Ethereum continues its impressive recovery, climbing from the $4,500 support area to trade near $4,677. The market structure remains bullish as institutional inflows strengthen and investor sentiment turns optimistic again.
On the 4-hour chart, ETH/USD maintains a steady upward pattern. The $4,500 zone acts as a solid foundation where buyers consistently defend. Immediate resistance sits around $4,730 — once cleared, Ethereum could extend toward $4,800 and possibly $5,000. The previous Fair Value Gaps have already been filled, showing a strong accumulation base before any new breakout.
From a fundamental view, inflows from institutional investors and the momentum surrounding Ethereum staking ETFs like Grayscale’s continue to boost demand. The on-chain activity in DeFi and Layer 2 ecosystems further supports the case for continued strength in ETH.
Overall, as long as the price holds above $4,500, the bullish bias remains intact with a clear path toward $4,800. Only a break below $4,500 could trigger a short-term pullback toward $4,420 before recovery resumes.
So, what do you think — will ETH hit $4,800 this week?
