BITCOIN – LEVELS TO WATCHTraders,
We dumped. Now we are in a controlled recovery. The question is not only “are we going up” but “where will the market make its real decision.” Right now the chart is giving us two very clean checkpoints.
1. What happened
We lost the weekly open and sold off.
Spot was selling too, so the dump was real.
After the low, spot started buying again and price reclaimed above the big wick. That looks like a failed attempt lower.
Markets left a really weak low behind at ~99k. I am convinced we will sweep this low somewhere in the coming weeks.
Funding is negative while price is moving up. Shorts are still in the market. This is how squeezes start.
2. First decision zone: 107.300 to 108.000
This area is important because several things come together.
107.300 is a weak high. It stopped at a clean level without strong rejection. That often means liquidity is still sitting above it.
The AVWAP anchored from 7 April is there. Price is below it for the first time since that move. When price comes back into an AVWAP from below the market often reacts because old buyers meet new sellers.
We also have an LVN just below. That tells us the market did not trade much there before. Price likes to test that kind of gap.
So 107k to 108k is our first place to watch the data. If spot keeps pushing and perps do not start selling we can break it. If CVD stalls there it can be a take profit zone.
3. Accumulation and Distribution
On both the 1 hour and 4 hour spot charts the Accumulation/Distribution line tells an important story.
Price made a clear new low after the dump.
The A/D line did not make a new low. It actually started to turn up.
That is what traders call a bullish divergence. Price is still falling but the money flow is already improving.
In simple words. While candles were going down someone was quietly buying.
That means the bounce we see now is not just short covering or a random spike. It was prepared by real spot demand.
Futures can show a similar thing but spot is the cleaner signal because it is not influenced by funding, leverage or hedges.
When real buyers step in while shorts are still in the market it often creates the right conditions for a squeeze.
4. OBV check
On the 4h OBV you can see it popping up from the base after the dump. OBV going up while price is moving up means volume is supporting the move. This agrees with the spot A/D story. It is better when price and OBV move together than when price moves alone.
5. Scenario 1
Price pushes into 107k to 108k.
That sweep takes the weak high and tags the AVWAP.
If at that point spot CVD slows down or perps start to sell we can reject.
A rejection there can send price back into the mid zone and even lower towards 101k to 102k and in extension back to the HTF LVN near 98k.
This is the simple “first resistance holds” idea.
6. Scenario 2
This is the one I am leaning toward.
Price breaks and holds above 108k.
Shorts do not get their reaction.
Spot keeps supporting and funding stays negative to flat.
Then the market has room to go for the next real liquidity pool which is 117k to 118k.
7. Why 117k to 118k matters
On the liquidity heatmap there is clear resting liquidity higher up. Price often travels to those areas because that is where orders are.
The golden pocket of the previous move sits in this same zone. Many traders watch this fib area so reactions there are common.
Several AVWAP bands from earlier dates are meeting around 117k to 118k. When AVWAPs from different anchors cluster together it creates a stronger level because different groups of traders all care about that price.
Between the current price and that zone there are imbalances and LVNs. That means the market moved quickly there before and did not build volume. These thin areas often get filled on the next push.
8. How to read it in real time
Above 108k and spot CVD still rising means squeeze is on.
Above 108k and funding still negative means shorts are paying to stay wrong.
Lose 108k again after a sweep and see CVD roll over means scenario 1 is playing.
Price can just dump down without getting more liquidity. But looking unlikely based on the data right now.
So if Bitcoin can break and hold above 108k there is not much in the way until 117k to 118k.
Final view
We dumped on real flow.
We are recovering with spot support.
We have a clear first test at 107k to 108k.
Break and hold and the magnet becomes 117k to 118k because of liquidity, golden pocket, AVWAP confluence and imbalance.
TLDR;
Bitcoin sold off hard, but the data says the low was bought. Spot A/D started rising while price was still making new lows, funding turned negative and price reclaimed above the wick, which tells us real buyers stepped in while shorts stayed in their positions. Now price is climbing back toward 107k to 108k where a weak high and the April AVWAP are waiting, so that is the first place the market can decide if this recovery is just a bounce or the start of a squeeze. If buyers keep showing up there and we push through, the path above is thin and the next real pocket of liquidity, AVWAP confluence, imbalance and even the golden pocket of the earlier move all sit together around 117k to 118k. That is why this recovery matters. It is not just candles going up. It is positioning, spot flow and liquidity all lining up.
If you enjoy this type of analysis or find it helpful, leave a like or drop a comment. I don’t ask for anything in return — I share this to help traders understand what’s really happening behind the charts. It also helps me see if people actually read and value these breakdowns, so if it helped you, let me know below.
Bitcoin (Cryptocurrency)

BITCOIN 's Bear Cycle has started according to the Dollar.It is one of the oldest charts around. Bitcoin (BTCUSD) vs U.S. Dollar Index (DXY). And perhaps one of the most accurate or to phrase it better, one of the most informative.
As you can see, every time the DXY (black trend-line) bottoms and rebounds (green Arcs), BTC tops and corrects (red Arcs), initiating its Bear Cycle.
Right now the news are far from favorable for Bitcoin's Bull Cycle case as the Dollar has broken above the previous Lower High and continues to rebound. That's a potential bottom, hence high probabilities for BTC to start a new Bear Cycle.
Would you trust this chart? Feel free to let us know in the comments section below!
-------------------------------------------------------------------------------
** Please LIKE 👍, FOLLOW ✅, SHARE 🙌 and COMMENT ✍ if you enjoy this idea! Also share your ideas and charts in the comments section below! This is best way to keep it relevant, support us, keep the content here free and allow the idea to reach as many people as possible. **
-------------------------------------------------------------------------------
💸💸💸💸💸💸
👇 👇 👇 👇 👇 👇

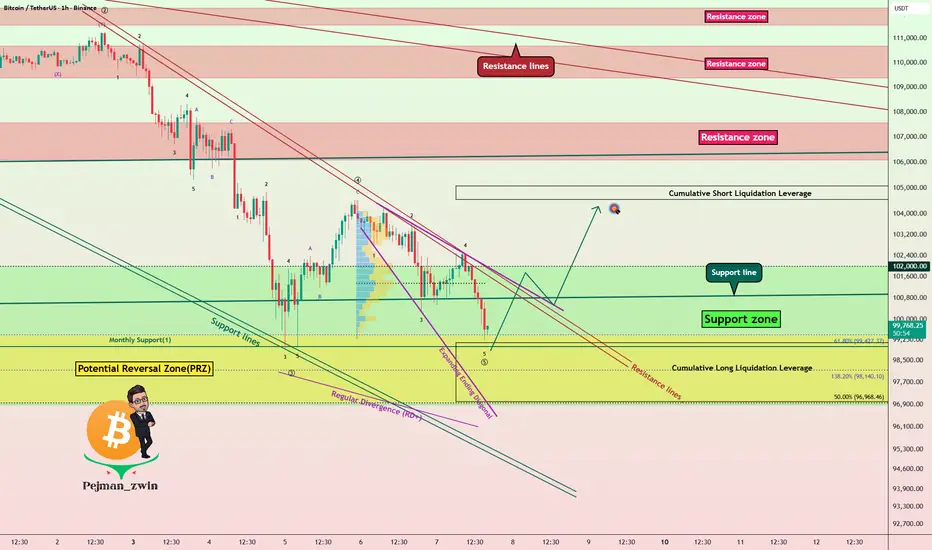
Bitcoin Bulls Defending $97K – Reversal Loading!Before diving into the Bitcoin analysis , it’s worth noting that Bitcoin has had a strong correlation with the SPX500 index ( SP:SPX ) in recent weeks. So, alongside analyzing Bitcoin, it’s a good idea to keep an eye on the SPX500 chart these days.
Currently, Bitcoin( BINANCE:BTCUSDT ) is moving in a Support zone($10200,980-$96,880) near a Potential Reversal Zone(PRZ) and a Cumulative Long Liquidation Leverage($99,145-$97,208) .
From an Elliott Wave perspective, it looks like Bitcoin is forming an Expanding Ending Diagonal to complete the microwave 5 of the main wave 5 .
Also, we can see a Regular Divergence(RD+) , which is a good sign of a potential reversal.
Given my expectation that the SPX500 Index will start to rise again, I also expect that Bitcoin will follow suit and could climb at least to around $104,200 .
Cumulative Short Liquidation Leverage: $105,074-$104,551
Stop Loss: $96,178
Please respect each other's ideas and express them politely if you agree or disagree.
Bitcoin Analysis (BTCUSDT), 1-hour time frame.
Be sure to follow the updated ideas.
Do not forget to put a Stop loss for your positions (For every position you want to open).
Please follow your strategy and updates; this is just my Idea, and I will gladly see your ideas in this post.
SOL/USDT – Holding Steady Near the $160 ThresholdHello everyone, Solana (SOL/USDT) is currently stabilising around $156 after a strong correction earlier this week. This area serves as a key support level, as buying pressure has become more visible over recent sessions.
On the 4-hour chart, the main trend still leans slightly bearish, but the repeated rebounds from $155–156 suggest that buyers are trying to defend the base.
From a news perspective, the broader crypto market remains influenced by U.S. monetary policy. A stronger dollar and 10-year Treasury yields hovering around 4.2% have made investors more cautious toward risk assets like crypto. However, Solana stands out thanks to steady capital inflows into its DeFi and NFT ecosystems, along with ongoing institutional interest — factors that have helped prevent heavy sell-offs.
Overall, liquidity within the Solana ecosystem remains stable despite macro headwinds. Therefore, SOL is likely to continue moving within the $155–160 range before deciding on its next direction.
What do you think — can Solana hold this base and bounce back soon?

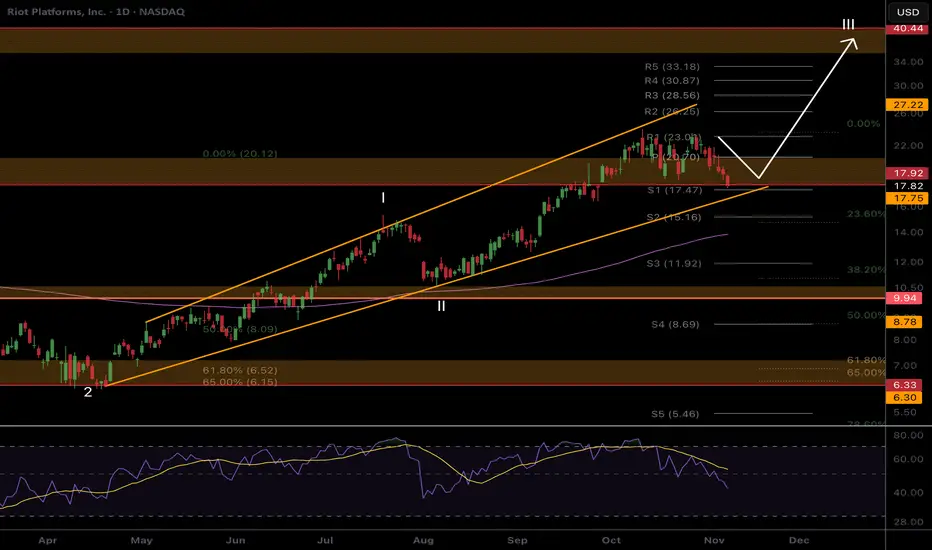
RIOT Respecting the boundariesPrice remains in its uptrend channel demonstrating shallow pullbacks as is characteristic of wave III.
Price is consolidating above support which could lead to a break down below but still within the boundaries of the channel. Daily 200EMA is ascending to meet price and support lines.
Daily RSI has printed unconfirmed bullish divergence at the EQ.
Continued upside has a $40 target at the next High Volume Node.
Bitcoin Bulls Target $113K**Bitcoin (BTC/USD) Analysis — November 2025**
Bitcoin has been moving within a controlled downtrend channel, facing continuous lower highs since late October. The market recently went through a **liquidity sweep**, followed by a minor **market structure shift (MSS)** on the 3-hour timeframe. This suggests exhaustion in the current bearish leg.
After a period of **sideways consolidation**, price is testing a strong accumulation zone near the **$100K–$97K** region. This zone aligns with prior demand and high-volume nodes, making it a potential base for a bullish reversal.
A clean rebound from this level could drive Bitcoin toward the **$113K–$115K** area, where the next liquidity cluster sits. If buyers regain momentum, this move could accelerate into a **V-shaped recovery**, confirming the start of a fresh mid-term bullish cycle.
Overall sentiment remains **bullish**, supported by renewed buyer activity and potential macro-driven inflows ahead. Traders should watch for volatility spikes as the market transitions from accumulation to breakout mode.
**Key Takeaway:**
BTC is stabilizing near key demand, eyeing a rebound toward $113K+. Momentum confirmation above the short-term consolidation zone could trigger a strong upward continuation.
**#Bitcoin #BTCUSD #CryptoAnalysis #BitcoinForecast #BTCPricePrediction #CryptoTrading #BullishReversal #CryptoMarket #TradingViewAnalysis**

GOLD vs. TOTAL MARKET CAP. Gold touched the top band of the HTF rising wedge structure and the 0.618 Fib channel... then rejected.
This view appears to be a multi-year high.
So where is Total Market Cap at this point?
At the base of the same structure...
Is one's journey ending and the other's run beginning?
The crypto market is just beginning to gather its strongest momentum.
Target: The upper band of the rising wedge.
This view is HTF analysis.
Please do not confuse it with hourly and daily timeframes.

Ethereum Bounces Amid Crypto Outflows – Short-Term OutlookHello everyone, Ethereum saw an interesting technical rebound yesterday amid concerns over the Fed and crypto liquidity outflows, so let’s analyse ETH today! The ADP Non-Farm Employment Change reported an increase of 42,000 jobs, well above the 28,000 forecast, reinforcing the view that the Fed is unlikely to cut rates soon. This strengthened the USD and slightly raised U.S. Treasury yields. Meanwhile, U.S. stocks like the NASDAQ and S&P500 declined as investors worried about “higher for longer,” causing short-term outflows from crypto. Despite this, ETH held its 3,100 – 3,200 USD floor, signalling that buyers are beginning to step in.
From a 4H technical perspective, Ethereum touched a low at 3,110 USD, forming a long-wick candle with surging volume, reflecting strong buying pressure. Currently, price is retracing within the 3,420–3,500 USD FVG, with the lower green FVG at 3,340–3,390 offering support and the upper red FVG at 3,500–3,600 acting as resistance, coinciding with the supply zone of 3 November. The Ichimoku cloud remains above price, showing the dominant downtrend, and decreasing volume on the rise confirms this is merely a technical rebound.
In my view, there are two scenarios. The higher probability is ETH testing 3,500 – 3,550 USD before returning to 3,350 – 3,300 USD to accumulate, then bouncing toward 3,600 – 3,680 USD. A lower probability scenario is a breakout above 3,550 USD with strong volume, potentially reaching 3,700 – 3,780 USD (upper FVG). Conversely, a break below 3,300 USD would invalidate the rebound and push ETH to 3,150 – 3,100 USD to attract liquidity before recovery.
Overall, this remains a technical bounce in a medium-term downtrend, though a short squeeze could occur if BTC stays above 65,000 and U.S. stocks stabilise. Ethereum’s intrinsic strength via DeFi and staking suggests 3,100 – 3,200 USD is an important short-term floor. Without a Fed or USD shock, I expect ETH to recover toward 3,600 before sideways movement and a clearer trend emerges mid-November.
So, what about you – how long do you expect this ETH rebound to hold? Comment below to share your view!

BTC Strong Surge: Heading Towards 110,700 USD!BTC/USDT is in the process of a strong recovery after reaching the important support level at 99,500 USD. After forming a bottom and bouncing from this level, the current trend indicates a high potential for continued growth.
The next resistance level for BTC is 110,700 USD. If the pair can break through this level and maintain above it, the price could continue its strong upward momentum, opening the opportunity to reach higher levels in the short term.
However, if it fails to hold above the 99,500 USD support, BTC may face difficulties and could pull back to lower support levels. Despite this, with the current positive technical signals, the likelihood of BTC continuing to rise in the next 24 hours is very high.
Traders should carefully monitor these support and resistance levels to formulate an appropriate trading strategy.

BITCOIN → The hunt for liquidity before the decline BINANCE:BTCUSDT is testing the 100K area and updating its local minimum to 98,900 as part of another liquidation. The market is weak, and bulls are trying to wait out the panic...
Bitcoin looks weak. After a sharp decline, a pullback is forming, during which the price may test the break-even and interest zones — previously broken support areas. Buyers are not yet showing themselves in the market...
There is an intermediate bottom at 98,900, as well as the upper limit of the local range at 105,200. The range of 105,200 - 107,200 - 108,200 is important because it hides a pool of liquidity for a downward movement. MM may reach these zones and bring the price back into the trading range.
Resistance levels: 105,182, 107,271
Support levels: 101130, 98900
A retest of resistance at 105182 and the lack of potential for continued growth may confirm the fact of a false breakout, which in turn may provoke a fall to local targets. I do not rule out the possibility that the price may go even higher, for example, to 107270 - 108200. I do not see any point in waiting for a trend reversal yet...
Best regards, R. Linda!

TradeCityPro | Bitcoin Daily Analysis #213👋 Welcome to TradeCity Pro!
Let’s dive into the Bitcoin analysis. The market has been calm for a few days, but we need to stay alert in case a new move starts, so we don’t miss out.
⏳ 1-Hour Timeframe
After reacting to the 0.382 Fibonacci level, Bitcoin started to drop again and reached the 100,308 support.
✨ Currently, after a minor bullish correction, the price is heading back towards the 100,308 support.
✅ Breaking this support still seems like a strong trigger for a short position. Even yesterday, when the price briefly reached this zone with a shadow, we saw clear buying interest in this area, with a significant increase in buying volume as the price touched the support.
🔑 The key point is that every time the price reacts to this level, the buying pressure is getting weaker. Fewer and fewer buyers are willing to buy at this level.
🎲 If this pattern continues, the psychological level of 100,000 will lose its impact, and breaking it will become easier.
⚖️ So, if the price touches this support a few more times, I anticipate a higher chance of the level breaking.
⭐ However, if the buyers show more strength at this level and can push the price above 104,000 with significant volume, we could expect Bitcoin to turn bullish.
📝 Final Thoughts
Stay calm, trade wisely, and let's capture the market's best opportunities!
This analysis reflects our opinions and is not financial advice.
Share your thoughts in the comments, and don’t forget to share this analysis with your friends! ❤️

SOL to $4500?Internet Capital Markets
I believe Solana is going to take over the entire financial system.

Bitcoin - dont guess - wait for price to show u a directionBitcoin - dont guess - wait for price to show u a direction
In a case of sqeezing with Oi rise - we`ll trade break up
in a cae fo bull trap - we take short
wait

Bitcoin is Still Bearish (12H)Bitcoin still looks bearish | it seems to be inside wave C, and this upward move could be aimed at collecting sell orders and liquidating part of the short positions held by retail traders.
From the yellow circle, the price could get rejected toward TP1 and TP2.
Let’s wait and see what happens.
For risk management, please don't forget stop loss and capital management
When we reach the first target, save some profit and then change the stop to entry
Comment if you have any questions
Thank You

$BTC Same zone. Same faith.Bitcoin is once again holding at the VWMA and SMA13 support on the monthly chart.
From past to present, the trend has never changed unless these supports were broken.
As long as monthly closes stay up...
Everything else is just noise.

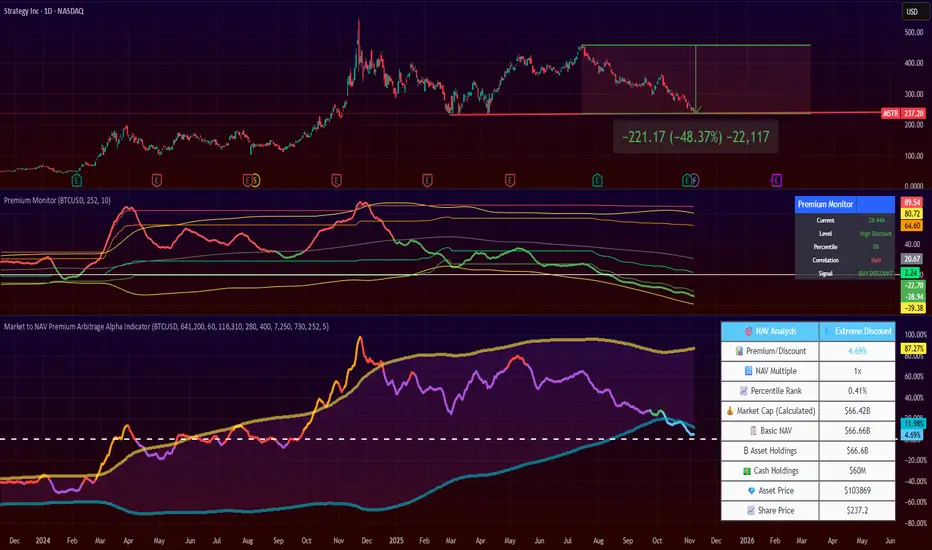
Strategy's Premium is Gone. Time to Load? 4 months ago, I posted that NASDAQ:MSTR premium was unsustainable and the stock price would drop.
Since then, the price dropped by 50%!!
Now, Strategy's is close to zero, and I flip my views on it.
If you like this kind of trade, it might be a good time to start DCA'ing it.
Note that Strategy continues to be a highly volatile stock, more volatile than Bitcoin itself.
Finally, the stock is now at a technical resistance level.
You can keep an eye on the premium/discount of this stock by looking at my 2 indicators:
Market to NAV Premium Arbitrage Alpha Indicator , and
Asset Premium/Discount Monitor
BITCOIN SIGNAL: PUMP INCOMING???? (trap alert) Yello Paradisers! Enjoy the video!
And Paradisers! Keep in mind to trade only with a proper professional trading strategy. Wait for confirmations. Play with tactics. This is the only way you can be long-term profitable.
Remember, don’t trade without confirmations. Wait for them before creating a trade. Be disciplined, patient, and emotionally controlled. Only trade the highest probability setups with the greatest risk to reward ratio. This will ensure that you become a long-term profitable professional trader.
Don't be a gambler. Don't try to get rich quick. Make sure that your trading is professionally based on proper strategies and trade tactics.

BITCOIN Free Signal! Sell!
Hello,Traders!
BITCOIN Smart Money shows reaction from a key supply zone where liquidity was engineered above equal highs. Price is likely to deliver downside targeting sell-side liquidity.
---------------------
Stop Loss: 104,822$
Take Profit: 102,778$
Entry Level: 103,763$
Time Frame: 2H
---------------------
Sell!
Comment and subscribe to help us grow!
Check out other forecasts below too!
Disclosure: I am part of Trade Nation's Influencer program and receive a monthly fee for using their TradingView charts in my analysis.

Bitcoin At Make-or-Break Zone – Long Setup Ahead?Bitcoin ( BINANCE:BTCUSDT ) is currently moving near a Heavy Support zone($111,980-$105,820) , Support lines , Potential Reversal Zone(PRZ) , and Cumulative Long Liquidation Leverage($106,432-$104,513) .
From an Elliott Wave perspective , it seems that Bitcoin might be completing the microwave 5 of the main wave C .
As long as Bitcoin does not break below that Heavy Support zone($111,980-$105,820) , we can still be hopeful about long positions . There's a chance of a fake break of the support lines, and then Bitcoin might bounce back from the PRZ and start rising again.
I expect that after touching the PRZ , Bitcoin could rise back up and move toward the Resistance zone($110,700-$109,380) .
Note: If the support lines break with high momentum, please do not enter a long position.
Cumulative Short Liquidation Leverage: $113,085-$111,444
Stop Loss: $104,420
Please respect each other's ideas and express them politely if you agree or disagree.
Bitcoin Analysis (BTCUSDT), 1-hour time frame.
Be sure to follow the updated ideas.
Do not forget to put a Stop loss for your positions (For every position you want to open).
Please follow your strategy and updates; this is just my Idea, and I will gladly see your ideas in this post.
Please do not forget the ✅' like '✅ button 🙏😊 & Share it with your friends; thanks, and Trade safe.

TradeCityPro | Bitcoin Daily Analysis #212👋 Welcome to TradeCity Pro!
Let’s dive into the Bitcoin analysis. The market has entered a corrective phase and is preparing for the next wave of movement.
⏳ 1-Hour Timeframe
On the 1-hour timeframe, Bitcoin started correcting after reaching the support at 100,308 and has now retraced to the 0.382 Fibonacci level.
📊 Market volume significantly increased around the 100,308 support, indicating that this zone is very sensitive and important, with price reacting to it.
✨ Currently, volume has decreased slightly, and the price is in a corrective phase. If this correction continues, the next resistance zones will be at the 0.5 and 0.618 Fibonacci levels.
⭐ However, if the price continues its downward movement, we can open a position with a candlestick setup when the volume increases towards 100,308, or wait for the break of the 100,308 support to open a position.
✅ For a long position, if buying volume increases, the break of the 0.382 Fibonacci level would be a good trigger for a long entry.
❌ Disclaimer ❌
Trading futures is highly risky and dangerous. If you're not an expert, these triggers may not be suitable for you. You should first learn risk and capital management. You can also use the educational content from this channel.
Finally, these triggers reflect my personal opinions on price action, and the market may move completely against this analysis. So, do your own research before opening any position.

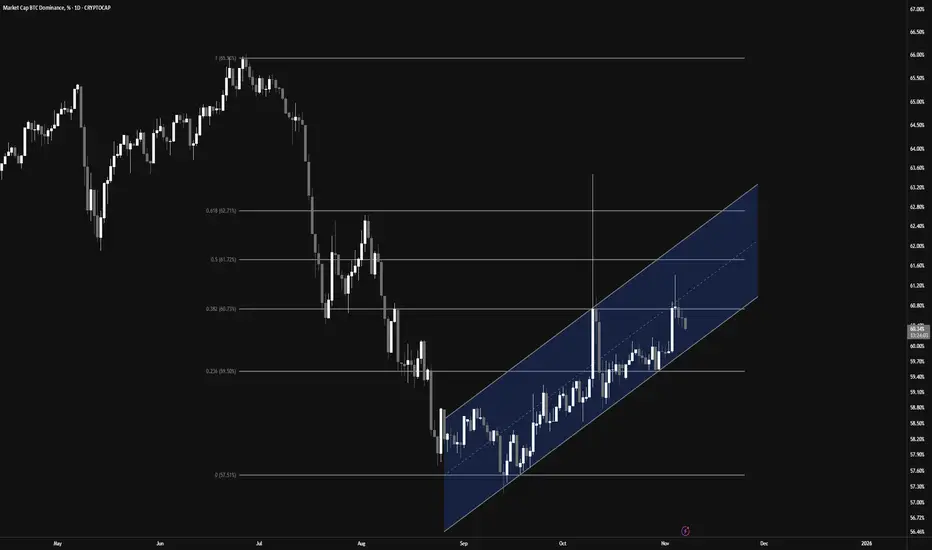
Bitcoin Dominance Rejection and Altcoin Pump👋🏻 Hey everyone! Hope you’re doing great! Welcome to SatoshiFrame channel.
✨ Today we’re diving into the 1-Day Bitcoin Dominance analysis. Stay tuned and follow along!
👀 On the daily timeframe, Bitcoin dominance has reached a key resistance zone at 60.73%. If this level breaks, we could see a deeper correction across altcoins. However, a rejection and move downward could trigger a strong rally for altcoins. As Bitcoin’s market weight decreases and capital flows into altcoins, we might be entering an early altseason, presenting potential profit opportunities.
🕯 From a technical perspective, Bitcoin dominance is moving within a well-structured ascending channel. The midline of the channel acts as a solid rejection point. A Fibonacci retracement from the previous downtrend shows a 38% overlap with this midline — a tough level to break. After a strong bearish candle rejection from that area, dominance is now heading lower. If the move continues, we could see a test of the channel’s lower boundary, and a confirmed breakdown would strengthen the altcoin bullish scenario.
💰 Typically, capital rotation in crypto follows this pattern: money flows into Bitcoin, then Ethereum, then the top 10 coins, and finally into smaller altcoins — before converting to USDT and exiting the market. With Bitcoin dominance currently at high levels after a solid Bitcoin season, this could signal the early stages of capital shifting toward altcoins. Traders should watch closely for these shifts to maximize profitability.
❤️ Disclaimer : This analysis is purely based on my personal opinion and I only trade if the stated triggers are activated .
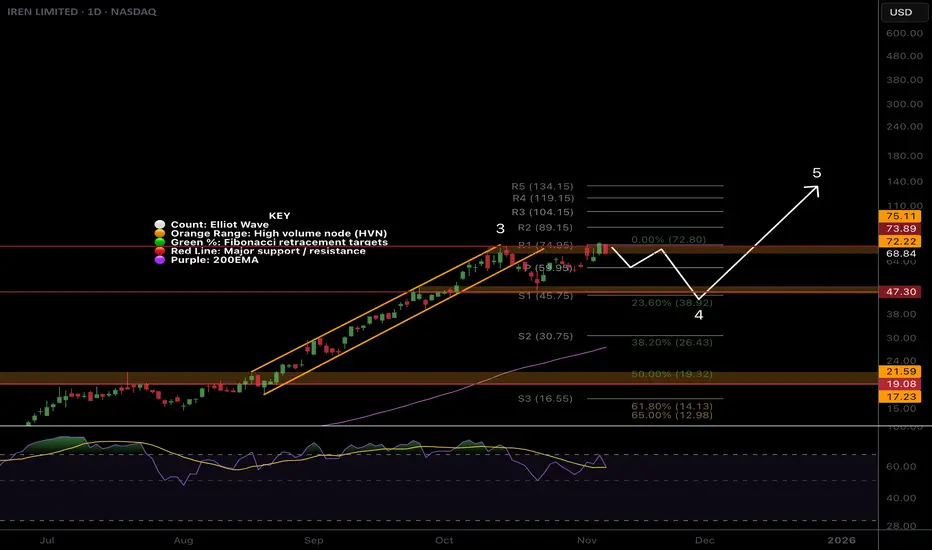
IREN pullback on the cardsNASDAQ:IREN is breaking out again on huge candle spread, though I am skeptical of continued rally from here without a pullback first. For now the trend is up.
Price has broken out of its momentum channel and formed a range so I am expecting the excitement to trap late comers and traders with a swift reversal in wave 4. Initial downside target is $47 at the High Volume Node and .0236 Fibonacci retracemenet. Stronger downside momentum could test the rising daily 200EMA at the 0.382 Fibs.
Daily RSI has printed unconfirmed bullish divergence at the EQ.
Continued upside keeps us looking at the pivot targets.
Stop!Loss|Market View: BTCUSD🙌 Stop!Loss team welcomes you❗️
In this post, we're going to talk about the near-term outlook for the BTCUSD ☝️
Potential trade setup:
🔔Entry level: 105019.48
💰TP: 110424.25
⛔️SL: 102201.32
"Market View" - a brief analysis of trading instruments, covering the most important aspects of the FOREX market.
👇 In the comments 👇 you can type the trading instrument you'd like to analyze, and we'll talk about it in our next posts.
💬 Description: The global prospects for a decline to 90000 are lingering, but for now, unless the price pushes toward 100000, the decline will have to wait a bit longer. The most likely scenario now is a price move toward 104000, where a breakout toward 110000 is expected. Near this resistance, not only are technical factors stopping the price but also a accumulation of selling liquidations, so the price will likely drift toward this area in the short-term.
Thanks for your support 🚀
Profits for all ✅
❗️ Updates on this idea can be found below 👇
