TradeCityPro | Bitcoin Daily Analysis #238👋 Welcome to TradeCity Pro!
Let’s move on to today’s Bitcoin analysis. The market is currently in a correction phase after the bearish leg it experienced yesterday.
⏳ 1-Hour Timeframe
After the drop Bitcoin made, even fake-breaking the 85,220 level,
✔️ the price has started its correction, reaching up to 87,088.
🔔 During this correction, a Head & Shoulders pattern has formed, with the activation trigger being the 87,088 level.
💥 If this pattern gets activated, deeper corrections could follow.
The next resistance zone to watch is 89,082.
📊 Market volume has increased with the start of the new week, but during this correction, the volume is decreasing. This indicates that the downtrend still holds strength, and the likelihood of the trend continuing remains high.
💡 In this case, we can open a short position either after a fakeout at 89,082 or by confirming a Dow Theory breakdown.
The main short trigger right now is the 85,220 level.
📈 For a long position, breaking 89,082 is a risky trigger.
Personally, I prefer to wait for more confirmation before deciding to enter a long position on Bitcoin.
❌ Disclaimer ❌
Trading futures is highly risky and dangerous. If you're not an expert, these triggers may not be suitable for you. You should first learn risk and capital management. You can also use the educational content from this channel.
Finally, these triggers reflect my personal opinions on price action, and the market may move completely against this analysis. So, do your own research before opening any position.
Bitcoin (Cryptocurrency)

a QuickScalp on #GBPUSD📌 Market Insight: {#GBPUSD }
⚠️ Risk Assessment: {High}
🚀 Approach:
Same as UJ , Not a perfect setup ... need valid LTF entry sign first .
No rush .
Just for QuickScalp
#Ash_TheTrader #Forex #GBPJPY #MarketAnalysis #TradingSetup #RiskManagement #GOLD #Scalper #NQ #EURUSD

EURUSD: descending channel🛠 Technical Analysis: On the 4-hour timeframe, EURUSD is clearly moving within a descending channel, with price currently testing a major confluence of resistance. This resistance cluster is formed by the channel's upper trendline, the 100 and 200 SMAs, and a horizontal static zone around 1.1607. The "Global bearish signal" (Death Cross) identified earlier remains valid, reinforcing the downtrend. The projected trade anticipates a rejection from this heavy resistance, pushing the price back down toward the lower support zones, with an ultimate target near the channel's bottom at 1.1380.
🌍 Fundamental Analysis: Market liquidity is thin today in the wake of the US Thanksgiving holiday, which can lead to unpredictable or muted price action. Focus is shifting to next week's high-impact data, including Eurozone 'Flash' Inflation (Dec 2) and the crucial US Non-Farm Payrolls report (Dec 7). These releases will be vital in shaping the market's expectations for future ECB and Federal Reserve interest rate decisions, directly impacting the EURUSD exchange rate.
❗️ Trade Parameters (SELL) ❗️
➡️ Entry Point: Sell on rejection from the resistance zone (approx. 1.1600 – 1.1630)
🎯 Take Profit: 1.1468, medium-term target at 1.1380
🔴 Stop Loss: Above the resistance structure (approx. 1.1671)
⚠️ Disclaimer: This is a potential trade idea based on current analysis; market conditions and price direction are subject to change based on news factors and volatility.

BTCUSD: Bearish Sequnce Not Finished,Unless It Breaks 100kA lot of traders are wondering when Bitcoin will complete the pullback from the highs, but if we are really in a higher-degree retracement then keep in mind that the big pullbacks on Bitcoin usually lasted around 12 months, and right now we are only one and a half months away from the recent highs. That’s the first thing. The second thing, and the most important for me, is always the Elliott wave structure itself. I simply cannot ignore it, because it helps me identify the key levels that must be broken before we can confidently look for a turning point.
If you look closely at the price drop from the 116515 level, you can clearly see that this is a strong decline without a completed five-wave sequence yet. So even if we assume this is wave C rather than wave four, it still has to be structured by five waves. That means the current rebound from the 80k zone could easily be just a fourth wave, maybe stopping around 90k, which is an important swing level for this week.
Based on Elliott waves and price action, this weakness can still resume. The key level for a bullish turn is very clear: a push back above 99k, or better said 100k, which is a strong psychological pivot. Below it we stay in bearish mode with risk for one more drop.

EURJPY consolidating.EURJPY has been moving in a Range. Waiting for confirmation for a drop Back Down before or while getting into the London session.

A Pullback Cannot Hide a Weakening TrendHello everyone, it’s Domic here ✌️
Looking at Bitcoin’s recent price action, you can probably feel that the latest drop wasn’t a random fall. The market completely broke through a multi-day equilibrium zone, and the moment BTC was repeatedly rejected at the EMA 89 and then lost the EMA 34, the balance of power shifted clearly toward the sellers.
Interestingly, right after that sharp breakdown, BTC bounced into a short-term pullback. This doesn’t signal a trend reversal; it’s simply the market’s natural reaction after falling too quickly: profit-taking from sellers, short-covering, and weak dip-buying flows creating a technical rebound — enough to rebalance the market, but not enough to change direction.
From a macro perspective, the signals are fairly aligned: US bond yields have risen again, the DXY has bounced from the 99 area, ETF inflows have weakened, and defensive sentiment ahead of upcoming US labour data has caused demand to dry up almost entirely. Crypto is simply being dragged along with the broader risk-off environment.
From a technical angle, BTC is trading below both the EMA 34 and EMA 89 — two downward-sloping moving averages indicating the trend remains bearish. The 4H breakdown accompanied by strong volume shows this is a real sell-off. BTC is currently pulling back to retest the resistance levels: 88,700–89,000 at the EMA 34 and 90,400–90,600 at the EMA 89. These zones will reveal whether selling pressure still dominates.
If sellers return aggressively, BTC may continue heading toward lower support regions: 85,500–86,000 is the first key area, followed by 83,000–84,000 — a demand zone that previously generated a strong bullish reaction. With the current momentum, the scenario where BTC at least touches the 85,500–86,000 support is becoming increasingly likely.
Which direction do you think the market is leaning toward? Feel free to share your perspective — and wishing everyone successful trading!
Crypto Winter 2026: BTC 75% Correction PT 30 000 USDInvestment Memo: Anticipating a 2026 Bitcoin Crypto Winter
By ProjectSyndicate
________________________________________
1. Executive Summary
❄️ Summary view: This memo treats 2026 as the high-probability crypto winter year for Bitcoin following the 2024 halving, with a working top around 123,000 USD and an expected cycle low near 30,000 USD, implying roughly a 75–76% drawdown from the peak. This is fully consistent with historical Bitcoin bear markets, which have typically seen 75–85% corrections from all-time highs.
❄️ Contrarian hook: While mainstream narratives still focus on ETFs, institutional adoption, and “crypto as macro asset,” the explosion of leverage (Aster DEX up to 1001x), CZ-backed perps, and BNB-chain meme-coin mania are treated here as late-cycle excess—classic topping signals rather than sustainable foundations.
________________________________________
2. Thesis & Target Range
📊 Cycle top assumption: cycle high of ~123,000 USD per BTC. That is well within the band implied by recent ATH prints ~125–126k in mid-2025 and aligns with a typical “blow-off” overshoot above the prior psychological milestone at 100k.
📊 Cycle low assumption: 30,000 USD downside target represents a drawdown of ~75.6% from 123,000 USD—slightly shallower than the 2018 crash (~84%) and broadly in line with the 2021–22 bear (~77% from 69k to ~15–16k). That keeps this winter brutal but not apocalyptic, consistent with a maturing asset still capable of deep mean reversion.
🧮 Math check on prior winters
• 2017–18: 19k → 3k ≈ 84% drawdown
• 2021–22: 69k → 16k ≈ 77% drawdown
• 2025–26 (your base case): 123k → 30k ≈ 76% drawdown
This places scenario squarely inside the historical corridor of 75–85% post-peak corrections.
________________________________________
3. Historical Pattern: Why Large Drawdowns Are the Base Case
📉 Structural volatility: Bitcoin’s entire price history is punctuated by massive post-parabolic drawdowns—early cycles saw 86–93% collapses, later ones 75–80%. Each halving-to-peak run has ended in a violent crash once marginal buyers are exhausted and leverage saturates.
📉 Time dimension: Historically, the “winter” phase has lasted 9–18 months from peak to capitulation and then a long grinding accumulation. The 2017 peak to 2018–19 bottom spanned roughly a year; the 2021 peak to 2022–23 nadir similarly took about a year, with a further period of sideways chop.
📉 Drawdown normalization: Traditional asset allocators increasingly frame Bitcoin as an alternative macro asset, but the statistical reality is unchanged: drawdowns of 70%+ are not outliers—they are typical. An assumption of only shallow corrections is the non-consensus view; a 75% winter is actually the boringly normal scenario from a historical distribution standpoint.
________________________________________
4. Where We Are in the Current Cycle
⏳ Post-halving positioning: The fourth Bitcoin halving occurred in April 2024, cutting block rewards to 3.125 BTC and effectively tightening supply. Historically, the major blow-off tops occur 12–18 months after halving, as reduced supply + narrative momentum pulls in late-stage retail and leverage.
⏳ Evidence of late-cycle behavior: By mid-2025, Bitcoin had already pushed to new ATHs above 100k and then into the ~120–126k region, with growing signs of ETF saturation, institutional FOMO, and leverage-driven upside. From a purely cyclical lens, we are more likely in the “euphoria / distribution” band than in early bull territory.
________________________________________
5. Aster DEX & Meme-Coin Mania as Contrarian Top Signals
🚨 Aster DEX as the “Hyperliquid of BNB Chain”: Aster DEX, emerging from APX Finance and Astherus and explicitly leveraging Binance’s network, is marketed as a high-performance perp DEX with MEV-resistant trading and leverage up to 1001x, backed by CZ/affiliate ventures. From a contrarian perspective, this is textbook late-cycle: maximum leverage offered to the broadest possible audience at or near cycle highs.
🚨 BNB meme-coin carnival: Simultaneously, BNB-chain meme coins and speculative listings (Maxi Doge, PEPENODE, various new BNB meme projects) are being pushed as high-beta “next 100x” plays. Historically, similar episodes—2017 ICOs, 2021 dog-coin and NFT mania—have coincided with or slightly lagged Bitcoin’s macro top rather than signal early-cycle value.
🎭 Narrative pattern recognition: In prior cycles, the market’s center of gravity shifted from Bitcoin to highly speculative edges (ICOs, NFTs, obscure DeFi, meme coins) at the very end of the bull. Late-cycle liquidity rotates into lottery tickets while BTC quietly transitions from “must own” to “source of funds.” The current Aster + BNB meme complex rhymes strongly with that historical script.
________________________________________
6. Why a 75% Drawdown to 30,000 USD is Plausible
🧊 From 123k to 30k mechanically: A move from 123k to 30k doesn’t require structural failure; it merely requires a reversion to historical drawdown. That kind of move can be achieved by:
• ETF inflows slowing or turning to mild outflows
• Derivatives funding turning negative as carry trades unwind
• A moderate macro risk-off (equities correction, higher real yields)
🧊 Maturing, not invincible: As adoption broadens—spot ETFs, institutional mandates, integration into macro portfolios—Bitcoin’s upside may gradually compress, but liquidity cycles and leverage cycles haven’t vanished. Even if each cycle’s drawdown edges slightly lower from ~85% to ~77%, there’s no reason to assume sub-50% drawdowns are the new regime. A respectable winter at 30k is almost conservative relative to earlier -80%+ events.
________________________________________
7. Why the Floor Might Hold Above Prior Lows
🛡️ On-chain + macro floor logic: Without pinning to proprietary on-chain models, two simple supports for a 30k floor are:
• Institutional cost basis: A growing chunk of supply is held via ETFs and treasuries accumulated in the 40–70k band. Many of these players may defend positions with hedging or incremental buying in the high-20k / low-30k region rather than panic-sell at -70–80%.
• Realized price ratcheting higher: Across cycles, Bitcoin’s long-term realized price average on-chain cost basis tends to step up structurally. Past winters have bottomed not far below that long-term average; as the realized base rises, so does the likely bear-market floor.
🛡️ Regime shift vs. previous cycles: In 2018 and 2022, Bitcoin was still climbing the wall of institutional skepticism. By the mid-2020s, you have:
• Spot ETFs
• Corporate treasuries
• Sovereign/FI experimentation
These players typically do not capitulate to zero; they reduce risk, but they also accumulate in stress. That supports the idea of a shallower floor (30k) instead of a full 85–90% purge.
________________________________________
8. Timing the 2026 Winter
🧭 Halving + 18-month lag template: Using the standard halving cycle template, major tops often occur 12–18 months post-halving, and winters then dominate the following year. With the fourth halving in April 2024, a 2025 ATH and a 2026 winter are exactly what the simple cycle model would project.
🧭 Scenario sketch
• 2025: Distribution at elevated levels (80–120k+), persistent Bitcoin as digital gold narrative, alt & meme blow-off, over-issuance of high-leverage products (Aster, other perps).
• 2026: Liquidity withdrawal + ETF fatigue + regulatory flare-ups → a stair-step decline through 80k, 60k, 45k, culminating in capitulation wicks into the 30–35k zone before a multi-month bottoming process.
________________________________________
9. Market Structure Stress Points in a Winter Scenario
🧱 Leverage cascade risk: Perp DEXs offering hundreds to 1000x leverage attract the most price-insensitive flow at the worst time. When BTC breaks key levels (e.g., 80k → 60k → 50k), auto-deleveraging and forced liquidations can accelerate downside far beyond spot selling. Aster-style platforms, while innovative, mechanically create risk of cascading liquidations in a volatility spike.
🧱 Alt & meme vaporization: BNB meme coins and other speculative assets that rode the late-cycle pump will likely see 90–99% drawdowns, as in previous winters where smaller alts dramatically underperformed BTC. In your framework, BTC at 30k is actually the “high-quality survivor” outcome; the majority of late-cycle tokens may never reclaim their peaks.
🧱 Mining and infrastructure: With halved rewards and a much lower BTC price, marginal miners will be forced offline, just as in prior winters. That tends to deepen the short-term pain but ultimately improves the cost curve (strong miners consolidate, inefficient ones exit), laying groundwork for the next cycle.
________________________________________

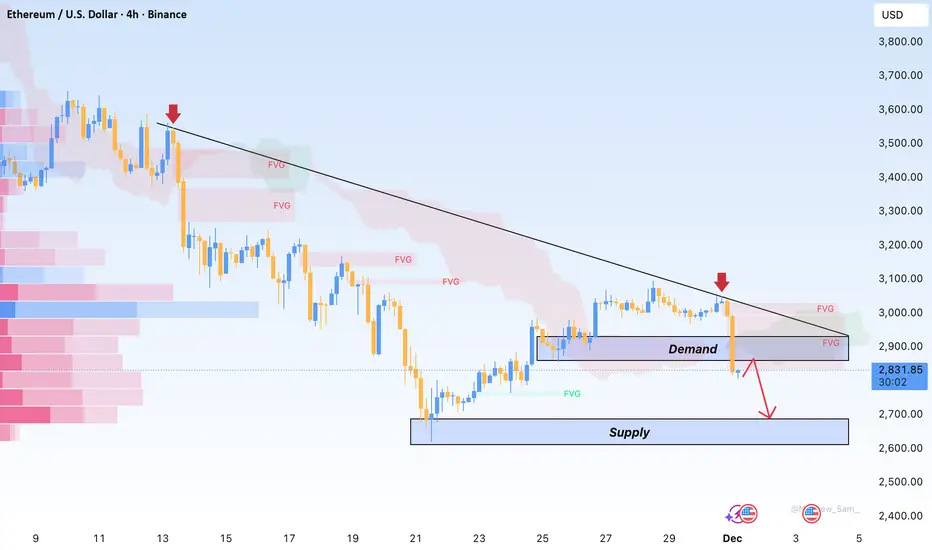
ETH Faces Heavy Rejection, Downside Risk IntensifiesETH printed a strong 4H bearish candle as soon as price retested the 3,030–3,100 supply zone, confirming that sellers still dominate this area. The sequence of lower highs remains intact, and the sharp break below 2,900 with increased volume signals a genuine sell-off rather than a routine shakeout.
Price is currently hovering around the 2,820–2,850 support, but buying interest is weak. The 2,750–2,780 pocket carries deeper liquidity and is a more realistic area for the market to stabilise if downward momentum continues.
Macro conditions also lean bearish: US yields are climbing, expectations for prolonged high rates from the Fed persist, regulatory pressure from the SEC remains, and whale flows to exchanges add further weight on crypto sentiment.
My view: ETH is more likely to slide toward 2,750–2,780 before any meaningful recovery. Only a 4H close above 3,030 would provide early signs of a short-term reversal.
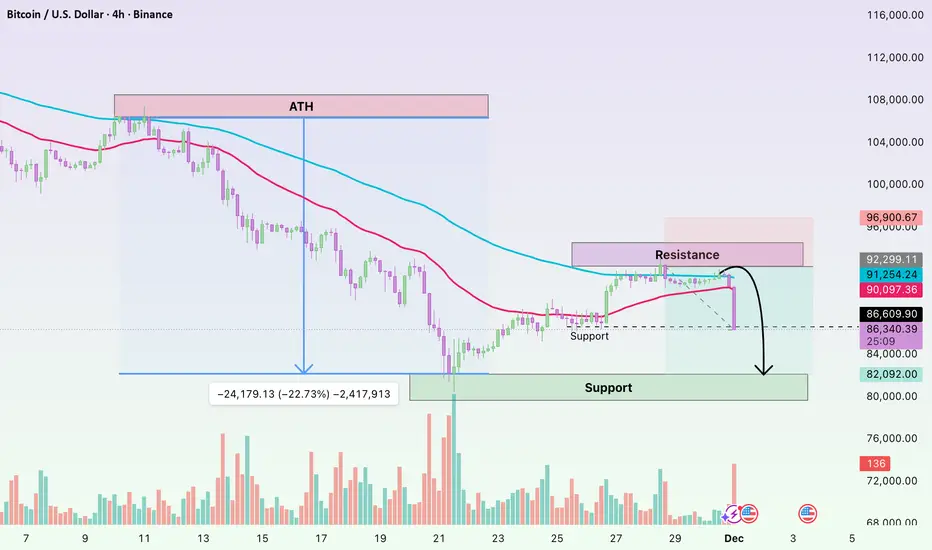
Bitcoin at a Critical Threshold – Retest or Breakout?Hello everyone 👋, I’m Domic. Today, let’s analyse BINANCE:BTCUSD together!
Bitcoin recently experienced a sharp drop from 91,000 down to 86,500 USD on the 4H chart, accompanied by heavy volume, clearly reflecting a “liquidity sweep” after several sideways sessions. Prior to this decline, Bitcoin had been oscillating above the EMA 34 (red) and EMA 89 (blue), indicating that a recovery was already beginning to form. However, the flush pierced through the EMA 34, pushing price close to the EMA 89—the moving average reflecting the long-term trend—showing that selling pressure came from mass stop-losses and whale liquidations.
The 86,000–86,500 zone now serves as strong support , coinciding with the recent low and EMA 89. How price reacts around this area will determine the next move: a retest of 89,000–90,000 awaits resistance at the EMA 34, while any break below would extend the decline toward 83,500 or even down to 80,000—where liquidity is concentrated from previous lows.
The crypto market is currently heavily influenced by US economic data: rising bond yields, the Fed’s cautious stance on inflation, and reports such as PMI, ADP, and core PCE. Additionally, pressure from the SEC and BTC movements from whale wallets to exchanges have reinforced the recent drop.
Why I Lean Bearish:
The recent drop was unusually strong, completely breaking EMA 34 and sweeping down to EMA 89—a clear sign of smart money hunting stop-losses. Selling volume increased sharply and was concentrated, suggesting large orders rather than retail activity. EMA 34 is starting to bend downwards, signalling that the rebound momentum is weakening.
The market is also facing negative pressures from:
Rising US bond yields
Concerns that the Fed may keep rates high for longer
Negative news from the SEC
Whales transferring BTC to exchanges (a potential prelude to selling)
👉 Forecast: Given these factors, I anticipate that BTC may initially struggle to reclaim 89,000–90,000 and could retest the lower support at 86,000–86,500. A decisive break below this zone would likely extend the decline toward 83,500 or even 80,000. Observing price action around EMA 89 is crucial before considering any long positions.
At present, BTC stands at a zone of “high risk but high opportunity”: a short-term low around EMA 89 will confirm a potential rebound, while a break below this area would open the way for a more pronounced decline. This is a moment to observe and wait for signals rather than rushing to catch the bottom.
Wishing everyone successful trades and continued discipline!
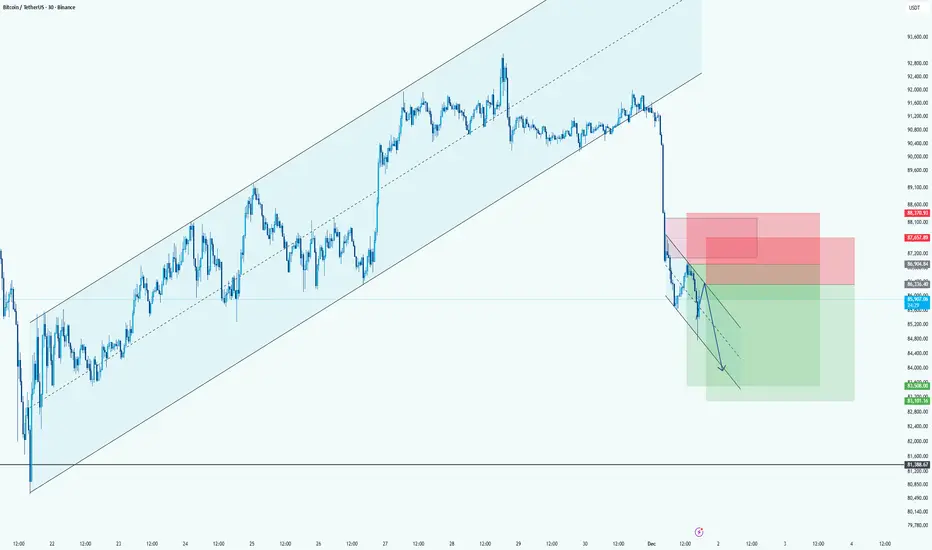
BTC: Bearish Continuation Setup After Major Channel BreakdownHi!
Price broke hard below the long-term ascending channel, confirming a clear shift from bullish to bearish momentum.
After the breakdown, BTC is moving in a small descending correction channel, creating a classic lower-high retracement toward supply.
Direction: Short
Entry Area: 87,200 – 88,300 (two stacked red zones)
Stop-Loss: Above 88,700–89,000 (top of supply)
Target: 83,000 – 84,800 (large green demand area)
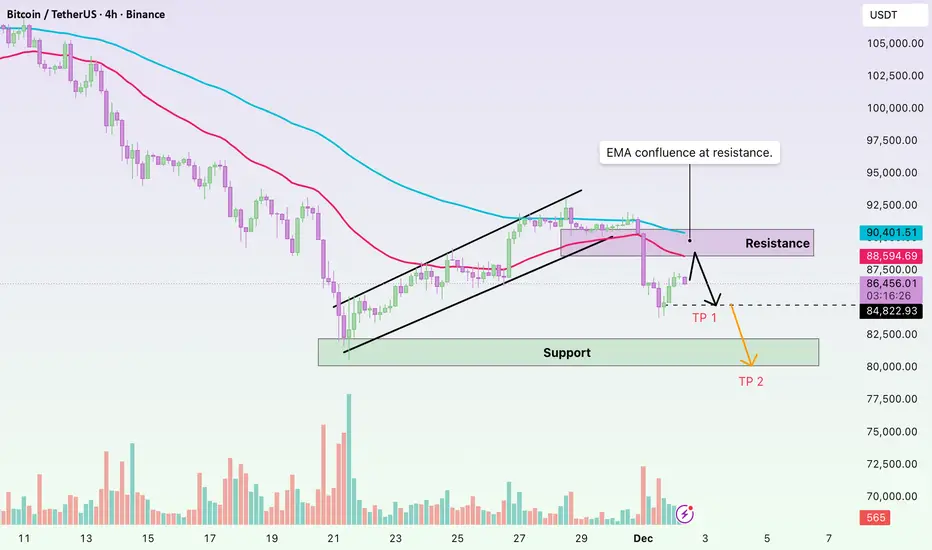
BTCUSDT.P - December 2, 2025Bitcoin remains in a broader downtrend but is currently consolidating between resistance around 87,400–87,700 and support near 83,400. The chart outlines a potential breakout toward 91,375 if price can reclaim and hold above the consolidation range, with that level marked as the primary profit target. Conversely, a failure at resistance and a break below 83,400 would confirm renewed bearish momentum toward the lower profit zone around 80,000. Trend structure is neutral-short term within this range, and a decisive move outside the highlighted consolidation band is needed to confirm the next directional leg.

The MicroStrategy Bitcoin Bottom!Today MicroStrategy formed a beautiful daily chart bottoming tail on extreme volume.
Its truly a picture perfect reversal signal.
This reversal came on the back of BTC being very weak and still down 5% at market close.
Michael Saylor announced an addition of a 130BTC purchase, but also has set aside a billion dollar expense fund if he needed to sell some BTC.
The likely hood of MSTR having to sell BTC is very unlikely.
We traded MSTR today for a lovely gain. Riding 180 calls to the upside.

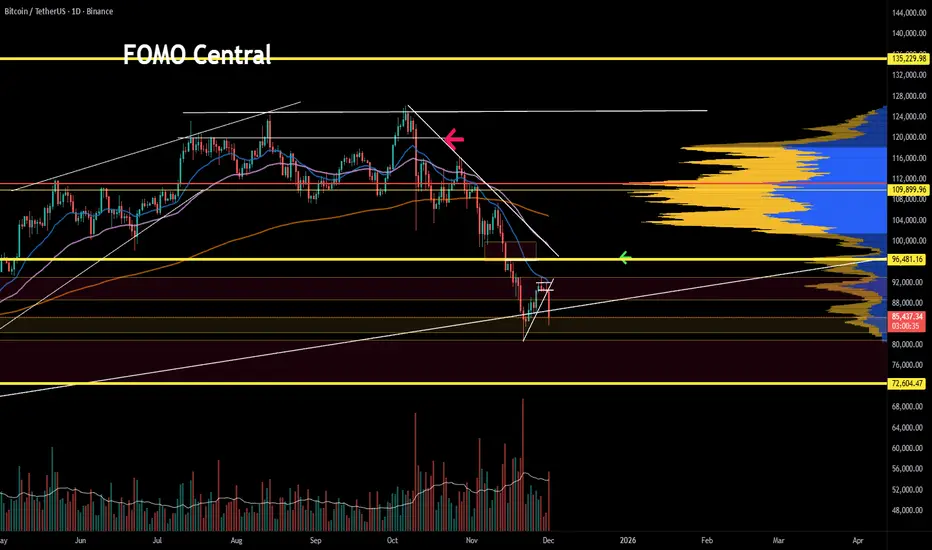
Bitcoin still in reactive phaseBitcoin’s relief bounce stalled right at the descending trendline, and the move up couldn’t break through the mid-96k supply zone. Momentum is cooling off again, and volume isn’t supporting a breakout.
Unless price can reclaim that trendline with conviction, the chart still leans corrective. Key areas to watch on the downside remain the mid-80k zone, with stronger support lower in the 70s where demand and volume profile stack up.
For now, BTC is still in a reactive phase. Bulls need a clean close above resistance to shift the structure. Until that happens, caution makes sense.
USDCAD outcome!USDCAD moving up in the second half of the NY session. 2 possible outcomes in the Asian and London session. Bounce off TrendLine or Continue to RESISTANCE.

$BTC, $77.5K Target Before Retracement/Bull Run, LONG HoldBitcoin has the potential to drop as much as up to $77.5K as shown by the PnL and patterns setup. That said, holding and getting the dip or doing a short bet depends on your risk tolerance. As currently, I am very bullish on Bitcoin's long-term setup ignoring the in-between noise. As always, none of this is investment or financial advice. Please do your own due diligence and research.

Bitcoin - The only 100% probability setup!🔪Bitcoin ( CRYPTO:BTCUSD ) will drop -40% very soon:
🔎Analysis summary:
If we just take a look at previous cycles, Bitcoin is already starting a major -40% correction. If we then also take market structure and price action into account, this becomes a 100% probability setup. The next clear crypto bearmarket is starting right now.
📝Levels to watch:
$100,000
SwingTraderPhil
SwingTrading.Simplified. | Investing.Simplified. | #LONGTERMVISION

Bitcoin Just Broke Its Weekly Channel🔥 Bitcoin Just Broke Its Weekly Channel — And Even Pulled Back to the Bottom! 🔥
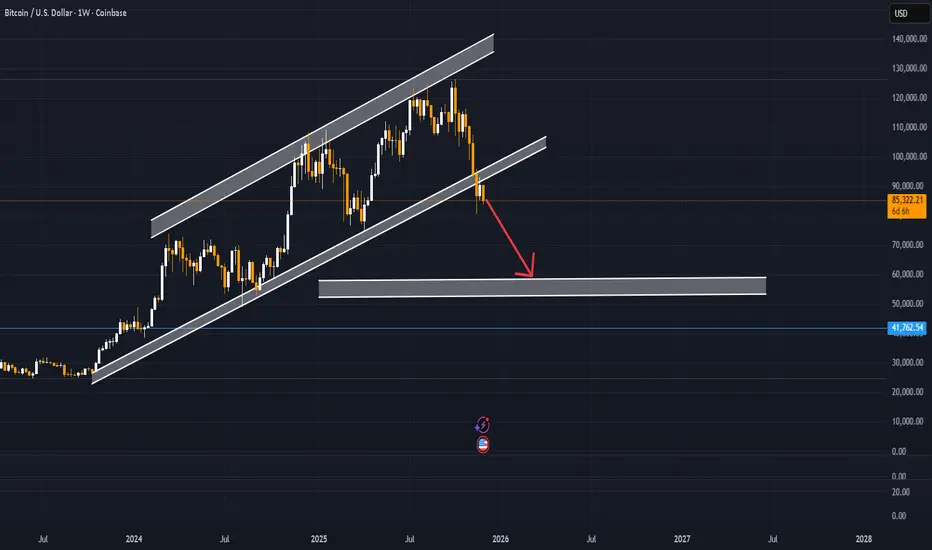
BTCUSD | Rejected Posted this idea few days ago and worked out a bit to well maybe :).
We are still in a downtrend so that's the reasoning behind the short idea from the red zone.
looking forward to see what happens at the 81.500 level.
What are your insights on Bitcoin?
Stay safe out there and do your own due diligence, this is not investment advise!

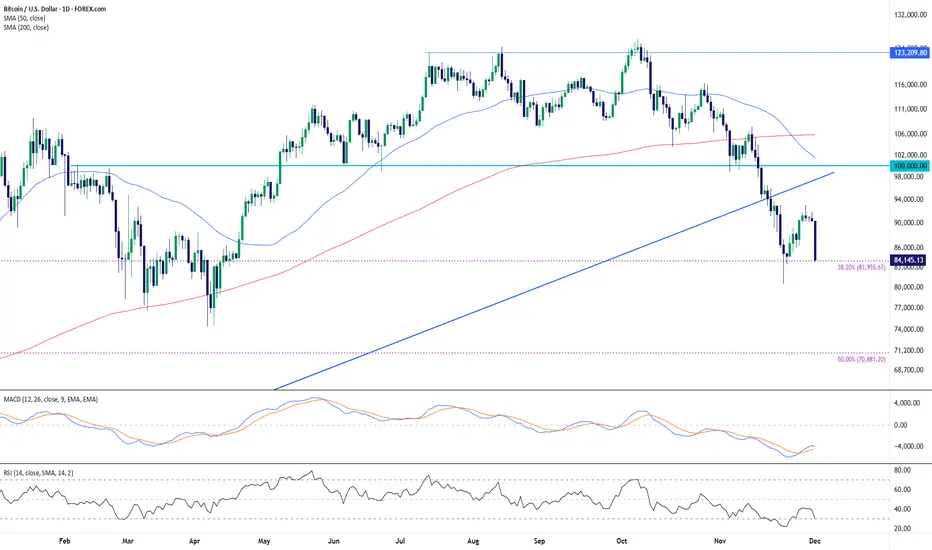
Bitcoin Extends Decline Toward Fibonacci Support as Momentum RemBitcoin continues to trade under clear downside pressure after breaking beneath its long-standing ascending trendline in November. The recent rebound attempt stalled near the underside of that same trendline—now acting as dynamic resistance—and price has since rotated lower again.
The broader structure shifted bearish once price fell below the 50-day SMA and 200-day SMA, both of which are now flattening or turning lower. This places the market in a momentum-cooling environment where sellers remain in control unless a sustained recovery develops above key moving averages.
The chart also highlights confluence around the 38.2% Fibonacci retracement level drawn from the major swing low, which sits near the latest reaction zone. The initial bounce from this area shows that participants are aware of the level, though the follow-through remains limited for now.
Momentum indicators reflect persistent weakness. The MACD remains in negative territory, with both signal lines tracking below zero and only modest signs of stabilization. RSI recently dipped into the 30-zone before attempting to lift, indicating oversold conditions were tested but broader momentum has not convincingly recovered.
Overall, the chart continues to lean bearish as long as the market holds below the broken trendline and the major moving averages. Price behavior around the Fibonacci region will be an important gauge of whether this decline matures into a deeper corrective phase or begins to base out.
-MW
Ethereum (ETH) Rejected from $3K — Key Support AheadETH recently got rejected at the critical $3,000 resistance, a psychological and technical level that’s held firm amidst broader market volatility. However, bulls shouldn’t panic just yet — Ethereum is now approaching a major support zone between $2,640 and $2,770, where it has previously found strong buying interest. If macro conditions stabilize, momentum could return quickly from this level.
💡 Trade Setup
Entry Zone: $2,640 – $2,770
Take Profit Targets: $3,370 and $4,000
Stop Loss: $2,187
This setup offers a strong risk-reward profile, especially if ETH rebounds as it has done historically from this zone. Watch for volume confirmation and potential bullish divergences on lower timeframes to time entries.

Bitcoin: Final Pump Before the Fall?Over the past five to six days, Bitcoin ( BINANCE:BTCUSDT ) has been attempting to recover from previous weekly declines, and it still appears to be in a corrective phase. This analysis builds on my previous idea, and if you’d like a deeper look at Bitcoin’s mid-term chart, you can check out the 4-hour timeframe in that previous analysis .
Now, a key point for Bitcoin traders is that, despite the recent rally in the S&P 500 ( SP:SPX ) over the past few days, Bitcoin hasn’t been able to keep pace. While it had a good correlation with the S&P 500 in the past, it didn’t experience a similar upward movement this time. Therefore, once the S&P 500 corrects, we may also see Bitcoin resume its downward trend.
Currently, Bitcoin seems to be near a resistance zone($92,200-$88,400) and Cumulative Short Liquidation Leverage($91,570-$89,660). It also appears to be forming an ascending channel over the past few days, indicating a corrective structure.
From an Elliott Wave perspective, Bitcoin seems to be completing microwave C of the microwave Y of the main wave 4, and we can expect this corrective phase to end soon, leading to another downward move. A break of the lower line of the ascending channel would confirm the end of this Wave 4.
I expect that after the Cumulative Short Liquidation Leverage($91,570-$89,660), Bitcoin will resume its decline and move towards the Support zone($86,200-$85,130).
Cumulative Long Liquidation Leverage: $86,000-$85,000
Cumulative Long Liquidation Leverage: $83,249-$81,840
Cumulative Long Liquidation Leverage: $80,263-$78,131
First Target: $86,290
Second Target: $83,800
Stop Loss(SL): $92,229
Points may shift as the market evolves
Note: At lower price levels, Bitcoin’s price includes several Cumulative Short Liquidation Leverages, each potentially causing further price drops. However, if the S&P 500 starts another correction, these levels may break more easily.
Note: Overall, trading in crypto has become a bit challenging lately, with less volatility, so it’s wise to be cautious and manage your capital carefully.
Note: If Bitcoin breaks through the resistance zone($92,200-$88,400) around $92,229, we can expect a renewed upward trend and hope for a bullish movement.
💡 Please respect each other's opinions and express agreement or disagreement politely.
📌Bitcoin Analysis (BTCUSDT), 1-hour time frame.
🛑 Always set a Stop Loss(SL) for every position you open.
✅ This is just my idea; I’d love to see your thoughts too!
🔥 If you find it helpful, please BOOST this post and share it with your friends.

BTC Weekly Update📊 BTC Weekly Update
Right now, BTC is testing an important support zone in blue 🔵.
If this support breaks down,
the next major support zone is around $65,000.
However, BTC could first stabilize near $71,000 before moving lower.
At the moment, BTC is more bearish than bullish —
there are no strong bullish signs on the higher timeframes.
As you already know:
when BTC drops, many altcoins dump even harder,
so if you're only holding, be careful.
But remember —
you can still make money in a shorting market.
As long as BTC does not break above $97,000,
I remain more bearish for now.

Understanding BTC, Bitcoin Dominance and TOTAL3 Rotations✅Bitcoin Dominance, BTC, Altcoins✅
Today, We're talking about the rotation of cash between Bitcoin and altcoins.
Imagine a pie where each slice represents a different cryptocurrency. The pie here indicates the total cryptocurrency market cap of both Bitcoin and altcoins, which can increase or decrease at any given time. In other words the TOTAL chart.
- If BTC market cap increases but altcoin market cap shrinks (relative), the pie stays the same size.
- If BTC market cap increase and altcoin market cap increases, the pie size increase and so forth.
Total Market Cap and BTC.D
At most of the key moments, we see a clear inverse relationship here. Alts drop harder than BTC, as this clearly shows. But during the cycle, investors hop on and off, injecting money into the ride (buying) and taking it out (selling). This constant movement is what keeps the crypto markets going.
Let's break it down with visuals:
Chart 1: Bitcoin
This rollercoaster represents Bitcoin's price action, and also my view on where we are in the current cycle. (I believe we're in a multimonth correction, followed by the last impulse wave up probably close to XMAS 2025 as usual). You'll need this to know where we are in the cycle right now:
Chart 2: Bitcoin & Bitcoin Dominance
This chart shows Bitcoin's dominance, which is basically its share of the total crypto market capitalization (market cap = total value of all cryptocurrencies). When Bitcoin's dominance goes up (higher on the chart), it means investors are putting more money into Bitcoin, potentially at the expense of altcoins. Conversely, when dominance goes down, it suggests capital is flowing towards altcoins. The difference is clear:
Chart 3: BTC.D vs TOTAL3
In this chart, we overlay the Total 3 Priceline (BLUE) on top of the Bitcoin Dominance chart. TOTAL3 shows us all alts except ETH.
The Bitcoin Rollercoaster and the S&P 500:
When Bitcoin surges (line goes up), it can sometimes lead to increased investor risk appetite. This might entice some investors to move funds from the S&P 500 into riskier assets like Bitcoin, potentially causing a slight dip in the S&P 500. Conversely, when Bitcoin experiences a price drop, investors might flock back to the perceived stability of the stock market, potentially causing a rise in the S&P 500.
So, is there a guaranteed CORRECTION? All the signs are proving this may be the case. By understanding the relationship between Bitcoin, altcoin prices and dominance, you can get a better sense of where the money merry-go-round might be headed.
