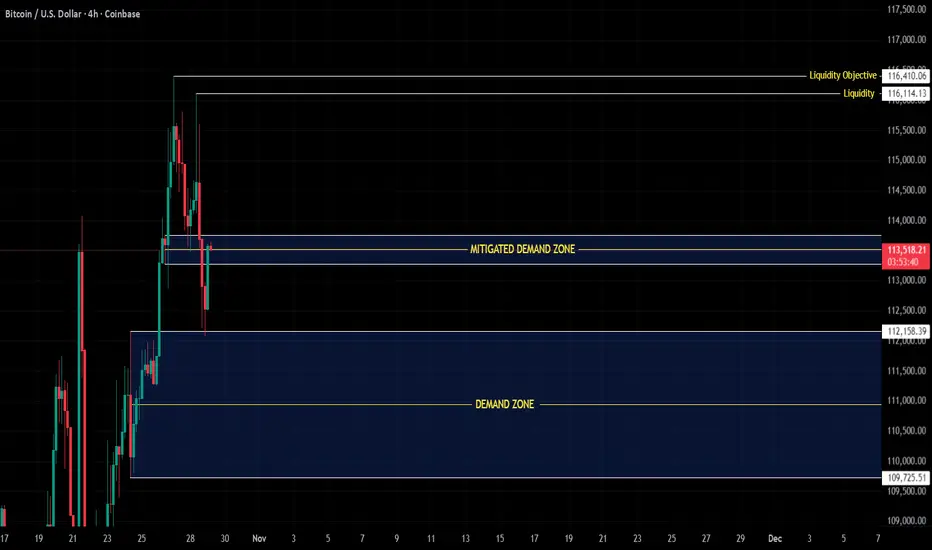
4H Structure Update-Demand Mitigated ,Next Liquidity in Sight
COINBASE:BTCUSD CRYPTO:BTCUSD BINANCE:BTCUSD KRAKEN:BTCUSD
$BTC/Price has reacted strongly from the deeper demand zone (112.15K – 109.70K), showing a clean bullish CHOCH followed by a confirmed BOS on the lower timeframes — signaling early structural alignment for potential continuation.
This reaction confirms mitigation, not reversal, as long as 109.70K remains protected.
Momentum and structure across micro and mid timeframes have now turned bullish, indicating renewed intent from buyers.
The next liquidity objective sits between 116.11K – 116.41K, where previous imbalance and resting liquidity align.
That zone also holds reversal potential, as price may face reaction or redistribution once it reaches those highs.
For now, this remains a healthy corrective phase within the bullish macro structure —
a controlled absorption and expansion sequence in play.
Structure first. Liquidity second.
Confirmation always. 💎
Bitcoin (Cryptocurrency)
Why I'm Suspicious Of This Bitcoin BounceThe rebound in bitcoin I warned about last week has come to fruition. Yet despite its recovery above the 200-day EMA, I remain bearish on the higher timeframes. Looking at bitcoin futures, I explain why I think bears are lurking above and may be happy to fade into rallies towards 120k.
Matt Simpson, Market Analyst at City Index and Forex.com

Bitcoin : Stay heavy on positionsBitcoin : Stay heavy on positions (3x)
Maintaining the same outlook as before.
** This analysis is based solely on the quantification of crowd psychology.
It does not incorporate price action, trading volume, or macroeconomic indicators.

ATCryptoScan: BTCUSD Waiting to spring into 2026 TOPSo, from previous posts... outcome comments in white. Self-explanatory, close enough, good enough.
Importantly, going forward...
1. wide range moves expected
2. 100K bounce in December, rally to Top
3. Top likely 160K in early Feb 2026
Technically, MACD is losing steam, but it price can be pumped. Weekly candlesticks have a bit of a bullish harami, so look out until Monday for a strong bounce to end the week bullish. Else, pushing down to 100K to make a sandwich stack candlestick.
Heads up yeah?
Short sharp and sweet...

Understanding Psychological LevelsDefinition:
In Trading, Psychological levels are often called round numbers or psy levels.
This is because the price ends in zeros and fives naturally attracting a trader’s attention.
Examples:
• Forex: 1.0000, 1.0500, 1.1000
• Stocks: $50, $100, $150, $200, $250
• Cryptocurrency: $10,000, $15,000, $20,000, $25,000
These levels are crucial as traders instinctively see targets in round numbers. (Or Incremental levels such as 5, 10, 15, 20, 25, 30 and so on...
This causes many buy, sell, and stop orders to cluster around the same price zones, creating self-reinforcing areas of interest in the market. Again, price sits at 113.2k – Psychological level is 115k.
___________________________________________________________________________________
Why Psychological Levels Matter in Trading
1) Human Bias:
Traders and investors often place orders at simple, rounded numbers. This makes their charts and order list “Clean.”
2) Institutional Targeting:
Large groups, whales or organizations use these levels to find liquidity or trigger stops. (Eg, BTC swept 125k before dumping)
3) Market Memory:
When a Psychological level reacts, traders remember it, and it often becomes relevant again in the future. (Turns into a prev liquidity sweep.)
5) Order Clustering:
Stop losses, take profits, and pending orders frequently build up around these areas. (As above, it builds liquidity.)
__________________________________________________________________________________
How to Identify Psychological Levels
Begin with marking clean, round (or quarterly) numbers on your chart. These are often major levels such as 4.0000, 5.0000, or 6.0000.
See the example below:
Then identify the midpoints/quarter points between them, like 4.5, 5.5, 6.5, 7.5, 8.5
See the example below:
For stronger assessments, look for psychological levels that align with other forms & tools of technical confluence—such as previous S & R, Supply/Demand, Highs & Lows, Fibonacci retracements, trendlines, or volume clusters.
See the example below:
When multiple forms of technical evidence converge near a round number, the level tends to have greater impact.
__________________________________________________________________________________
Trading Around Psychological Levels
When price approaches a psychological level, three common behaviors can occur:
1) Rejection:
Price touches the level and reverses quickly, suggesting strong defense by buyers or sellers. (Liquidity Sweep)
2) Break and Retest:
Price breaks through the level, then revisits it to confirm it as new support or resistance.
3) Compression or Grind:
Price consolidates near the level before a breakout as liquidity builds up.
Practical Application:
Enable alerts slightly before major psychological levels to observe reactions in real time (for example, 4.45 instead of 4.5 ). Wait for confirmation using price action such as a clear rejection wick, an engulfing candle, or a BOS (Break of Structure). Combine this analysis with liquidity or other forms of technical tools for a stronger assessment.
__________________________________________________________________________________
Trader Behavior at These Levels
Market reactions at psychological levels are largely directed by emotion and herd (Group) behavior. Fear of missing out can push price through a round number with momentum & speed while profit-taking can trigger short-term reversals & rejections. Stop hunts are also common, where smart money briefly pushes prices beyond a round level to collect liquidity before reversing. (From 4.0 up to 4.25 then down again)
Because many traders watch these same levels, reactions often repeat, reinforcing their significance.
__________________________________________________________________________________
Example: BTC/USD for $125k
When Bitcoin approaches $125k, many retail traders view it as a significant threshold. They might place short orders just below it or stop just above. Institutions recognize this and may intentionally push prices above $125k (sweeping $126k) to trigger those stops and fill large positions.
Once that liquidity is collected, price can reverse, and the $125k area may later serve as a new resistance zone.
This type of liquidity hunt and reversal pattern occurs frequently across all markets.
__________________________________________________________________________________
Practical Tips
1) Never trade purely based on a round number. Always wait for confirmation through structure or price action. (Retests, MSS, BOS, candle patterns etc)
2) Use alerts & alarms rather than fixed lines; prices often wick slightly above or below the exact level.
3) On higher timeframes, psychological levels often act as major turning zones. On lower timeframes, they tend to attract short-term reactions. (Lower the time frame, the more reactions = constant noise)
4) Combine psychological levels with liquidity, order flow, or volume analysis for a more complete view.
__________________________________________________________________________________
Summary
Psychological levels are where human reactions and liquidity meet. They represent areas of emotional and institutional/organizational interest rather than fixed points of reversal.
By understanding how traders behave around these zones and observing how price reacts to them, you can determine key movements with greater confidence.

$GOLD is COOKED! Rotation into $BTC Soon!!MARKETS ARE SIGNALING RISK-ON 🔥
TVC:GOLD is so unbelievably COOKED 👨🍳
3 Black Crowes printed on the Daily, with a decisive close below the 20MA 🗡️
Waiting on the final nail in the coffin to close below the DANGER ZONE ~$3,900 where we will then see GOLD retest the 50MA along with the 50% Gann retrace $~3,750 ⚠️
I very much expect the rotation into CRYPTOCAP:BTC soon 👑

No Rise in Sight — 107K Might Be RightAt the moment, I don’t see any technical reasons for Bitcoin to continue its rally.
For now, I’d like to see Bitcoin move down toward the 107K area or even lower.
The invalidation level of this scenario is marked in red on the chart

Bitcoin Ranges OutlinedData for each BTC range this cycle
🟢 Green (Top label): Run up in USD & % gain
🔴 Red (Bottom label): Drawdown in USD & % drop
Yellow label show the above range duration and total Coinbase volume for BTC/USD spot.
Accumulation zone bottom 15-20% of the current range. $108-111K
Sell at mid and highs of range, or hold some for possible breakout if highs come.
If Bitcoin closes a weekly candle under $108K it breaks this structure it's had since the $15K lows.

Bitcoin Rally Heating Up – Watch This Zone Carefully!As the new week kicked off, Bitcoin ( BINANCE:BTCUSDT ) started to climb, fueled by a pump in the S&P500 index ( SP:SPX ) and the creation of a gap in the S&P500 index.
It seems Bitcoin has successfully broken above the 100_SMA(Daily) and 50_SMA(Daily) , as well as a Resistance zone($114,300-$113,000) .
In fact, Bitcoin has also formed a new CME Gap($113,495-$110,990) due to this S&P500 Index -driven surge.
Right now, Bitcoin is approaching the next key Resistance zone($118,740-$115,740) , Potential Reversal Zone(PRZ) , the Cumulative Short Liquidation Leverage($117,577-$116,731) , and the upper line of an ascending channel .
From an Elliott Wave perspective , by breaking this Resistance zone($114,300-$113,000) , Bitcoin has entered a new phase of wave counting. It appears to be completing microwave 4 of the main wave C . Overall, the corrective structure seems to be a Zigzag Correction(ABC/5-3-5) with an expanding leading diagonal in main wave A .
I expect that in the coming hours, after a pullback to the broken Resistance zone($114,300-$113,000) and those moving averages , Bitcoin might rise again at least up to the Potential Reversal Zone(PRZ) . There's a possibility of forming a larger ascending channel, but since we haven't confirmed a second top, we can't rely on that channel just yet.
Note: In general, the crypto market in the past couple of weeks has been heavily influenced by news around U.S.-China tariffs. Any headline can cause Bitcoin and other tokens to swing up or down, so keep an eye on those geopolitical headlines.
Cumulative Long Liquidation Leverage: $113,625-$112,175
Cumulative Long Liquidation Leverage: $106,033-$104,090
Note: If Bitcoin falls below the moving averages and the Resistance zone($114,300-$113,000) again, we can expect further declines.
Please respect each other's ideas and express them politely if you agree or disagree.
Bitcoin Analysis (BTCUSDT), 2-hour time frame.
Be sure to follow the updated ideas.
Do not forget to put a Stop loss for your positions (For every position you want to open).
Please follow your strategy and updates; this is just my Idea, and I will gladly see your ideas in this post.
Please do not forget the ✅' like '✅ button 🙏😊 & Share it with your friends; thanks, and Trade safe.

BTC Enters Breakdown Area — Volume Could Push Back Below $110KBTC Enters Breakdown Area — Volume Could Push Back Below $110K ⚠️
The previous volume that took BTC before 101K has some trends of this volume, which has a manipulation views, the volume before that did took BTC below 101K ended with a fakeout.
Bitcoin has entered the breakdown area, showing early weakness as price struggles to hold momentum near $115K.
The recent volume spike looks more like distribution pressure than accumulation, signaling that a correction phase could be forming.
📉 Current outlook:
Breakdown zone between $116.3K – $109.7K is active.
Volume is rising, but without strong upward continuation — a sign of selling absorption.
If this pattern holds, BTC could retest the $110K zone or drop slightly below in the next move.
📊 Observation:
The market is testing the upper side of the breakdown range but lacks follow-through.
A close back under $114K would confirm weakness and invite further downside momentum.
💬 Summary:
BTC is inside its breakdown area, and current volume suggests pressure may build to drive price back below $110K if buyers fail to reclaim control soon.

Bitcoin lost its low time frame — red day pressure aheadBitcoin has lost the low time frame structure around the $114.6K – $114.8K zone, signaling a possible shift in short-term momentum.
The break below this area indicates weakness, and BTC is now testing the mid-range levels while showing signs of slowing volume.
📉 Short-term view:
Momentum has turned bearish after rejection from $115.8K.
Next support zone sits around $108K – $109K, where buyers may try to step in.
If this level fails to hold, BTC could revisit $103K support — the key demand area from the previous range.
📊 Technical observation:
BTC’s structure shows a completed short-term top followed by a lower high formation.
This setup often confirms a local downtrend and can lead to several red candles before a new base forms.
💬 Summary:
Bitcoin lost its low time frame momentum, and we could be entering a red session.
We’ll monitor how price reacts near the $108K support zone to evaluate if buyers can regain control or if a deeper correction begins.
We follow the data, at this moment the marketview seems to be red, we will follow if this continues in the coming hours.

BITCOIN to 160kAccording to the 2 parallel long-term trend-lines , there is a chance the top one at 160k work as resistance again like 2024

Bitcoin Breakout or a Deeper Rest Ahead ?👋🏻 Hey everyone! Hope you’re doing great! Welcome to SatoshiFrame channel.
✨ Today we’re diving into the 4-Hour Bitcoin analysis. Stay tuned and follow along!
👀 We’re looking at Bitcoin on the 4-hour timeframe. Bitcoin is currently in a bullish correction and awaiting tomorrow’s news. It’s worth noting that this upward correction is happening below the key resistance level at $115,555. A breakout above this zone could allow Bitcoin to continue the bullish leg it has already started.
🧮 Looking at the RSI oscillator, Bitcoin’s momentum previously entered the overbought area but has now exited and is oscillating below the 70 zone, which now acts as the current resistance level.
✔️ Let’s pay closer attention to Bitcoin’s trading volume — as price approached its major resistance, volume increased. However, given the upcoming news, this wasn’t enough to break resistance, and Bitcoin was rejected from that zone, pulling slightly downward. This downward move isn’t very strong and is accompanied by weak corrective momentum.
✍️ The current Bitcoin scenarios have been updated — you can now focus more closely on these scenarios in the next part of the analysis.
🟢 Long position scenario: A breakout above the key resistance level at $115,555, combined with rising buy volume and an RSI swing above the 70 zone, could mark the end of the correction and continuation of the bullish move.
❤️ Disclaimer : This analysis is purely based on my personal opinion and I only trade if the stated triggers are activated .

BTC/USDT: Symmetrical Breakout and Channel ContinuationHi guys!
Bitcoin has successfully broken out of a symmetrical triangle, confirming a bullish continuation pattern after several days of consolidation. The breakout was followed by a clean retest of the triangle’s upper boundary, which now acts as support.
Currently, the price is moving inside a rising parallel channel, showing a healthy bullish structure with higher highs and higher lows. As long as BTC maintains above the midline of this channel, the short-term trend remains upward.
In the coming sessions, price may continue oscillating within this ascending channel, forming a series of higher lows before reaching the next key resistance around $118,682 , and potentially extending toward the triangle’s measured target at $122,56 7.
On the downside, a confirmed close below the channel’s lower line would be the first sign of weakening momentum and could lead to a deeper pullback toward $112,000–$113,000.
Important levels:
Support: $114,000 / $112,500
Resistance: $118,682 / $122,567
Trend: Bullish above $114,000

GOLD outcome.XAUUSD has been falling and now at a SUPPORT zone. Waiting for confirmation if it will rise in the London session or keep falling.

Bitcoin Analysis - Bulls vs ResistanceBitcoin triggers have been activated just as expected. Personally, I don’t think it’s a bad idea to hold current positions — we’ve got some solid entry points already.
📈 Bitcoin is showing a bullish trend, and as we approach the upcoming interest rate decision, momentum could build even more.
Above the $116,000 zone, we could see a long trigger, but personally, since I already have two open entries from lower levels, I won’t be adding new ones for now.
💡 If the interest rate is lowered, there’s a chance we’ll see a few red candles initially, but overall, it should be positive for the crypto market.
Right now, Bitcoin is facing a key resistance zone — breaking above it could confirm a bullish continuation on higher timeframes. 🚀
Disclaimer:
This content is for informational purposes only and does not constitute financial or investment advice. © DIBAPRISM
Larry D.Kohn

BTCUSDT: Could Continue to Rise Higher Within the ChannelBINANCE:BTCUSDT is a prime example of a market moving within an ascending channel, with price action consistently respecting both the upper and lower boundaries.
Recently, the price broke through a clear resistance zone and retested it. This zone aligns with Bitcoin’s recent volatility range, making it a critical level to watch closely. If this level holds as support, it will confirm the bullish market structure, and there's a high probability the price will continue to rise towards $118,682, the upper limit of the channel.
As long as the price stays above this support zone, the bullish trend will remain intact. However, if the price fails to hold this level, short-term bullish prospects may be challenged, and we could see a decline back towards the channel’s lower limit.
Remember to always apply proper risk management. Wishing you a great trading experience and plenty of profits!

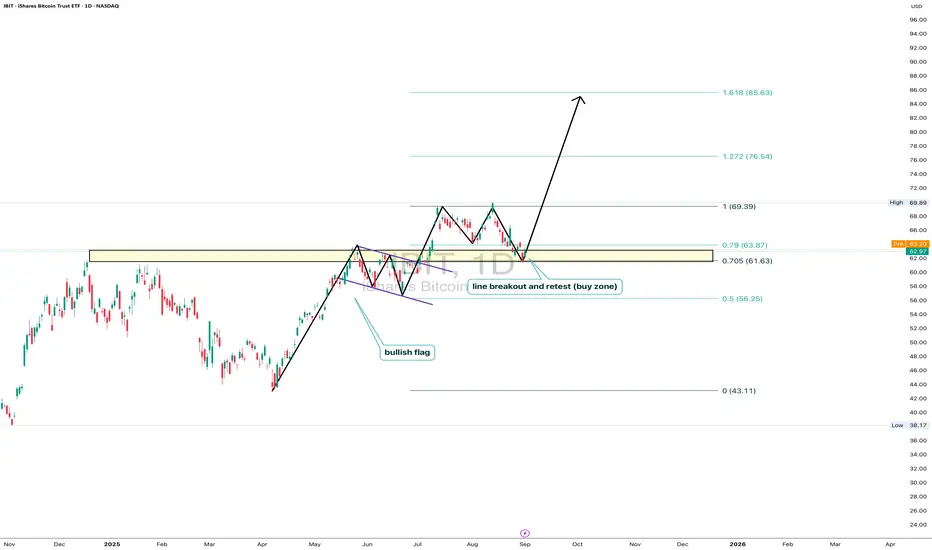
IBIT: ready for liftoffOn the daily chart, iShares Bitcoin Trust (IBIT) trades at $62.97, testing the key 0.705–0.79 Fibo zone ($61.63–63.87). This area marks a breakout and retest line, forming a clear buy zone. The technical structure remains bullish: after breaking out and pulling back, price holds potential to move toward $69.39, with Fibo extensions targeting $76.54 and $85.63. Volumes confirm buyer activity on dips, and the bullish flag pattern supports the continuation of the upward trend.
Fundamentally , the main driver is bitcoin itself, with institutional demand for BTC ETFs staying strong. Large funds continue accumulating positions, while expectations of a softer Fed tone add pressure on the dollar, fueling capital inflows into crypto. This strengthens the bullish case for IBIT.
Tactical plan: watch $61.6–63.8 as the key entry zone. Holding above opens the path toward $69.3, followed by $76.5 and $85.6. The scenario breaks only if price falls below $61.
And let’s be honest: IBIT isn’t just a ticker - it’s the “accelerate bitcoin” button for your portfolio.
SOLUSDT – Bullish Trend Supported by Technical Structure and NewAfter a brief correction, SOLUSDT is showing strong signs of a continued upward movement. The ascending triangle pattern on the H4 chart indicates that SOL is building a solid base, with higher lows and testing the resistance at 200.00 USD. The price is currently above the EMA34, signaling strong buying momentum.
Notably, the price has recently broken through the important 200.00 USD resistance and is now approaching 216.00 USD. If SOL continues to hold above the 200 USD mark and confirms further upward movement, the next target would be 216 USD.
With positive news surrounding Solana and increased investment interest, SOL is likely to maintain its bullish momentum in the short term.
Strategy: Buy around 200.00 USD, target 216.00 USD, stop loss below 195.00 USD.
Summary: The short-term bullish trend remains strong, and SOLUSDT may reach the 216 USD target if it holds above the 200 USD support level.

Examples of Chart Interpretation Methods
Hello, fellow traders!
Follow us to get the latest information quickly.
Have a great day!
-------------------------------------
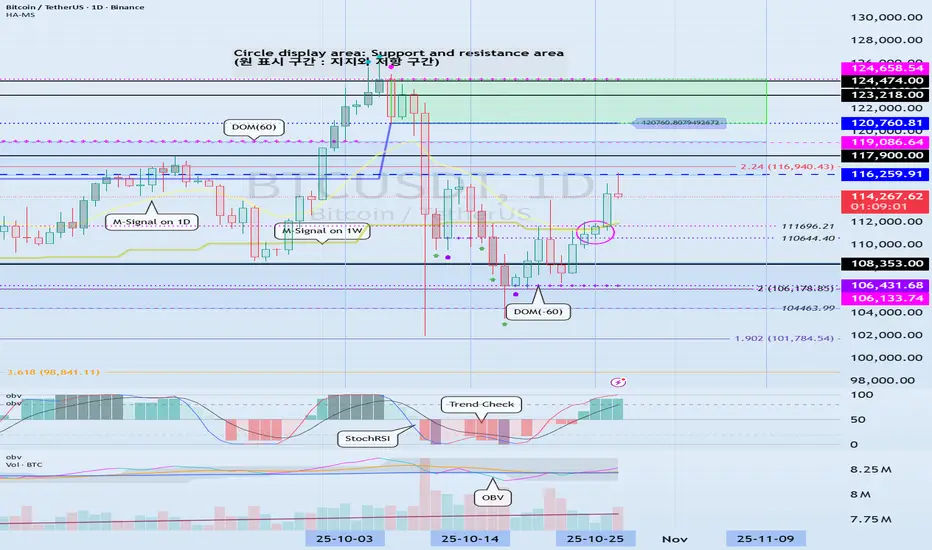
#BTCUSDT
To break above a key point or range and continue the uptrend,
1. The StochRSI indicator must be trending upward. Ideally, it should not enter the overbought zone. 2. The On-By-Signal (OBV) indicator must show an upward trend. If possible, it should remain above the High Line.
3. The TC (Trend Check) indicator must show an upward trend. If possible, it should remain above the 0 level.
Currently, only the TC indicator satisfies the above conditions.
Therefore, if the price remains above the 110644.40-111696.21 range and the above conditions are met, we should see if the price rises above 116259.91 and remains there.
If the On-By-Signal (OBV) indicator remains above EMA 1 and EMA 2 and rises above the High Line, further upside is likely.
However, if the K indicator of the StochRSI indicator enters the overbought zone and the slope changes, the upside may be limited.
When the TC (Trend Check) indicator touches its highest point, there's a high probability of forming a new high, so you should consider a response plan.
Summary of the above:
Support Zone: 110644.40-111696.21
Resistance Zone: 116259.91-119086.64 (up to 124658.54)
------------------------------------
#ETHUSDT
As mentioned in the BTC chart description, ETH is also showing similar movements.
However, the OBV indicator is just about to break above EMA 1 and EMA 2, so if it finds support near 4109.80, there's a possibility of further upside.
-------------------------------------
#ZECUSDT
Based on the BTC chart description, ZEC is likely to continue its upward trend.
The chart is broken due to the sudden surge, making it difficult to determine the duration of volatility.
--------------------------------------------
#XRPUSDT
The key is whether the price can find support at key support and resistance levels and rise above 2.9092.
------------------------------------------
Ultimately, trading will be based on the support and resistance levels drawn on the 1M, 1W, and 1D charts.
However, it is recommended to use auxiliary indicators to confirm whether to initiate a trade.
The basic trading strategy is to buy in the DOM(-60) ~ HA-Low range and sell in the HA-High ~ DOM(60) range.
However, if the price rises in the HA-High ~ DOM(60) range, a step-up trend is likely, while if the price falls in the DOM(-60) ~ HA-Low range, a step-down trend is likely.
Therefore, a fractional trading strategy is recommended.
In this context, the coin (token) currently closest to buying is XRP.
-
Thank you for reading to the end.
I wish you successful trading.
--------------------------------------------------
Why Bitcoin’s 4-Year Cycle Might Be Its Biggest LimitationFor years, traders have treated Bitcoin’s 4-year halving as sacred — a mechanical driver of boom and bust. But what if the real reason these cycles repeat isn’t the code… but the crowd?
Mechanically, Bitcoin’s issuance schedule is a smooth, predictable decline. The halving simply adjusts the slope of supply — it doesn’t dictate price. Yet, like clockwork, markets rise and fall every four years. Why?
Because we expect them to.
This expectation creates a self-fulfilling feedback loop:
- Pre-halving optimism fuels accumulation and speculative positioning.
- Post-halving euphoria drives parabolic rallies as new participants flood in.
- Overvaluation and leverage eventually unwind, triggering brutal corrections.
The halving became the metronome of market psychology — a narrative so powerful that it shaped behavior more than fundamentals ever did.
🧠 The Institutional Shift
Now, that narrative is being rewritten.
Institutions don’t trade on memes or cycles — they trade on models, liquidity, and risk.
Unlike retail investors, institutions hate volatility. They don’t chase euphoria; they manage exposure.
- ETFs and funds accumulate steadily through structured inflows.
- Option and futures desks hedge risk dynamically, suppressing volatility.
- Algorithmic allocators rebalance based on Sharpe ratios, not halving hype.
This structural participation acts as a volatility dampener — flattening the amplitude of Bitcoin’s historic boom-bust waves.
🌍 From “Halving Cycle” to “Liquidity Cycle”
As Bitcoin matures, the real driver of its price action is shifting away from internal events and toward macro liquidity conditions :
- When global liquidity expands (rate cuts, QE, easing credit), Bitcoin thrives.
- When liquidity contracts (rate hikes, QT, risk-off sentiment), Bitcoin cools.
In this new phase, the halving’s scarcity still matters — but it’s no longer the heartbeat.
Instead, Bitcoin is syncing to the rhythm of global capital flows.
📈 The New Market Identity
We’re watching Bitcoin transition from a reflexive narrative asset to a macro-integrated store of value .
If this continues, the implications are profound:
- Shallower drawdowns and fewer liquidation cascades.
- More consistent accumulation across cycles.
- Higher institutional allocation as volatility compresses.
Ironically, the same psychological loop that once fueled Bitcoin’s meteoric rise may now be what caps its potential.
The halving didn’t make Bitcoin cyclical — investor behavior did .
And as smart money takes over, that feedback loop may finally be breaking.
🚀 What This Might Mean for Future Bull Runs
If institutions continue to dominate Bitcoin’s liquidity, the next bull runs may look less like fireworks and more like steady expansion — smoother, slower, but more sustainable.
Instead of 12-month parabolas followed by multi-year winters, we could see:
- Extended accumulation phases where price grinds higher over longer horizons.
- More efficient corrections that reset leverage without catastrophic selloffs.
- Reduced retail blow-off tops as narrative-based speculation loses power.
That doesn’t mean the explosive upside is gone — it means the path to higher valuations might look more like a compound growth curve than a recurring bubble.
The next phase of Bitcoin’s evolution isn’t about chasing the halving — it’s about understanding liquidity, positioning, and psychology on a global scale.
- The crowd traded Bitcoin like a story.
- Institutions are turning it into a system.

BITCOIN CLEAR REJECTION|SHORT|
✅BTCUSD made a liquidity grab above the previous high, price sharply rejected from the 4H supply area, confirming a fakeout and shift in order flow. The market structure suggests redistribution, with inefficiency below acting as the draw on liquidity. Expect short-term delivery toward $114,000. Time Frame 4H.
SHORT🔥
✅Like and subscribe to never miss a new idea!✅

Meme Coins: Gambling or Genius? The Untold Psychology!Hello Traders!
From Dogecoin to Shiba Inu to PEPE, meme coins have turned ordinary investors into overnight millionaires… and just as quickly, wiped them out.
But behind all the hype, memes, and moonshots, lies a deeper question:
Are meme coins pure gambling, or is there actually a kind of genius hidden inside this madness?
Let’s explore the real psychology that drives the meme coin phenomenon and what it teaches us about market behavior.
1. The Allure of “Quick Rich” Dreams
Meme coins sell emotion, not utility. They trigger the most powerful desire in human nature, the dream of instant wealth.
Traders jump in not because of fundamentals, but because of FOMO (Fear of Missing Out).
When people see others getting rich on Twitter or Telegram, logic disappears, replaced by hope and greed.
Meme coins don’t just trade on charts; they trade on human emotion.
2. The Hidden Genius of Community Psychology
While most treat meme coins as jokes, their creators understand one truth, markets move on attention .
Every meme coin is a masterclass in viral marketing.
They combine humor, belonging, and financial dreams, creating powerful communities that believe, promote, and act together.
It’s not fundamentals, it’s faith.
And when millions believe at the same time, even a joke becomes valuable, at least for a while.
3. The Bubble Psychology – Why It Repeats
Each meme coin cycle starts the same: early adopters accumulate silently.
Then comes the hype wave, influencers, trends, and social media buzz.
Late buyers rush in, liquidity explodes, and eventually, the supply outpaces the demand.
Finally, prices collapse, but the story repeats with a new name next month.
Humans never learn because our emotions never evolve. The pattern stays the same, only the logos change.
4. Genius or Gambling – The Thin Line
If you treat meme coins as “investments,” you’re gambling.
But if you treat them as short-term speculative plays with strict risk limits, you’re being strategic.
The key difference is not in the coin, it’s in your mindset.
Even BNF-level discipline can’t save someone trading emotionally in meme markets.
The real genius is not in predicting the next PEPE, it’s in managing risk when emotions run wild.
Rahul’s Tip:
Meme coins reveal more about human behavior than any economic theory ever will.
If you can understand why people chase hype, and control the urge within yourself, you’ll already be ahead of 90% of traders.
Conclusion:
Meme coins are not just digital jokes, they are mirrors reflecting our collective greed and hope.
They remind us that markets are not rational, they are emotional.
In the end, whether meme coins make you rich or broke depends less on the coin, and more on your ability to stay grounded while everyone else loses control.
If this post gave you a new perspective on meme coins, like it, share your view in comments, and follow for more deep trading psychology insights!
