BTCUSDTP. - November 18, 2025Price is pulling back toward a clear support zone around 93,000, with a deeper support level near 92,000, while the nearest resistance sits around 96,200 along a descending trendline. The chart suggests a possible bounce from support toward resistance, but a break below 93,000 could open the way toward 92,000.
If trading this setup, the long scenario is higher-risk, as price is currently trending downward into support and could continue lower before reversing.
Bitcoin (Cryptocurrency)

MSTR – Approaching Major Support as Downtrend ContinuesMicroStrategy remains in a clear higher-timeframe downtrend, and if Bitcoin continues to weaken, NASDAQ:MSTR could slide further toward the next major support level — now sitting roughly 63% below its all-time high. This zone may act as a potential reversal area, especially if market sentiment stabilizes.
Trade Setup:
• Entry Zone: $170 – $180
• Take Profit Targets:
🥇 $280
🥈 $360
• Stop Loss: $122

BTC Daily View 17.11Hey friends! How’s your trading week starting off?
In my last Bitcoin post, I shifted my invalidation zone from 96,600 to 95,545 and said that if 95,545 breaks, then 96,600 won’t hold either.
Well… it broke — so I revisited the chart.
Now I think the correction after the drop should be bigger than I first expected.
For now, I’m looking at a move up toward 98,400, and then a possible continuation of the downtrend.
I still see two paths — along the orange and purple arrows.
❌ Invalidation zone: 94,850
⚠️ Not financial advice — just sharing my view.
Trade your own plan, always use stops.
⭐ Follow for updates
💬 Drop a reaction in the comments!

Bitcoin to $340k by March 2026?Bitcoin is quietly forming one of the largest high-timeframe bullish structures we've ever seen — a massive cup-and-handle / inverse head & shoulders hybrid that mirrors a multi-cycle trend stretching all the way back to 2015.
We just tapped the trendline for the third time, and historically, BTC’s explosive legs have always started right after this kind of multi-touch compression.
📍 Technical Setup
Long-term ascending channel (2015 → now)
Repeated bullish structure with measured-move targets around +350%
A clean breakout from the handle places BTC right around $340k–$345k
March 2026 aligns with both the channel top and the projected cycle extension
💥 Why This Could Be the Max-Pain Scenario
The market spent the last 60 days liquidating:
Overleveraged long traders
10/10 liquidation-event tourists
OG whales expecting another “easy” 4-year cycle play.
This creates the perfect fuel for a melt-up as liquidity rotates back upward. Max pain isn’t down — it’s a breakout that leaves the majority completely unpositioned.
⏳ Timing
The setup suggests:
End of year → First quarter of next year: momentum builds
2025 → 2026: extension move toward channel top
Target zone: $340k
Time window: March 2026
This is a slow-burn, high-timeframe structure that most traders simply aren’t looking at.
📈 Final Thought
Everyone is focused on short-term chop. Meanwhile, Bitcoin might be printing its most perfectly aligned macro structure since 2015.
If this breaks out like the previous two cycles, the move won’t give many chances to “buy back in.”

BITCOIN The 1W MA50 Bear confirmation you didnt want, happened..Bitcoin (BTCUSD) just closed last week below its 1W MA50 (blue trend-line) for the first time since March 06 2023. Since that break-out, the 1W MA50 had been tested and held on 3 major occasions within the Bull Cycle, providing the most optimal mid-Cycle entries during those 2.5 years.
What's even more important than this time distance, is the fact that every 1W candle closing below the 1W MA50 has always marked/ confirmed the start of the new Bear Cycle historically. This is something that we've presented to you and discussed numerous times this year, as we were analyzing BTC's 4-year Cycle theory and why October was the most likely Cycle Top candidate time-wise.
This time we are looking at the previous Cycle more specifically, due to the strong similarities so far leading to the current Top. First of all the end-of-Cycle rallies on both started after a clear test and rebound on the 1W MA50. At the same time, the both displayed Higher Highs, against the 1W RSI's Lower Highs, which is a huge Bearish Divergence and the first strong indication that the Cycle Top may be forming.
The Cycle Top on both came when the 1W RSIs were 70.00. Also the 1W MA50 break-out took place around the 0.382 Fibonacci level from the last test/ rebound. As you may realize, there is a high degree of symmetry here both price-wise and in terms of RSI. If that continues, we can expect the Bear Cycle bottom to be at least on the 1.618 Fibonacci extension at $55000.
So do you think that the closing below the 1W MA50 has confirmed the new Bear Cycle? Feel free to let us know in the comments section below!
---
** Please LIKE 👍, FOLLOW ✅, SHARE 🙌 and COMMENT ✍ if you enjoy this idea! Also share your ideas and charts in the comments section below! This is best way to keep it relevant, support us, keep the content here free and allow the idea to reach as many people as possible. **
---
💸💸💸💸💸💸
👇 👇 👇 👇 👇 👇

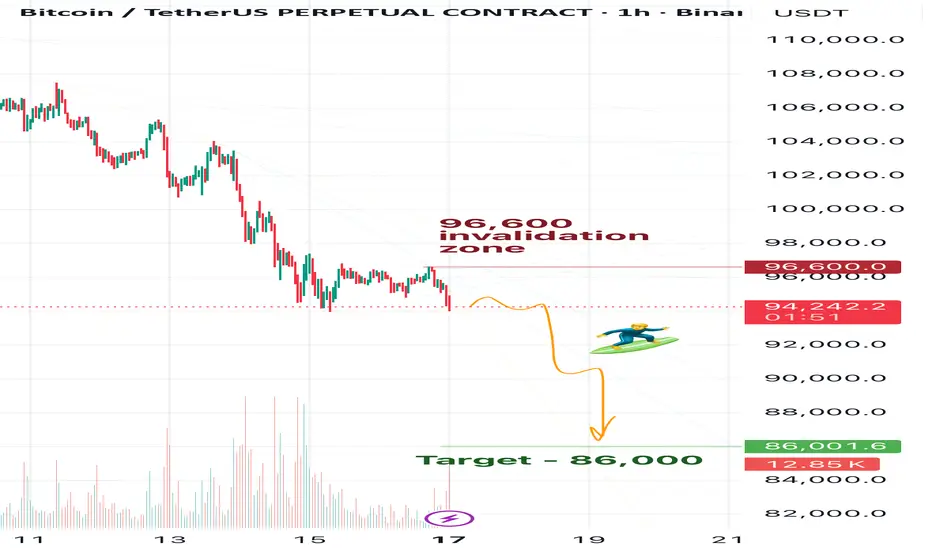
BTC Daily View 17.11Friends, as you may remember from my previous Bitcoin updates, I’m expecting BTC to reach 83k. At the moment, in my view, Bitcoin is already preparing for this move down.
However, for now my main target is 86k — I think BTC currently has enough momentum only to drop to that level. Before we see 83k, it will likely need to build more energy.
So after hitting 86k, I expect a correction — probably a prolonged one. But let’s see what the market gives us.
🎯For now, my target remains 86k.
❌Invalidation zone: 96,600
⚠️Disclaimer:
This is not financial advice. Please make your own decisions according to your own trading rules, and never trade without stop-losses.
🗯️If you find my ideas helpful, please leave a reaction and write a comment — your support really matters to me
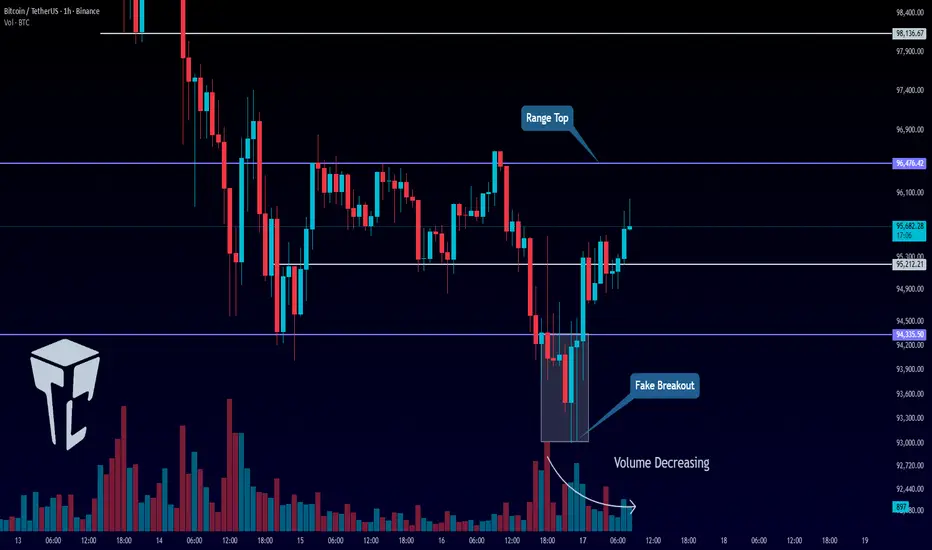
TradeCityPro | Bitcoin Daily Analysis #223👋 Welcome to TradeCity Pro!
Let’s dive into the Bitcoin analysis. Yesterday, Bitcoin made a fake downward move and is now back in its range box.
⏳ 1-Hour Timeframe
Yesterday, the short triggers we had at 95,212 and 94,335 were activated, and the price moved slightly downward. However, this bearish move turned out to be a fakeout, and the price started moving upwards again.
✅ Currently, the price has moved above 95,212 and managed to stabilize above this level. The next resistance zone for Bitcoin is at 96,476.
⚡️ The 96,476 zone was faked yesterday, and after a candle closed above it, the price moved downward. Now, we need to wait for the price’s next reaction to this level to refine the exact breakout point.
✨ After this encounter, we can open a risky long position if the level breaks on the next attempt. The next target above this level is 98,136.
📊 For a short position, since the price faked the bottom of the range, the chart is a bit messy. I personally prefer to wait for the price to establish more structure and for a new trigger to form. We can then open a new position upon the breakout of the next trigger.
💼 For previously opened short positions, we can move the stop loss above the 96,476 level.
❌ Disclaimer ❌
Trading futures is highly risky and dangerous. If you're not an expert, these triggers may not be suitable for you. You should first learn risk and capital management. You can also use the educational content from this channel.
Finally, these triggers reflect my personal opinions on price action, and the market may move completely against this analysis. So, do your own research before opening any position.
Bitcoin MULTI supportsat $94 on weekly , looks like Bitcoin has many support-lines which could make it bullish to $118k again

BTCUSD Rebounds From Buyer Zone — Correction Toward $101KHello traders! Let’s take a look at BTCUSD (Bitcoin). After an extended bearish phase inside a broad descending channel, price consistently respected both the resistance and support lines, forming a clear series of lower highs. Each touch of the descending resistance line resulted in a Turned Around reaction, confirming strong seller control throughout the structure. Earlier, Bitcoin broke below its local support area, initiating a deeper correction toward the major Support Level near $96,000. This zone aligns with the lower boundary of the descending channel and historically served as a strong reaction area for buyers. Recently, BTCUSD reached the bottom of the structure and is now showing early signs of a potential pullback. Price is attempting to rebound from the Buyer Zone, aiming toward the nearest resistance cluster around $100,800–$101,600, which also forms the lower boundary of the Seller Zone. This level previously acted as support and is now expected to serve as a strong retest area. As long as price remains below the descending resistance line, the overall trend stays bearish. A short-term bullish correction toward TP1: $101,600 remains possible, especially if buyers maintain control above the $96,000 support. However, if BTC fails to break above the Seller Zone, sellers may step in again, potentially pushing the price back toward the major support and even extending the downtrend. A confirmed breakout above the descending resistance would invalidate the bearish scenario and open the door for a stronger recovery. Please share this idea with your friends and click Boost 🚀

BTC 95K is DONE. WATCHING FOR 100K BounceMorning folks,
So, our plan worked perfect, BTC collapsed as we suggested. Now price is at oversold as on daily as on weekly TF and at support. So, it is reasonable to expect a tactical bounce, somewhere back to 100K. And it could start from a kind of reverse H&S on 1H Chart .
If it starts at all...
But it is not interesting... today we probably can't escape some fundamental analysis. I don't believe in occasional coincidence of stock market collapse right at the eve of Thanksgiving and Xmas and appearing of Epstein compromat on D. Trump. Meantime Donny is loosing all his allies - Musk, Carlson, Now M. Taylor Greene.
I wouldn't worry too much, if I would not see a big bearish signs on BTC, suggesting drop to 80K and even 50K in perspective. As you understand, this could happen only in a case of total collapse on stock market.
Buckle up and be prepared. No longs by far. Wait for mentioned pullback to consider a new shorts.
Take care, S.


$BTC Halfway to Confirming Bear Market - BUT There's HOPE!BAD NEWS ⚠️
₿ITCOIN IS HALFWAY THERE TO CONFIRMING A NEW BEAR MARKET.
🚨 This is the first-time that CRYPTOCAP:BTC has closed below the 50WMA since Dec ’21. We all know what happened after that.
🚨 If we get another consecutive Weekly close below the 50WMA, I am confident this is the beginning of the end for the bull market.
If that happens, I will discuss my new exit strategy and POI in another post.
GOOD NEWS 🙌
⚡️ The long-awaited DEATH CROSS on the Daily Chart has occurred, which historically marks the bottom.
⚡️ PA is sitting at VERY strong support on the .618 Fib
⚡️ RSI is LOWER than the Liberation Day madness Feb - April ’25, and the lowest it’s been since July ’22.
NOTE: This is the smallest correction we’ve had all bull market.
TL;DR 📖
✅ This is the absolute best time to buy CRYPTOCAP:BTC
✅ Just make sure to follow the 50WMA invalidation if you do take a position.
Remember, we have the most insanely bullish macro / regulatory backdrop in crypto’s entire existence.
MY THOUGHTS 🤓
🐂 I truly believe this is the biggest fake-out we’ve ever seen. There’s way too many tailwinds on the horizon to let this go to waste.
🐂 Bulls need a $10k Mega-Candle THIS WEEK to reclaim momentum.
🐂 I’m still a MEGA-BULL until my thesis is invalidated.
⛔️ We could get one last flush ~$92k to grab CME Gap liquidity.
🛑 DO NOT USE LEVERAGE EVER AGAIN!!!

BITCOIN 2025 - MAKE OR BREAKBTC is coiling. Liquidity is tightening. Momentum is fading. The market is soon to decide whether we break higher toward the next resistance leg… or lose key support and trigger a broader correction.
Two key dates stand out: November 6 and November 17.

Bitcoin: 100K Resistance Watch 88K Overlap.Bitcoin rejected the 105K area NEW resistance/old support. I wrote about this possibility a week ago and highlighted it during my stream. With the new low in progress, this area 95K and 90K are the next support areas to watch for swing trade reversals. Note the 90K to 88K area is a major support and IF cleared, will confirm a significant change to my wave count.
It is IMPORTANT to consider this game as a collection of "IFs". If you were lured by all of the hype and high risk prices above 100K (I talked about this all summer), NOW you get to sit through the associated pain. THESE are prices to be interested in, especially for accumulating for investment. An OPEN mind is required to navigate this arena of incomplete information. Bitcoin can TEST as low as 73K (the pre election all time high) or even lower. How you manage risk through sizing and moderation of leverage (if used at all), is how you will more likely arrive at an optimal outcome.
My chart shows key levels on this specific time frame, the arrow points to a reaction point (100K new resistance), and the illustration of lines highlights a potential scenario that I believe has a higher probability of developing over the coming week or weeks. As of now, the 95K support is broken but not by much, it can reverse quickly. Since there are a number of major supports in this area, the key is to confirm a reversal pattern. It may be in the form of a failed low or double bottom like formation nearer the 90K level. It is within reason to measure profit potential from the 100K area now that it is a new resistance. This is the shorter time horizon perspective ideal for swing trades only.
In terms of the broader view, 88K is major because it is where I have my Wave 1 of this broader wave defined. IF price overlaps this (meaning it goes to 85K with no swift rejection) then it confirms that the current structure is the broader corrective wave (Wave 2). This Wave 2 can potentially see prices in the 50Ks or theoretically lower. I believe extreme low prices are a low probability, but you must be prepared either way. I don't make specific forecasts because I know price is purely driven by sentiment, and sentiment can be extremely irrational.
Lesson: LEARN to assess risk and reasonable possibilities through TECHNICAL analysis along with some fundamental perspective. If you are stuck from much higher prices, you can only blame yourself for consuming too much Michael Saylor content. While the short term price structure is bearish, the bigger picture hasn't changed yet. THIS is what an investment opportunity looks like, NOT pushing all time highs day after day. As an investor you assume the most risk, so how much you risk should always be the focus, not how much you can make. And also consider the question: what has changed fundamentally? Sentiment drives price and when it gets to an extreme, opportunities arise especially when aligned with the fundamental view.
Thank you for considering my analysis and perspective.

BTCUSDT.P - November 17, 2025BTCUSDT is still in a short-term downtrend, but price is holding above the support zone around $94,300–$94,500 while the next major resistance sits near $96,500–$96,600. The chart suggests a potential rebound toward resistance if support continues to hold, but a break below $94,300 would likely send price back toward the lower support near $93,250.
With a stop level around $93,250 and a target near $96,600, the setup offers a favorable reward-to-risk profile, but remains moderate-risk due to the prevailing downtrend.

Crypto & Bitcoin Do or Die!In this video we show you the mother of all trendlines on BTC and why we think it will likely catch a dead cat bounce.
The total crypto market cap is at an inflection point. If this level doesn't hold we have a failed weekly bullish pattern.
A failed bullish pattern of results in extreme downside pressure.
BTC is retracing to a key 618 Fib level from your tariff low selloff so there is some support here.
Its also hitting a monthly chart trendline going back several years.
I like crypto for a long here on a risk to reward basis. If we lose this area keep in mind our next major support is $85k which is another 10K lower.

BItcoin super cycle This is what I believe is a scenario we might see.. in which bitcoin goes back to 60k ish and then to 150k then back to 75k then back to 150k before it goes moon shot 1 million dollars in 2031-32 the gains will be minimal for now bull markets will be weak. But wait it out till 2031-32 and youll be likely rewarded.

BTCUSDT BREAKOUT HINTS BELOW $100KThis Daily chart of Bitcoin/TetherUS (BTC/USDT) shows the price action breaking down from a consolidation pattern, suggesting a likely continuation of selling pressure.
The price has been trading around the $107,000 to $111,000 range for a period, forming what could be interpreted as a potential ascending triangle pattern or, more recently, a flag/pennant consolidation after a drop from the October high. Crucially, the chart highlights a decisive breakout below a solid black short-term trendline and the 'Yearly trendline Support' (dashed blue line).
The breakdown occurred near the $107,000 area, which previously acted as a significant support zone (the upper grey shaded box). The current candle shows the price trading at $103,957.19, significantly below this resistance-turned-support zone.
📉 Projection and Key Levels
The immediate projection is for the selling to continue towards the next major horizontal support level. This is the 'Monthly Support' zone, represented by the lower grey shaded box, which is approximately in the $100,000 to $102,000 range. This area is psychologically significant due to the round number and has historically been a strong area of demand (support).
Near-Term Projection: A move down to test the $100,000 - $102,000 Monthly Support zone is highly probable following the confirmed trendline and pattern break.
Continuation Risk: If the price fails to hold the $100,000 mark and breaks below the lower bound of the Monthly Support, it would signal a much deeper correction, likely targeting areas around the July/August lows near $97,000 or lower.
Resistance: The broken support level near $107,000 will now act as immediate resistance on any bounce attempts.
The technical setup, marked by the breakdown and the descending arrow, strongly favors a move to the downside in the short to medium term.

BITCOIN is still bearish (4H)After accumulating a large liquidity pool, as shown on the left side of the chart, the price has entered a bearish trend.
Within the supply zone, we expect the price to move downward again after collecting liquidity from the order blocks.
The targets are marked on the chart.
A daily candle closing above the invalidation level will invalidate this outlook.
Do not enter the position without capital management and stop setting
Comment if you have any questions
thank you

TradeCityPro | Bitcoin Daily Analysis #222👋 Welcome to TradeCity Pro!
Let’s dive into the Bitcoin analysis. Today is Sunday, the last day of the week. Let’s go over the triggers and scenarios for the upcoming week.
⏳ 1-Hour Timeframe
On the 1-hour timeframe, after a bearish leg, Bitcoin has now reached the 94,335 level and formed a range box between 94,335 and 96,476.
📊 Volume has naturally decreased over the past few days due to the weekend and the price correction.
🔭 Today, the market could make a move during the New York session, and we can better assess this by looking at volume trends.
🧮 If, near the New York session or during it, volume starts to increase, we can expect the market to make a move.
📉 For a short position:
The first trigger is at 95,212. The main trigger for the start of a new bearish wave is 94,335.
⚖️ If you already have an open position and your account is in profit, it might be worth taking the risk and entering earlier with the break of 95,212. However, if your account is at a loss, I recommend waiting for the 94,335 trigger to activate.
🚀 For a long position:
It’s better to wait for the current bearish momentum to subside and for the market to become bullish. But, if you want to make an early entry, the 96,476 trigger might be a decent option.
💡 Personally, I will wait for the price to form a higher high and higher low above 96,476 before pursuing a long position.
❌ Disclaimer ❌
Trading futures is highly risky and dangerous. If you're not an expert, these triggers may not be suitable for you. You should first learn risk and capital management. You can also use the educational content from this channel.
Finally, these triggers reflect my personal opinions on price action, and the market may move completely against this analysis. So, do your own research before opening any position.

Bitcoin Breaks Below $100,000 – The Downtrend Isn’t Over Yet!Bitcoin is entering one of its most vulnerable phases of the quarter, as both fundamentals and technicals strongly point toward a continued downside. The break below the psychological $100,000 level has triggered a wave of widespread fear , pushing the market firmly into defensive mode.
Recently, ETF outflows have accelerated , with institutional funds pulling out more than $3.4 billion since October. At the same time, expectations for a Fed rate cut in December have weakened , while the U.S. Dollar rebounds , adding more selling pressure across the crypto market. The Fear & Greed Index plunging into “Extreme Fear” highlights how fragile and cautious overall sentiment has become.
On the chart, the downtrend is now unmistakable. Price continues to move within a descending channel , repeatedly getting rejected at the upper trendline. The $100,000 level has flipped into strong resistance . Without substantial buying pressure, BTC is likely to rebound only slightly into the $100,000–$102,000 zone before sellers step in again.
The most probable short-term scenario: BTC trades weakly, makes a small bounce into resistance, then continues sliding toward the $90,000 support zone. If this level breaks, the next destination sits near $87,600, where major support aligns with the bottom of the channel.
Given the negative news flow, weak liquidity , and bearish technical structure , the dominant trend remains to the downside. This is not an ideal moment to attempt bottom-picking—at least not until the market shows genuine signs of recovery or institutional capital begins flowing back in.

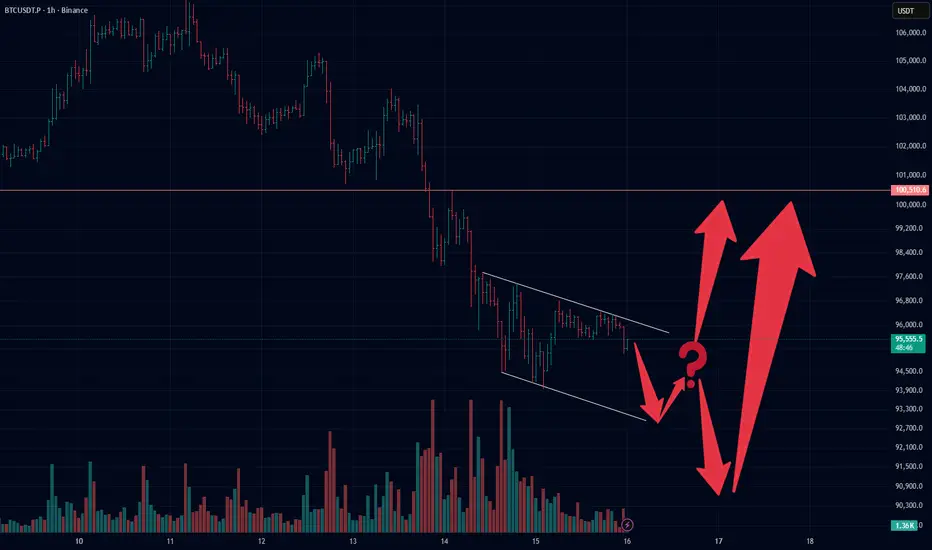
BTCUSDT.P - November 16, 2025BTCUSDT.P remains in a clear downtrend, with lower highs forming beneath a descending resistance line. Momentum looks weak, and if the current support area fails to hold, the chart suggests a potential continuation toward the lower support zone.

Price is sliding inside a clean descending channel. Each attemptPrice is sliding inside a clean descending channel. Each attempt to break above the upper boundary has been rejected, and the structure still prints lower highs. As long as price remains inside this channel, the market keeps its corrective tone.
A decisive break below the mid-section of the structure may trigger one more push toward the lower boundary of the channel. On the other hand, a clear breakout above the upper trendline would invalidate the local pressure and open space for a fast upside continuation.
The chart is at a decision point: either a final sweep toward the lower band before a reversal, or a direct breakout. Confirmation will come only after price leaves the channel with impulsive volume.