#BTCUSDT #12h (Bitget) Descending trendline breakout [LONG]Bitcoin looks ready for short-term recovery after regaining 100EMA support and pulling back to it.
⚡️⚡️ #BTC/USDT ⚡️⚡️
Exchanges: Bitget Futures
Signal Type: Regular (Long)
Leverage: Isolated (8.0X)
Amount: 4.7%
Current Price:
92299.9
Entry Zone:
92024.8 - 90186.8
Take-Profit Targets:
1) 96927.7
2) 101312.3
3) 105696.9
Stop Targets:
1) 86234.0
Published By: @Zblaba
CRYPTOCAP:BTC BITGET:BTCUSDT.P #12h #Bitcoin #PoW bitcoin.org
Risk/Reward= 1:1.2 | 1:2.1 | 1:3.0
Expected Profit= +51.1% | +89.6% | +128.1%
Possible Loss= -42.8%
Estimated Duration= 3-4 weeks
Bitcoin (Cryptocurrency)

BTCUSD READY FOR FLY (READ CAPTION)Hi trader's what do you think about btcusd
BTCUSD is currently maintaining a bullish market structure, with price holding firmly above a strong support zone and showing consistent buyer interest on pullbacks. The overall price action supports further upside continuation toward higher levels.
🔹 Support Zone: 89,000–88,000
This zone represents the primary bullish demand area where buyers have repeatedly stepped in.
As long as BTC holds above 88,000, the bullish bias remains intact.
🔹 Resistance Zone: 95,000
This is the key resistance area where price may face temporary rejection or consolidation.
A strong breakout and close above 95,000 will confirm bullish continuation.
🔹 Supply Zone: 99,000
This is the major upside target and supply area.
If BTC breaks above 95,000, price is likely to extend toward the 99,000 supply zone, where sellers may attempt to slow the move.
A decisive breakout above this zone could signal further upside expansion.
📈 Market Outlook
Holding above 89,000–88,000 → Bullish continuation expected
Break above 95,000 → Opens path toward 99,000 supply zone
Supply zone reaction will determine the next major directional move
Overall, the structure favors a bullish pullback followed by continuation scenario.
please don't forget to like comment and follow

Injective (INJ) – Spot Long Setup Amid Sector StrengthThere’s been a noticeable bounce across several gaming and Web3 tokens in the last 24 hours, and Injective (INJ) could be one of the next to follow. With broader sentiment improving and technicals stabilizing, we're watching INJ closely for a potential continuation higher in the short to medium term.
🔹 Entry Zone: $5.20–$5.45
🔹 Take Profit Targets: $7.00–$8.00 (TP1), $10.00–$12.00 (TP2)
🔹 Stop Loss: Just below $5.00
We’re currently accumulating INJ around the support range, aiming to ride a potential move higher over the coming weeks. The setup offers a clean structure with a defined invalidation and multiple reward zones, aligning well with recent sector momentum.
🔔 Always manage your risk appropriately.

MSTR Trade Setup – BTC Correlation PlayMicroStrategy NASDAQ:MSTR caught a strong bid in yesterday’s session, driven by upward momentum in Bitcoin (BTC). With MSTR’s heavy BTC exposure, it often mirrors crypto market trends—and right now, it’s pressing against a key resistance zone.
🟢 Setup:
We're watching the $173.00 resistance level for a potential breakout and clean retest. A successful confirmation above this zone would trigger a long spot entry. Volume confirmation and BTC’s price action will be critical for conviction.
🎯 Targets & Risk:
TP Zones: $200–$230, then $280–$320
Stop Loss: Below $155
This is a momentum-based setup tied closely to BTC’s direction. Monitoring both charts is essential for trade management.

BTCUSD I Potential Accumulation BreakoutWelcome back! Let me know your thoughts in the comments!
** BTCUSD Analysis - Listen to video!
We recommend that you keep this on your watch list and enter when the entry criteria of your strategy is met.
Please support this idea with a LIKE and COMMENT if you find it useful and Click "Follow" on our profile if you'd like these trade ideas delivered straight to your email in the future.
Thanks for your continued support!

BTCUSD: potential $100K push🛠 Technical Analysis: On the 4-hour (H4) timeframe, Bitcoin (BTCUSD) has shown a strong recovery following its November lows. The price is currently testing a significant horizontal Resistance zone between $92,000 and $94,406.
As explicitly noted on the chart, a sustainable uptrend depends on one condition: "Price must consolidate in the resistance area of 92,000" before a high-probability buy can be considered. This consolidation would signal that buyers have successfully absorbed the overhead supply. Currently, the price is trading above the SMA 50, SMA 100, and SMA 200, which now serve as a solid support cluster below the current market price.
———————————————
❗️ Trade Parameters (BUY)
———————————————
➡️ Entry Point: Confirmation of consolidation/breakout above $94,406
🎯 Take Profit: $104,590.40 (Resistance)
🔴 Stop Loss: $87,617.05
⚠️ Disclaimer: This is a potential trade idea based on current analysis; market conditions and price direction are subject to change based on news factors and volatility.

Bitcoin Is Waking Up — Is This the Start of the Next Expansion1. Market Structure Overview
After a sharp sell-off, BTC spent time consolidating and building a base.
Price has now reclaimed key intraday levels and is forming higher lows, signaling a bullish shift in short-term structure.
The latest impulsive candle from support confirms buyer participation, not just a dead-cat bounce.
2. Key Technical Zones
Support Zone (Demand)
- The highlighted support zone around 91,000–91,100 has been tested multiple times.
- Each pullback into this zone is being bought aggressively, showing strong demand.
- EMA (yellow) is starting to curl upward and aligns with this support → dynamic confluence.
Upside Liquidity Levels
- 92,900 – First intraday resistance / minor supply.
- 93,700 – Previous reaction high, potential pause level.
- 94,400 – Major liquidity pool & range high.
These levels act as magnets if bullish momentum continues.
3. Scenario Outlook
🟢 Primary Scenario — Bullish Continuation
As long as price holds above the 91K support zone, bullish bias remains valid.
Ideal structure:
- Pullback → higher low above support
- Continuation toward 92,900 → 93,700 → 94,400
This aligns with a classic expansion leg after accumulation.
🔴 Invalidation / Caution Scenario
A clean break and acceptance below 90,900–91,000 would invalidate the bullish setup.
That would suggest the move was a liquidity grab, not a true reversal, and price may rotate back into the range.
4. Trading Insight
❌ Chasing longs at resistance is risky.
✅ Best long opportunities:
- Pullbacks into the 91K demand zone
- Bullish confirmation candles (engulfing / strong closes)
- Risk management is key Let the market confirm continuation.
Conclusion
Bitcoin is showing early signs of trend resumption, backed by strong defense of support and improving structure. If buyers maintain control above 91K, the path of least resistance points toward higher liquidity levels near 94,400.
💬 Do you see this as the start of a new bullish leg, or just another range rotation?

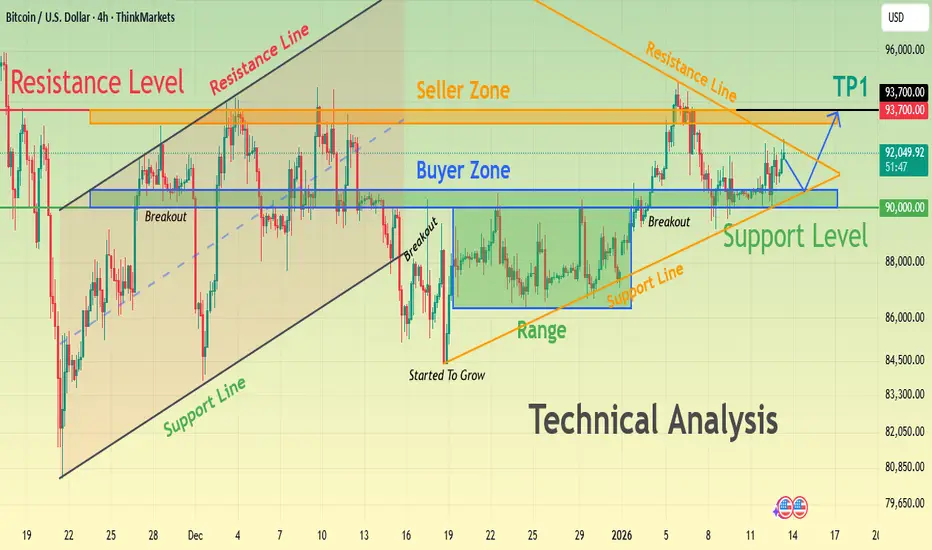
BTCUSD Consolidation Before the Next Big MoveHello traders! Here’s my technical outlook on BTCUSD (4H) based on the current chart structure. Bitcoin is trading within a broader bullish structure after reclaiming key levels and breaking above previous consolidation zones. Earlier on the chart, price respected a rising support line and formed a series of higher lows, signaling growing buyer strength. After a brief pullback, BTC entered a consolidation range, where the market paused before continuing higher. This range acted as an accumulation zone, and the subsequent breakout confirmed renewed bullish momentum. Currently, BTCUSD is trading above the Buyer Zone around the 90,000–91,000 area, which aligns with previous resistance turned support. Price recently broke out from this zone and is now consolidating just below the Seller Zone / Resistance Level near 93,700. This resistance also aligns with a descending resistance line, increasing its significance and making it a key reaction area. My scenario: as long as BTCUSD holds above the Buyer Zone and respects the rising support line, the bullish structure remains intact. A clean breakout and acceptance above the 93,700 Resistance Level would confirm continuation toward the next upside target (TP1). However, a strong rejection from resistance could lead to a corrective pullback back into the Buyer Zone before any further attempt higher. For now, price remains compressed between support and resistance, and a decisive move is likely soon. Please share this idea with your friends and click Boost 🚀
Bitcoin - bad day and week.CRYPTOCAP:BTC #Bitcoin
Looking at the chart, the S&P 500 has finally started correcting, and given everything going on in the world right now, it was long overdue.
The pattern looks extremely similar to the first quarter of 2025 when the S&P 500 tanked hard, and Bitcoin followed with a -18% to -22% correction.
Trade idea with a tight stop loss at $92,555.
Take profit at $70,555 (based on the Coinbase order book).
If you don't want to sit around waiting for Bitcoin to correct, keep an eye on gold, silver, platinum, and aluminum = they all have solid upside potential in the same 20-40% range.
Gold:
Silver:
Platinum:
Aluminum:

BTC Intraday – Context UpdateAfter yesterday's decline, the price is now trading at 91,150.
From here, I am watching for a potential continuation of the decline to 90,300-90,000, where there is a zone of strong reaction.
This zone will be key:
-No buyer reaction and pressure → the decline may continue.
-Buyer acceptance and reaction → potential intraday long context, only with confirmation.
At this stage, this is a contextual reflection, not a signal to execute.
Bias follows structure — execution follows confirmation.
Stay tuned for updates as the structure develops.

Bitcoin Is At Supply – This Rally Looks ExhaustedBITSTAMP:BTCUSD on the M30 timeframe is currently trading into a clearly defined supply zone, and the context of the move strongly suggests this is a corrective rally within a broader distribution range, not the start of a new bullish leg. The recent impulsive push higher was sharp and emotional, but price has now stalled exactly where sellers previously stepped in aggressively a classic warning sign.
From a market structure standpoint, BTC has not established a clean bullish trend. Instead, price continues to oscillate between premium (supply) and discount (demand) zones, forming a range-like structure with liquidity runs on both sides. The current push into the 92,400–92,600 region represents a move into premium, where risk to reward for fresh longs becomes unfavorable and selling pressure typically increases.
The interaction with the moving averages further supports this view. Price is extended above the short-term EMA while the longer EMA is still lagging below, a configuration that often precedes a mean reversion move. In bearish or neutral conditions, these extensions into supply tend to attract profit-taking from late buyers and short positioning from more patient sellers.
The rejection wick printed inside the supply zone is particularly important. It signals sell-side interest and rejection of higher prices, suggesting that smart money is distributing positions rather than accumulating. This behavior aligns with the projected path: a short-term pullback, a weak corrective bounce, and then a continuation move lower as liquidity below the range becomes the next target.
On the downside, the 90,200–90,400 demand zone stands out as the primary magnet. This area previously triggered strong buying reactions and remains unmitigated, making it a high-probability destination if price rolls over from supply. A move back into this zone would not be surprising — it would simply complete another rotation within the broader structure.
In summary, Bitcoin is not breaking out it is reacting at supply. As long as price remains capped below the supply zone and fails to build acceptance above it, the higher-probability scenario favors downside continuation toward demand. In this market, patience is rewarded, and chasing strength near supply is exactly where traders tend to get trapped.

At ResistanceBitcoin needs to push higher or it risks rolling over and continuing the larger downtrend.

BITCOIN (BTCUSD): Road to 100k
Bitcoin finally completed a bullish accumulation within
a huge ascending triangle pattern on a daily..
There is a high probability that the market will continue
rising now.
The next strong resistance cluster is 98800 - 101200 area.
I think that it will be reached soon.
❤️Please, support my work with like, thank you!❤️
I am part of Trade Nation's Influencer program and receive a monthly fee for using their TradingView charts in my analysis.

Bitcoin at a Critical EMA Test — Break Higher or Fade Back Price is reacting around the EMA zone near 90,600–90,800, a key dynamic level that previously acted as support before the sharp sell-off. Current price behavior shows hesitation, suggesting the market is at a short-term decision point rather than in clear trend mode. A clean break and sustained close above the EMA would confirm bullish follow-through, opening upside potential toward the 91,600 sideways range, with further extension into the 92,200–92,400 supply zone. However, failure to reclaim the EMA keeps the risk tilted to the downside. A rejection from this area would likely send price back toward the 90,300 demand zone, and a breakdown there could expose deeper liquidity toward 89,800–89,200. Until the EMA is decisively broken, choppy and reactive price action should be expected.

Bitcoin at Range EquilibriumBitcoin at Range Equilibrium: Re-Accumulation for a Push Higher or Another Liquidity Sweep Below?
Hello traders! Here’s a clear technical breakdown of BTCUSD (1H) based on the current chart structure. Bitcoin is currently trading within a broad consolidation range following a strong bullish impulse earlier in the session. After reaching the upper boundary of the range, price faced heavy selling pressure and rotated lower, signaling profit-taking and short-term distribution, not a full trend reversal. Since that rejection, BTC has entered a low-volatility, sideways structure, with overlapping candles and reduced momentum. This price behavior typically reflects balance and absorption, where the market is building liquidity before the next directional expansion. Importantly, there has been no impulsive bearish follow-through, suggesting sellers are active but not yet in full control.
UPPLY & DEMAND – KEY ZONES
Upper Supply / Range High:
The 93,800–94,000 zone remains a major supply area, where previous bullish attempts were aggressively rejected. This is the key level that must be reclaimed for upside continuation.
Mid-Range Resistance (Flip Zone):
The 92,000–92,200 level acts as an important structure flip. Failed acceptance above this zone confirms ongoing range conditions.
Major Demand / Range Low:
The 89,500–89,800 area is a well-defined demand zone and liquidity base. This zone has repeatedly absorbed selling pressure and represents the downside boundary of the current range.
A break on either side of these zones will define the next trend leg.
🎯 CURRENT MARKET POSITION
Currently, BTC is trading near the middle-to-lower portion of the range, where directional conviction is typically weakest. This is a decision area, not an optimal breakout zone, as price can rotate aggressively in either direction. The market is compressing, indicating energy buildup rather than trend confirmation.
My scenario:
As long as Bitcoin holds above the 89,500–89,800 demand zone, the broader structure remains neutral-to-bullish. A successful defense of this demand could lead to a rotation back toward 92,000, and acceptance above that level would open the path for a test of the 93,800–94,000 supply zone. However, if price fails to hold the range low and accepts below demand, this would confirm a liquidity sweep and bearish continuation, exposing lower prices before any meaningful recovery attempt. For now, Bitcoin is ranging and waiting for confirmation, not trending.
⚠️ RISK NOTE
Range conditions often produce false signals. Let price confirm acceptance or rejection at key zones, avoid overtrading the middle of the range, and always manage your risk.

Bullish Continuation Still on the Table After the PullbackBitcoin on the H1 timeframe is currently trading within a broader bullish context, despite the recent sharp pullback from the local highs. The overall structure suggests that price is undergoing a corrective phase rather than signaling a full trend reversal. After a strong impulsive rally toward the upper resistance band, BTC faced profit-taking and short-term selling pressure, which pushed price back toward a clearly defined support zone.
This support area, located around the 90,000–90,200 region, represents a key liquidity pocket where buyers previously stepped in. The reaction from this zone is critical, as it acts as the decision point between continuation and deeper correction. So far, price has respected this support, indicating that sell-side momentum is weakening and that the market may be absorbing supply rather than accelerating lower.
The rejection from higher resistance levels aligns with a healthy market rotation, allowing Bitcoin to reset momentum before the next directional move. As long as price continues to hold above the support zone and does not establish acceptance below it, the bullish continuation scenario remains valid. In this case, the market is likely to rotate higher again, with successive upside targets lining up around 91,500, 92,200, and ultimately the upper resistance near 93,700.
From a structure and liquidity perspective, the recent dip can be interpreted as a pullback to demand, offering stronger hands an opportunity to accumulate before the next expansion phase. A clean bullish reaction from support would confirm this outlook and open the path toward the marked upside targets.
However, a decisive breakdown and sustained trading below the support zone would invalidate the bullish continuation scenario and expose Bitcoin to a deeper retracement. Until that occurs, the technical bias remains cautiously bullish, with the market favoring higher prices after this corrective reset.

Back to the Top of the Broadening Wedge If this Inverse Head and Shoulders fires, this may may mark the beginning of a trend up to channel high within the parallel channels or the megaphone.

BTC short term buy 260114Bitcoin flipped short term bullish like I predicted 2 days ago.
Resistance is at $96,218 (weekly EMA cross)
Support is at $91,824 (daily EMA cross)
Below indicators are all short term
Par SAR: buy
EMA cross: sell, but very close to buy
Supertrend: buy
Stoch RSI: buy
MACD: buy
Weekly chart is still bearish (resistance at $96,245).

BITCOIN Structure Improving - 145k by JULY
BTC is starting to look better. We’ve now printed five consecutive weeks without making new lows, which is exactly what you want to see when a market is trying to base.
Price is holding above the last swing low — yes, it could still dip below it — but for now, directional bias is leaning long.
The Level That Matters
For me, everything hinges on $95.5K.
That level:
Coincides with the monthly mode
Provides structural confirmation
Makes positioning far more comfortable once reclaimed
A clean move above it would strongly support the idea that the market is transitioning from consolidation to expansion.
Positioning Thoughts
I was hoping to get some fills below $79K, but it is what it is.
If BTC decides to move up from here and establishes a new 6-month trend, I won’t complain — especially if that trend opens the door toward $150K over time.
For now, patience paid off. Structure is improving, and the market is slowly tipping its hand.

Is The BTC Bitcoin MONSTER Trade Setting Up? My Trade Plan.🔥 Is Bitcoin’s Next Big Move Starting Right Now?
Another close look at Bitcoin today 👀📊 — and we’re seeing the move we discussed in yesterday’s video starting to play out.
After yesterday’s aggressive volatility ⚡, price has now delivered the break of structure we were watching for. On the 30-minute chart, the market is printing a clear higher high and higher low sequence 📈 — a constructive sign for bullish continuation.
Price is also holding above the Point of Control and value area on the volume profile 🧠📉, which adds further strength to the current structure.
If we stay patient and continue to build positions strategically, as outlined in recent videos, this setup has the potential to develop into something much larger 🚀. Especially if Bitcoin transitions into a higher-timeframe bullish trend — potentially even a broader trend reversal.
That said, it’s still early days ⏳. We don’t assume — we wait for confirmation.
What I’m watching next is a clean break above the previous highs, followed by strong support on the retest 🔁. A successful break and hold above that level would open the door for another high-quality Buy opportunity ✅📈.
Let’s see how price behaves from here.
⚠️ Not financial advice. Always manage risk.

Are tech stocks about to surge? Nasdaq New Highs? The market is very close to making a big move.
We believe the market is still bullish and will likely trend higher.
Today crypto was strong when the market was weak. This could be signaling tech is about to capture some bullish liquidity.
Banks got decimated today, which allows lots of capital to rotate back into tech.
The Nasdaq is lagging and the only indices to not make new all time highs.

BTC Daily Bear Flag - Pullback inboundBitcoin has been trying to consolidate for the past month after falling from it's peak in November of $121k. The structure of this bear flag is 3 months in the making and far from complete - expect a pullback into the $90-91k level in short order.

Bitcoin Ranges as Middle East Tensions Raise Sell-Off RiskBitcoin( BINANCE:BTCUSDT ) has experienced both bullish and bearish moves over the past few days under the influence of various news events, resulting in a clear ranging structure.
One key factor that must be considered for Bitcoin and other risk assets is the escalation of tensions in the Middle East. This situation can act as a catalyst for sudden sell-offs across Bitcoin and the broader crypto market.
Currently, Bitcoin is trading near resistance lines, as well as the Cumulative Short Liquidation Leverage($93,150-$92,970), and has reacted precisely to the Potential Reversal Zone(PRZ) .
From an Elliott Wave perspective, Bitcoin appears to be completing a Double Three Correction (WXY) within this short-term range.
I expect Bitcoin to make another attempt toward the lower line of the ascending channel.
If this level breaks, we should be prepared for a deeper decline toward the Cumulative Long Liquidation Leverage zone($90,360-$89,360).
First Target: $90,773
Second Target: $89,903
Stop Loss(SL): $90,923
Points may shift as the market evolves
CME gap: $88,720-$88,120
What do you think about Bitcoin in the short term? I’d love to hear your thoughts!
Cumulative Long Liquidation Leverage: $87,125-$86,000
💡 Please respect each other's opinions and express agreement or disagreement politely.
📌Bitcoin Analysis (BTCUSDT), 1-hour time frame.
🛑 Always set a Stop Loss(SL) for every position you open.
✅ This is just my idea; I’d love to see your thoughts too!
🔥 If you find it helpful, please BOOST this post and share it with your friends.
