Bitcoin Below a Key Resistance – Day 2👋🏻 Hey everyone! Hope you’re doing great! Welcome to SatoshiFrame channel.
✨ Today we’re diving into the 1-Hour BITCOIN analysis. Stay tuned and follow along!
🪙 On the 1-hour timeframe, Bitcoin is currently ranging below its key resistance zone at $106,590 in a multi-timeframe structure. A confirmed breakout above this level could potentially lead to further bullish momentum toward the next resistance area.
📊 Looking at Bitcoin’s volume, we can see that as price reached this crucial resistance, volume has decreased, showing more selling interest among traders. However, the interesting observation here is that even selling volume itself has slightly declined, and during the latest reaction to this resistance (in the 15-minute multi-timeframe), we witnessed an increase in buying volume.
✍️ The possible breakout scenario for this resistance is quite simple and comes with a small stop-loss range. You can consider entering a trade based on this scenario, but always remember proper risk and capital management.
↗️ Long Position Scenario 1 : Breakout above the $106,590 resistance accompanied by increasing buying volume on either the 1-hour or 15-minute multi-timeframe. If we get a candle setup (Indecision + SMA7) before and after the breakout, it can serve as a valid entry signal.
↗️ Long Position Scenario 2 : Breakout above the $106,590 resistance with rising volume and the formation of a higher low on the multi-timeframe compared to the previous low. In this case, we can enter a long position and set the stop-loss below the potential higher low.
❤️ Disclaimer : This analysis is purely based on my personal opinion and I only trade if the stated triggers are activated .
Bitcoin (Cryptocurrency)

BTC: Decision Zone Ahead After Double Bottom ReversalHi!
Bitcoin has formed a clean double bottom at the daily support zone, followed by a sharp bullish impulse that also broke the descending trendline. This shift in momentum signals that buyers are regaining control in the short term.
Price is now approaching the Decision Zone, a key supply area where the previous breakdown began. This zone will determine whether the current recovery is just a reaction or the start of a larger bullish continuation.
If buyers manage to break and hold above this zone, the chart opens the door for a broader move toward the 113K region, which aligns with the next major liquidity cluster.
Until that breakout happens, this area remains a potential rejection point, so watching how the price behaves inside the zone is crucial.

BTCUSD – Perfect Mid-Channel Touch. Eyes on 110K📉 BTCUSD – Perfect Mid-Channel Touch. Eyes on 110K
BTCUSD – Perfect Mid-Channel Touch. Eyes on 110K 🔁📈
Price bounced beautifully off Channel Support ~98,986 and is now hovering just above Mid S/R at 104,634 . That’s the make-or-break zone .
A move toward Top Channel Resistance ~110,080 seems likely — but watch that interaction closely.
No “traps,” no fluff — this is a textbook channel play.
🎯 Targets Above:
• Target 1: 120–122K
• Target 2: 138.8K
📉 Supports Below:
• Mid Channel: 104,634
• Channel Support: 98,986
• Technical Support: 97,389 → 96,281
⚠️ If BTC breaks below the mid-line again, bears may try to retest the green base. For now — structure holds.
Trading Wisdom 📜
You don’t chase Bitcoin. You position around it.
Let the structure guide you. The crowd reacts — the Professor prepares.
Disclaimer: I’m just sharing wisdom, not instructions. No licenses, no guarantees — just years of trading scars and precision chartwork. Be smart, protect your capital, and don’t copy blindly.
One Love,
The FXPROFESSOR 💙

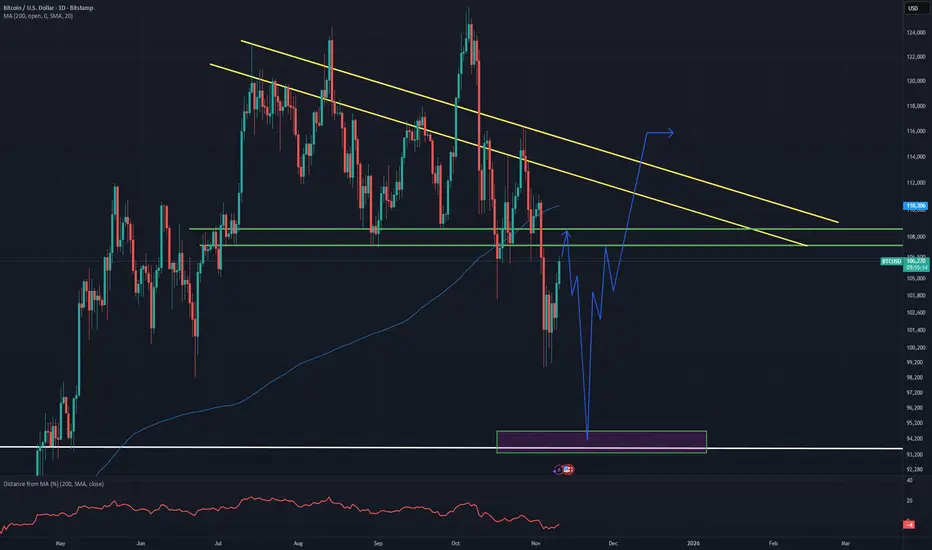
Bitcoin - 94k Price Level attraction A tunraround to the upside and bullish continuation is not very likely form the current 100k levels. Bidding is very weak still and Bitcoin does not show any strength compared to other assets and markets. A bounce up into the 108k range is possible till mid-week followed by a close around 103k at the end of the week and a selloff starting next week down to 94k and a buy back to 103k till the end of the week. The plan shows the movement till 14th of December.
The year could be closed at around 120k ( best case )
Bitcoin - Mid halving Cycle Correction in 2026Bitcoin - Mid halving Cycle Correction possibility like 2021.
Bitcoin performed a mid cycle correction in 2021, of about 50% in only a few weeks just to print a new ATH weeks later. This scenario is very likely to play out when the range around $94k/ CRYPTOCAP:BTC breaks without a Bidding and is invalid when the prive returns above $104k after $94k

TradeCityPro | Bitcoin Daily Analysis #216👋 Welcome to TradeCity Pro!
Let’s dive into the Bitcoin analysis. The market has finally started an upward move, and the triggers we set yesterday have been activated.
⏳ 1-Hour Timeframe
Yesterday, Bitcoin created a smaller range box between the 10,601 and 10,2489 levels, and after breaking the upper range of the box, the price moved up to the upper boundary of the main box at 10,3855.
📊 Volume increased throughout this move, and the strength of the green candles grew significantly. The 10,3855 resistance was also broken, and with the RSI entering the overbought zone, a sharp upward move began.
✅ This upward move continued to 10,6412, and after reaching this level, momentum started to slow down, and RSI exited the overbought zone. The price is now ranging below 10,6412.
🚀 Today’s trigger:
The key trigger for Bitcoin today is breaking the 10,6412 level. If this level is broken, the upward move will continue.
🔽 In case of a correction, if the price forms a higher low above 10,3855, the bullish trend will remain intact, and the next upward leg could start.
⚖️ For a short position, I don’t think we should pursue it yet. We should wait for the trend to turn bearish again. The confirmation for a bearish trend will come if the price stabilizes below 10,3855.
❌ Disclaimer ❌
Trading futures is highly risky and dangerous. If you're not an expert, these triggers may not be suitable for you. You should first learn risk and capital management. You can also use the educational content from this channel.
Finally, these triggers reflect my personal opinions on price action, and the market may move completely against this analysis. So, do your own research before opening any position.

10/11/25 Weekly OutlookLast weeks high: $110,732.65
Last weeks low: $98,972.09
Midpoint: $104,852.37
Bitcoins price action of last week tells an interesting story. The first trading hour of the week marked the weekly high, a sharp decline towards HTF support at $99,000 marked the weekly bottom, to finish the week a late surge recovered some of the losses to end the week at the range midpoint.
The double bottom at range low is a good sign for the bulls in a must win contested area around the $100,000 mark, not only is it a big even level but a HTF key S/R level too. Should the bulls lose this weekly low it opens the door to a $92,000 retest.
For the bulls should this rebound persist a flip of $108,000 is key but there is certainly a lack of spark in the markets at the moment.
I don't see the bulls making any significant ground until the US Government shutdown is announced to be coming to an end. This announcement could happen at any time and so this week that's what I am making plans for, how will the market react, volatility on announcement etc...
Good luck this week everybody!

BTC AnalysisAfter breaking out its uptrend line, Bitcoin is completing the pullback to its trend line, while with the formation of an increasing angle pattern in the same direction with the main trend, we are witnessing fatigue in the trend. There is a possibility that the price will drop to the range of 41 to 43 thousand dollars.

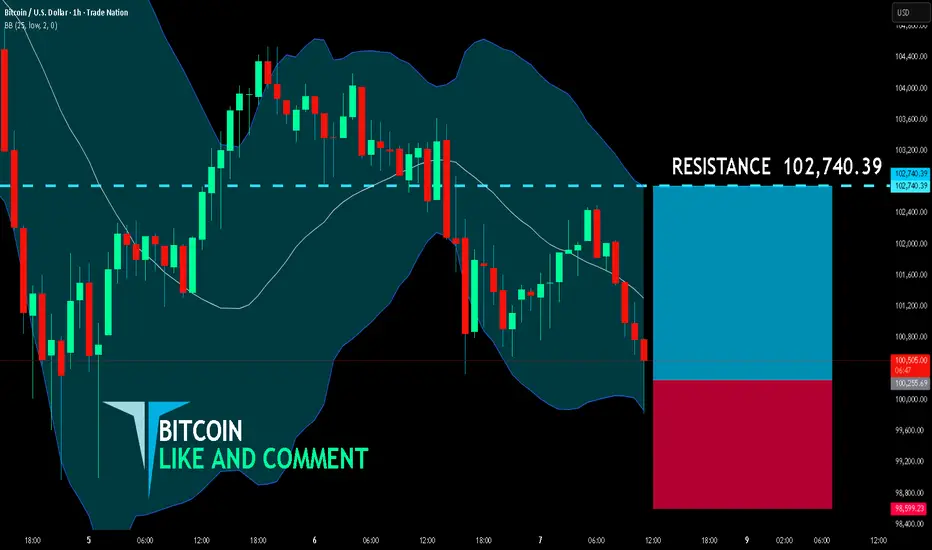
BITCOIN BULLS ARE GAINING STRENGTH|LONG
BITCOIN SIGNAL
Trade Direction: long
Entry Level: 100,255.69
Target Level: 102,740.39
Stop Loss: 98,599.23
RISK PROFILE
Risk level: medium
Suggested risk: 1%
Timeframe: 1h
Disclosure: I am part of Trade Nation's Influencer program and receive a monthly fee for using their TradingView charts in my analysis.
✅LIKE AND COMMENT MY IDEAS✅
BTCUSDT.P - November 10, 2025BTCUSDT.P is currently consolidating near the $106,300 area, showing potential for a short-term bearish retracement. A rejection from this zone could trigger a move lower toward the $105,440 support and the $104,300 profit level (short). However, a decisive breakout and close above $106,660 would invalidate the short setup and open the path for a continuation higher toward the $108,280 profit level (long).

BITCOIN Did the 1W MA50 just save the day again?Bitcoin (BTCUSD) just closed last week above its 1W MA50 (blue trend-line) even though it broke below it during the day.
Since the March 13 2023 break-out above the 1W MA50, this is the 4th time that BTC breaks below it but manages to close the 1W candle above it. All of those times (including the additional one of September 11 2023), marked market bottoms, Higher Lows for the 3-year Channel Up and initiated the Bull Cycle's strong rallies.
However every rally has been weaker and since the first one topped in March 2024, we have a huger Bearish Divergence on the 1W RSI of Lower Highs against BTC's Higher Highs, showcasing loss of strength for the trend. A natural feat however, as the Bull Cycle tends to be stronger on its start as it rebounds violently from the market bottom and less strong towards the end as it matures and big positions already start to take profits.
But is this the end of the Cycle? The 4-year Cycle Theory, the DXY bottoming, the 1W RSI Bearish Divergence among others, all say 'yes'. But the Bear Cycle can only be technically confirmed when the market closes that 1W candle below its 1W MA50 and so far it hasn't. Is that enough to rely your strategy on from this point onwards?
So has the 1W MA50 just saved the day again for Bitcoin? Feel free to let us know in the comments section below!
-------------------------------------------------------------------------------
** Please LIKE 👍, FOLLOW ✅, SHARE 🙌 and COMMENT ✍ if you enjoy this idea! Also share your ideas and charts in the comments section below! This is best way to keep it relevant, support us, keep the content here free and allow the idea to reach as many people as possible. **
-------------------------------------------------------------------------------
💸💸💸💸💸💸
👇 👇 👇 👇 👇 👇

BTC to pump againif BTC can break above the resistance at 108k and the falling wedge then pump should be fast

GOLD gaining strength.GOLD has been climbing back UP since market open. Once it BreaksOut of the RESISTANCE, we could possibly reach new highs this week or coming week.

Bitcoin Daily Outlook: Support and Resistance in FocusHey Guys,
Looking at Bitcoin on the daily chart, the 105,000 to 98,000 levels are strong support zones. This means that as long as the price does not fall below these levels, a sharp decline in Bitcoin is unlikely.
The price touches these areas, but whales prevent it from breaking lower with strong buying, pushing it back up again.
The 113,000 – 116,000 levels are strong resistance zones.
As long as Bitcoin does not fall below 98,000, my target remains 113,000.
Currently, Bitcoin is trading at 105,887. Once my target is reached, I will provide updates.
Every single like I receive from you is my greatest motivation to share these analyses. I sincerely thank everyone who supports me with their likes.🙏

Crucial level for $BTCFor CRYPTOCAP:BTC I'm watching this $108,000-109,000 level for a reaction
Very bullish if the weekly reclaims and closes above, however we are very early in the week to talk about this scenario

We are NOT finished.Weekly close has come in and, as expected, BTC has closed above the band once again.
Since the start of this cycle, Bitcoin has had the following pullbacks:
September 2023: 21%
August 2024: 34%
April 2025: 33%
November 2025: 21%
Tell me, people—what has changed? Has Bitcoin done anything different from what it’s been doing all cycle?
NO!
Yet 95% of sentiment is extremely bearish. The other 5% who aren’t bearish are patting themselves on the back because they “called the top”—you know, the same “top” everyone is staring at, the same top that can be calculated using basic math from the last two cycles.
Since I joined this space, I have NEVER seen sentiment this bad after only a 20% pullback. Complete madness. The only time I saw emotion this raw was during the COVID crash.
This level of bearish sentiment is what you find at the BOTTOM of rallies, not the top.
The idea that the top is in just because of “cycle length” is invalid—especially when EVERYONE is thinking the exact same thing. It’s never that easy with Bitcoin.
Mark my words: it WILL rally above 200k in 2026, and everyone who sold this year will be buying back in higher. That’s the nature of these markets.
Every cycle, you have to stay grounded, stick to the technical data, and ignore all the noise.
The technical are still holding strong—we are NOT finished!

WATCHING FOR CLOSE PRICE TODAYMorning folks,
So, pullback to 106K area has happened rather accurately. D. Trump once again has made a verbal intervention with promise of 2K and shutdown end, but this is too early to believe. As usual no one D. Trump promise has made a long lasted effect. All of them were reversed in a few days.
No Supreme Court decision yet on tariffs, now it is appeared that it will be not a 2K in cash but just tax adjustment, shutdown is still lasting and liquidity issues remain. So, I would say - it is too early to celebrate.
Meantime, on technical side we have clear signals. First is, if market will close today under 105.5K - we get daily bearish grabber. As you can see on 4H chart - it will appear right around strong resistance area. So, it might happen, that we will have to go short instead as market could drop again under 100K area...
Thus don't relax and don't believe in this suspicious euphoria, everything could change in a blink of an eye. Still, upward action above 108K could confirm the bullish sentiment.

#BTC Time to Buy ?!I believe We could have another downside move , and then we can have a buy position on it as Scalp . for 6-15%
Added in watchlist .

Mastering Trading Psychology; Why Mindset is the toughest skillWelcome all to another post.
In this article we will dive into the process of Mastering Trading Psychology.
1) What is Trading Psychology:
Trading Psychology, it is your mindset. It is what you think, how you feel, what you need to do, what you want to do. It is a mixture of thoughts, future actions, emotions and past, present or future behaviors that influences your present self in making good, or bad decisions in the market.
It can be considered a “strategy” but leans more to a “skill” It’s about what your thought process is when you are under pressure.
Everybody, investor, gambler, trader, swing trader, day trader, scalper and holders, bring their own personalities & habits into the trading space. Whether it’s impatience, or patience, fear or greed, confidence or impulsiveness, or discipline. These mental sets determine how frequently you can follow your edge and how well you can manage wins, losses and uncertainty.
Trading psychology is the framework of the mind. It works for you or goes against you. Both are under your control to choose from. A strong, stable, clear mind keeps you going. A weak, broken, cluttered mind keeps you falling.
Ultimately, to master trading in psychology, you need to master yourself.
2) Pros and Cons of Trading Psychology:
Pros:
The pros/benefits of Trading Psychology, once it is mastered, is simple.
You understand the game. You understand the process. You understand why you lose, why you win, why manipulation takes place and why you trade it.
It is a skill that is developed through patience and perseverance along with constant practice.
Like every other skill, it demands TIME, ENERGY, and constant Trial and Error of failures, wins, adjustments and so on. It isn’t something that can be taught or learned once, except for those who learn to recognize and leverage their mental strengths & weaknesses can truly master it over time.
Cons:
Trying to master Trading Psychology means you need to LOSE. You need to experience loss after loss after loss after loss. You need to fail many times. Every time you fail, you understand how to take control of your emotions, you learn where things went wrong, you learn how to build your edge.
But it’s not always about losses, it’s about gains (wins )too. You need to maintain a stable status of emotions whether you win or lose. You can’t show anger, you can’t show excitement. Because both will come back at you with another loss.
This means you cannot allow yourself to be ruled by any emotion, positive or negative. It can be a long uncomfortable process that can take years to master. Sometimes even decades.
What makes it more challenging is that trading psychology does not exist in isolation.
Psychology outside of trading must be mastered too. How you think, act, live, every single day.
- We will explore this topic further down the article.
3) Why it is important in the trading space:
Psychology is an essential topic that must be taught and considered. Because without it, you will not succeed. Without self-control, or a strong mind, trading will become nothing more than just gambling like a slot machine.
It's a skill that many overlook. With it, you are aware of what works and what fails. It allows you to step back and re-assess the next trade instead of forcing it.
The end goal is to make money, but to even do that you first have to protect your capital. Only take A++ Set ups (High confluence/probability set ups) and avoid any traps involving emotions like: Fear of Missing Out (FOMO) or the “I just need 1 good pump” (One Big Win) Mindset.
With it being in the trading space, it gives users the ability to pause, re-assess and question your decisions on the trade you are about to take.
It helps to mention, “Is this an A++ Setup?” “Does it align with my strat, my edge, my goals?” If it does not and you decide not to take it, you save yourself a loss of capital and have made a win of improved trading psychology.
It assists you in distinguishing the difference between good/bad trades. Not on the result but the process. It keeps you grounded.
4) How to Master Trading Psychology:
Just because it is difficult & challenging, does not mean it is impossible.
First step – building discipline through consistency and structure.
Ensure you have a clear trading plan set up. One that defines your edge or can be adjusted to find your edge. Commit to following it no matter what the market is doing. Pumping, Dumping or consolidating.
Consistency in action will build mental strength.
Secondly, you must work on emotional control. Understand and be focused on how you feel when you experience fear, greed, or overconfidence. These emotions push you off your plan if you let them take over.
Each time this happens, you must log it. That way you can accumulate data and self-awareness.
With that, everyone says this. BackTEST or at least forward test you strategies extensively.
Keep a detailed journal that has a good list of questions that you must answer after each trade. Be brutally honest with yourself. Don’t hide losses because you have already hit 10 in a row. Log them all down. This way you will then be able to recognize emotional triggers and recurring patterns appearing that are holding you back.
Being able to recognise them is the first step to controlling them. OBSERVE YOURSELF.
While this takes place, you must begin to build trust in your system (strategy) and in yourself. You will see how your actions and choices line up with your plan. That way your confidence will shift from emotions to process driven.
Last one is patience. The hardest yet most critical psychological skills. Take ONLY A++ set ups, for example a set up that has 4 confluences or 5 lining up. Doing this trains your mind into avoiding impulsive behavior or falling into FOMO based environments.
To see another deep dive into mastering trading psychology, review the post below to determine which mindset you currently have. Are you a trader? Or are you a gambler.
5) How Psychology in our daily lives affects our ability to trade:
Trading Psychology is an interesting concept, but so is psychology in general.
The human mind is weak and for it to be strengthened, it takes time & self-awareness.
A weak mind won’t get you anywhere.
Psychology is not a simple one sentence definition. It can mean many things, or many situations.
It is a critical role in our life, it shapes our emotions, reactions and choices. It can lead us to self-sabotage or it can lead us to success.
If you cannot control your psychology outside of trading, you won’t be able to control it inside of trading. By this I mean daily emotions.
For example:
Imagine an individual experiences a breakout, they are sad, they are angry, they are emotionally drained and hurt. Then they go off to trade. They will LOSE.
This is because when the mind is in an uncomfortable state, it seeks a dopamine hit, and when they associate a win in trading = dopamine hit, they naturally turn towards trading. They want to feel that dopamine hit, so they can feel good again. But then they are no longer following their edge.
This destroys discipline, objectivity and focus.
This is not just tied to relationship breakups, but everything in our day to day lives. If you experience a bad day at work, failed an exam, argued with family, or facing a stressful time. If you bring unresolved emotions, thoughts and feelings into the trading space, trading just becomes a big emotional outlet.
Psychology appears in every action we do, EVERY day. “I need to drink water” I will get water. I see soda, “I now want soda.”
The mind now as switched completely from the main objective “Water” to soda. If you cannot control your mind to stick to what is right, then you will not master trading psychology.
The better control you have over yourself, & your mind, the more consistent and rational your trading decisions will become.
KEY POINTS:
1) What is Trading Psychology:
- Trading psychology is the foundation of every mental action. You must master yourself before mastering the market.
2) Pros & Cons of Trading Psychology:
- Trading Psychology cannot be mastered without failure, each loss has a lesson, that lesson is based around strengthening your mind with emotional control.
3) Why it is important in the Trading Space:
- Without a strong mind, trading turns into gambling, you must become disciplined and maintain self-control. This splits pros from the gamblers.
4) How to Master Trading Psychology:
- Right to the point: Consistency & discipline, emotional awareness, journaling, and most importantly, being patient. These are core aspects of mastering your mindset and obtaining the right psychological discipline.
5) How daily psychology affects trading:
- The way you manage your everyday emotions outside of trading mirrors the way you will end up reacting to the markets.
Control your life, then control your trades.
Psychology is a great skill, but it’s only part of 3 keys that will lead you to success. Find out the 2 other keys below:
Thank you all so much for reading - I hope this post brings a lesson into everyone's trading journey.
I am aware that this is a big long article, however Trading psychology goes even deeper - I have summarized my knowledge and research that I have obtained over time and summarized it.
Please let me know if any of you would like an a post on a specific topic.
I'd love to provide more for the community!

BTCUSD – Signs of Recovery Within the Downward Channel?Currently, BTC is moving within a clear descending channel on the 4H timeframe, but bearish momentum has started to weaken. The 99,600 USD zone is acting as a key support level , where strong buying pressure tends to appear whenever price approaches this area.
The price structure suggests a possible retest of this support zone , followed by a rebound toward the upper trendline of the channel around 105,000 USD. The formation of higher lows in the short term indicates that buyers are gradually regaining control of the market.
I expect BTC to hold above 99,600 USD and start forming a short-term bullish reversal . If price breaks above the 105,000 USD resistance zone, the uptrend will likely be confirmed, opening the way toward 108,000 USD in the upcoming sessions.
Main Scenario:
Prefer Buy positions near 99,600–100,000 USD, taking short-term profits at 105,000 USD.
The bullish outlook remains valid as long as price holds above 99,000 USD.

No soup for you, come back 1 yearif this 35 bar monthly cycle holds up like it has in the 2 previous cycles, top is in. I was expecting a better performance out of btc this cycle but my bias has changed as we have reached q4. the monthly 50 simple moving average aligns with the top of the previous cycle putting btc at a low of around 70k in the coming year.
3 years up, 1 year down, rinse and repeat.
let me know what you think will happen. is it different this time around? or is pattern about to repeat?

LINK LONG — FROM MATH TO MARKET STRUCTURE: An Extensive AnalysisTraders,
In my latest BINANCE:LINKUSDT analysis I started my thesis with " I BELIEVE THE CRYPTO MARKET IS SETTING UP FOR A BIG, BIG, BIG DUMP! NOT JUST LINK! "
It wasn’t coincidence that I wrote those words in caps lock. The market was whispering louder than usual: not in price, but in data. Every metric pulsed in rhythm, like the heartbeat of a system about to release its tension. The numbers weren’t random; they were poetry in motion, quietly syncing toward one inevitable point. Sometimes, data doesn’t just inform — it sings. And when it does, your fingertips start typing before your mind even realizes what the melody means.
Now we’re back — same chart, same logic, but a different side of the market.
I’m going to analyze it the same way I did before — step by step, math-backed, structure-based, and logic-driven.
Only this time, it’s even more extensive.
For free. For nothing. So that you, the people who actually care to learn, can start to see how markets truly work. How they breathe, trap, rotate, rebalance — and how every candle hides intent.
I believe the BINANCE:LINKUSDT dump might be over — for now, at least — and that the market is slowly starting to build upward momentum. This post is not a quick “looks bullish” statement. It’s a structured walkthrough from mathematical foundation to market structure, liquidity, and order flow, showing why the $20–$21 region might become the next key target before a rotation lower.
Let’s go step by step.
Step 1 – Is There a Mathematical Reason to Say the Current Auction Might Be Finished?
By “auction,” I mean the move from a clear swing high to a clear swing low where sellers were in control. Markets move in auctions — from high to low, then pull back, then extend again. To determine whether a sell auction is finished, we measure how far it has retraced and extended.
After the 10 Oct liquidation event, price printed a clean new high — more valid than the liquidation spike. That’s point A (~20.15). From there, it sold off to point B (~15.70).
So our first auction is:
A → B | Direction: Down
Step 2 – Measuring the Retrace
Since the move was downward, I drew a Fibonacci retracement from A to B (high → low). nThat gives us retracement levels above price on TradingView.
Price retraced almost perfectly to the 0.786 level (~19.23) — not shallow (0.382 or 0.5), not extreme (0.886), but deep enough to classify as a “normal” yet decisive retrace.
That means sellers regained control after a 0.786 pullback, a key ratio in the Fibonacci family.
Step 3 – What Does a 0.786 Retrace Usually Lead To?
Here’s where the Fibonacci logic becomes meaningful. The 0.786 level is derived from the square root of the golden ratio inverse: √(1/φ). Its natural mirror on the other side of price is √(φ), or 1.272.
That’s why 0.786 retraces often project toward 1.272 extensions — the two are mathematically linked. Beyond that, the next probable extensions are 1.414 and 1.618.
So, for a 0.786 retrace, the Fibonacci extension ladder is:
Primary: 1.272
Intermediate: 1.414
Extended: 1.618
Step 4 – Did BINANCE:LINKUSDT Reach One of These Fibonacci Targets?
To check that, we reverse the Fibonacci — draw it from B to A (low → high). That prints the extension levels below the swing low.
Price hit the 1.414 extension almost perfectly before structure began shifting:
Lower lows stopped forming
Higher lows began to appear
Small higher highs emerged on lower timeframes
That’s a structural sign the sellers exhausted their leg — a textbook confirmation that the 1.414 zone completed the auction.
Step 5 – Confirming the Auction
The A → B auction retraced to 0.786, extended to 1.414, and then reversed in structure. This matches the Fibonacci expectation for a completed wave.
If the retrace had been 0.886 instead, we’d likely expect continuation to 1.618 — but since it was 0.786, the 1.414 tap followed by reversal fits perfectly.
✅ 0.786 retrace → 1.272 / 1.414 / 1.618 extension
✅ 1.414 tapped → structure reversed
We can reasonably call this auction finished.
Step 6 – Confluence from the Smaller ABC Swing
After the main leg, the market made a small rally and a lower high — point C. Using the Fibonacci Extension tool (A → B → C), we project this smaller swing.
Interestingly, the ABC projection lands exactly on the same 1.414 zone as the larger A → B measurement. That’s two independent Fibonacci constructions converging on the same price.
From a math perspective, this isn’t coincidence — both patterns use the same ratio family.
It’s proportion — the geometry folding back onto itself.
Nature’s Geometry on a Price Chart
This is where Fibonacci goes beyond numbers. The same proportions that define growth patterns in seashells, tree branches, sunflowers, hurricanes, and galaxies are present in the market’s structure.
Two distinct swings produce the same 1.414 target.That’s natural proportion — mathematical harmony showing up in price behaviour.
It’s not random. It’s geometry repeating itself.
Part 2 – The Structural Context: Liquidity and Value
We’ve identified our Potential Reversal Zone (PRZ) using Fibonacci confluence. Now let’s look inside the structure and the market’s underlying “memory.”
We’ll answer three questions:
Where does liquidity sit — which levels might the market hunt next?
What is the order flow showing — is there absorption or continuation?
What do the next extensions project mathematically?
1. Liquidity via TPO (Market Profile)
TPO (Time Price Opportunity) shows how much time price spent at each level. Clusters = acceptance and value. Gaps = imbalance and rejection.
Around $19.00, during TPO periods G, H, N, and O, price built acceptance but didn’t explore higher. That created a weak high — a level that often acts as a magnet for future liquidity hunts.
Another, slightly weaker high sits near $20.00, which is still unfinished.
And as James Bond said, “I never leave loose ends.” Neither does the market.
2. Anchored VWAP Confluence
Anchoring VWAP from the major swing high shows the blue AVWAP aligning almost perfectly with that $20.00 region. That gives strong confluence between volume-weighted value, liquidity, and structure.
3. Low Volume Nodes (LVNs) and Imbalance
Using the Fixed Range Volume Profile (FRVP) from A → B reveals clear low-volume zones — “air pockets” where price moved too fast to build volume.
Between $20.00 and $20.50, there’s a notable LVN, meaning price skipped over it during the selloff.Such zones often act as magnets — the market tends to revisit them to rebalance unfinished business.
Now we have three layers of confluence:
Weak high at $19.00–$20.00
Anchored VWAP aligning with $20.00
LVN pocket at $20.00–$20.50
That defines a clear liquidity and target zone.
Structure and Confluence Summary
PRZ established through Fibonacci symmetry
Structure showing higher lows and early accumulation
Confluence cluster between $20.00 and $20.50, combining:
Weak highs
Low-volume node
Anchored VWAP
Market Profile imbalance
The setup aligns across math, volume, and structure.
Part 4 – Order Flow: What Lies Beneath the Candles
From the outside, price action looks calm — clean candles, defined Fibonacci levels, and structure that seems perfectly balanced. But the real story is hidden underneath, inside the Order Flow.
Every candle represents a battle — between aggression and absorption, buyers and sellers, liquidity and imbalance. Understanding who is winning that battle tells us whether a move is genuine strength or a trap waiting to unwind.
Order Flow allows us to look beneath the surface and see where transactions are actually happening — where volume clusters, where buyers are absorbed, and where sellers are defending. It’s the market’s heartbeat.
The Current Picture
Here’s what we see right now on BINANCE:LINKUSDT :
CVD (Cumulative Volume Delta) — across both spot and futures (stablecoin- and coin-margined contracts) — is making lower highs, showing persistent sell aggression.
Yet price itself is not breaking down. Instead, it’s holding steady and even forming higher lows.
Meanwhile, the A/D (Accumulation/Distribution) line is rising, indicating that despite heavy selling pressure, buyers continue to absorb and accumulate.
That means one thing:
aggressive sellers are being absorbed by large passive buyers quietly taking the other side.
Recognizing the Setup
Let’s break down the pattern:
CVD ↓ → sustained sell aggression
OI ↑ → new short positions entering the market
Price ↔ or ↑ slightly → absorption and accumulation taking place
When these three align:
It often signals a short trap forming.
Sellers feel in control because CVD shows selling dominance.
In reality, their aggression is being absorbed by larger passive buyers.
Once that liquidity runs out and buyers stop absorbing, shorts are trapped.
Those trapped shorts must cover — triggering a fast, aggressive short squeeze upward.
Also: CVD on Stablecoin Margined Contracts remains flat while Stablecoin Margined Open Interest rises — showing aggressive shorting being absorbed by larger buyers. Price stability suggests accumulation, not weakness. Since OI stays high, those shorts are still in the game, meaning their positions haven’t been closed yet. If price starts to move up, they’ll be forced to cover — setting up the conditions for a short squeeze.
Absorption in Context
Absorption isn’t random — it’s the footprint of strong hands quietly taking in sell pressure without letting price break down. While most see weakness, they’re actually witnessing controlled accumulation.
Here, price holds steady as CVD trends flat and OI stays high — meaning aggressive shorts are still in the game, being absorbed by larger buyers. Every new short adds fuel to the spring.
When that pressure releases, it doesn’t drift — it snaps. Shorts are forced to cover, triggering a sharp, emotional squeeze toward the next liquidity zone around $20–$20.50, where Fibonacci confluence and a weak high align.
This is where microstructure meets the macro picture — absorption building the base for a violent move higher.
Part 5 – Fibonacci Extension Confirmation
To justify the $20–$21 target mathematically, we apply one more Fibonacci extension —
from the last swing low to the recent high, projected forward.
The 1.618 extension aligns almost perfectly around $20.00, adding strong mathematical confluence to our previously defined liquidity and structure zone.
That makes $20.00–$20.50 a textbook target cluster — a Fibonacci, liquidity, and volume alignment.
Final Outlook – The Path Ahead
Based on all the combined data:
Fibonacci structure shows completion and new expansion potential
Market Profile and VWAP reveal unfinished business around $20–$20.50
Order Flow confirms absorption and hidden accumulation
The 1.618 Fibonacci projection reinforces this level as a natural mathematical destination
I believe the market will squeeze upward toward $20–$21, taking out the weak high and the LVN pocket — and once that liquidity is collected, rotate back down to restore balance.
The setup is mathematically justified, structurally valid, and order-flow supported — a complete picture of how Fibonacci geometry, structure, and liquidity align to reveal where the next phase of this auction may unfold.
If price slips lower instead, the key level to watch is $12.90 — the latest 1.618 extension from the initial wave we measured earlier. That remains the deep liquidity and structural boundary where balance could be restored.
Last words.
Everything we have mapped — Fibonacci structure, confluence, liquidity, and absorption — means nothing without the psychology behind it. The market is not just math and candles; it is a mirror of collective emotion. Every trapped short, every breakout chase, every hesitation is human behaviour written in numbers.
When confidence is at its peak, risk is usually greatest.
When fear dominates, opportunity hides in plain sight.
That is why sentiment often reaches its extreme just before reversals. Most traders only see what is already visible, not what is quietly building beneath the surface.
So next time you scroll through social media or read the news about what everyone expects, remind yourself of this:
When everyone sees the same breakout, the trade was over hours ago.
And the markets whisper long before they speak.
From the depths of the sands,
ThetaNomad
------------------------------------
If you enjoy this kind of analysis, leave a like and drop a comment. I don’t ask for anything — I just want to help more people learn to look behind the charts, to see the story that price and volume quietly write together.

$BTC Possible TOP / Manipulation & then Distribution?Accumulation - Manipulation - Distribution
3 phases, and the manipulation part may be coming..
