Bitcoin is going to the hell???hi follow me , boost this post and read
everything shows me that bull trend is over , weakness in highs , candles and the momentum
the targets for retracement is 83 to 74 and after that 50k
i know its hard to hear that but this is market he do what he wants so accept it.
thank you. i reply to questions anytime.
Bitcoin (Cryptocurrency)

IS BITCOIN READY FOR A HUGE PUMP?!!!!!! (must see) Yello Paradisers! Enjoy the video!
And Paradisers! Keep in mind to trade only with a proper professional trading strategy. Wait for confirmations. Play with tactics. This is the only way you can be long-term profitable.
Remember, don’t trade without confirmations. Wait for them before creating a trade. Be disciplined, patient, and emotionally controlled. Only trade the highest probability setups with the greatest risk to reward ratio. This will ensure that you become a long-term profitable professional trader.
Don't be a gambler. Don't try to get rich quick. Make sure that your trading is professionally based on proper strategies and trade tactics.

BTC long-term TABitcoin is still in a very bearish formation, there has been no change in trend direction since October last year.

BTC/USD - Advanced Wyckoff Distribution Analysis: Targeting $61K
Hello Traders,
I’m sharing my latest outlook on Bitcoin, utilizing a pure Wyckoff Method approach to identify the current market cycle. We are currently witnessing a textbook Distribution schematic playing out.
Technical Breakdown:
Schematic Identification: After a prolonged consolidation, the price failed to sustain momentum above the $71K-$72K zone.
Phase C & LPSY: Following the "Test" of the highs (Upthrust), we saw a clear rejection. The subsequent LPSY (Last Point of Supply) confirmed that the path of least resistance is now to the downside.
Current Trade: I am currently in a short position. Stops have already been moved into profit to ensure a risk-free ride to the target.
Target: My primary objective is the $61,900 region, where we expect to see the completion of this markdown phase.
About the Analyst: I am Daniel, a Wyckoff specialist with 12 years of experience in the financial markets. My expertise lies in deciphering institutional footprints and market cycles. In a world of indicators, I prefer to focus on the only thing that matters: the relationship between Supply and Demand.

BTC: The "Invisible Wall" at $70k (Why We Flush to $59.8k)The retail narrative is that Bitcoin is "consolidating" at $70k. The On-Chain data says Bitcoin is DISTRIBUTING . We just hit an "Invisible Sell Wall" driven by three massive structural failures. This is not a dip to buy; it is a Rational Deleveraging triggered by a $6.3B supply shock that the market cannot absorb.
1. THE ON-CHAIN REALITY (SUPPLY SHOCK) ⛏️
• Miner Capitulation: Miners transferred 90,000 BTC ($6.3B) to exchanges in the last 72 hours.
• Historic Magnitude: This is the largest miner sell-off since 2024, signaling they are selling to survive as margins tighten.
• The Impact: Spot demand cannot absorb $6.3B in selling pressure without a significant repricing event. The "Wall" is real.
2. THE MACRO & STRUCTURE 📉
Bearish Triggers:
• Yield Spike: US 10-Year Treasury Yields spiked to 4.17% . When risk-free rates rise, capital flees crypto.
• Capital Flight: While BTC is down -3%, high-beta alts (BNB, ZEC, SUI) are down -6%+, signaling a "Risk-Off" environment where liquidity exits to USD, not Alts.
• Broken Support: We lost the 200-Week EMA at ~$68,000, a major secular bull/bear line.
The Conflict:
Retail is waiting for "Alt Season" while Institutions are executing a "Flight to Safety." The divergence between the Miner Sell Wall and retail hope creates a trap at $66k.
3. THE TRADE SETUP 🎯
🔴 Scenario A: The Rational Deleveraging
• Trigger: Rejection at $67,500 - $68,000 (Retest of broken 200W EMA support)
• Entry: $67,500 zone (selling into the Miner Wall)
• Target 1: $62,000 (October Support Cluster)
• Target 2: $59,800 (The "Weak Low" Liquidity Sweep)
• Stop: 4H close above $70,500 (Invalidates the Miner Capitulation thesis)
🟢 Scenario B: The Reclaim (Low Probability)
• Trigger: Daily close back above $70,000
• Context: Requires Miners to stop selling and Coinbase Premium to flip positive
• Target: $74,000 range high
MY VERDICT
The "Miner Wall" is too heavy. The market needs to clear the leverage at $59,800 before the bull run can resume. I am positioning SHORT into any relief rally near $67.6k. Confidence: 75% Bearish

bitcoin keeps going down & downmore downward impulse for bitcoin as things are not looking very bright for crypto investors, every upward correction is a chance to exit COINBASE:BTCUSD

Is Bitcoin About to Complete Wave C and Explode Upward?First of all, make sure to pay close attention to the timeframe — this analysis is based on the 1-day timeframe.
Bitcoin appears to be approaching the completion of wave C within the current corrective structure. If this count plays out as expected, we could see the end of the corrective phase soon, followed by a potential bullish reversal. The next upward move may develop either as a new impulsive wave to the upside or as an X wave within a larger corrective structure. In both scenarios, the probability of a bullish continuation increases once wave C is fully completed and confirmed.
On the chart, two key trendlines are marked in red. These trendlines are critical for short-term price direction. A confirmed breakout above the first trendline would be an early signal of strength and could open the path for price to move toward the second trendline. The second trendline acts as a higher-level dynamic resistance, and the reaction there will provide further confirmation of whether the market is transitioning into a stronger bullish phase.
A clearly defined support zone is also highlighted on the chart. This area represents a potential accumulation region. Rather than entering with a full position at once, a DCA (Dollar-Cost Averaging) strategy is recommended within this support range to manage risk more effectively and reduce the impact of short-term volatility.
Upside targets are specified on the chart as well. As part of proper risk management, it is advisable to secure the trade at the first target by moving the stop loss to breakeven. This approach allows traders to eliminate downside risk while keeping exposure for potential continuation toward higher targets.
As always, wait for confirmation, manage your risk carefully, and avoid overexposure in volatile conditions. This analysis is based on the current wave structure and trendline behavior, and it should be reassessed if the market invalidates the outlined scenario.
If you have a coin or altcoin you want analyzed, first hit the like button and then comment its name so I can review it for you.
This is not a trade setup, as it has no precise stop-loss, stop, or target. I do not publish my trade setups here.

ETH: The $80M "Whale Trap" (Why $1,930 Is Next)Most traders are celebrating the $80M Long that just opened on Hyperliquid.
They think this is a "Bullish Whale."
They are wrong.
My on-chain analysis confirms this is a classic Liquidity Hunt . Here is the data retail is missing:
1. The "Bait" (Hyperliquid Whale)
A fresh wallet (0x6C85) opened an $80.9M Long at ~$2,039 .
The Flaw: They used 20x Leverage .
The Math: Their Liquidation Price is mathematically pinned at ~$1,930 .
2. The "Hammer" (Trend Research)
Simultaneously, institutional fund Trend Research deposited 35,000 ETH ($80.8M) into Binance.
The Reality: While the Speculator is Longing on-chain, the Institution is preparing to Sell Spot on Binance.
The Goal: Drive the Index Price down to $1,930 to force-liquidate the Hyperliquid whale and grab that $80M liquidity pocket.
3. Technical Structure (Bearish)
Market Structure: We are trapped in a Converging Wedge with a "Bearish Order Block" overhead at $2,148 .
Funding Rates: BitMEX spiked to +0.049% (Extreme Greed). When funding goes positive during a downtrend, it signals a "Bull Trap."
🎯 The Trade Plan
I am betting AGAINST the whale. The path of least resistance is a flush to the liquidation magnet.
❌ SHORT ZONE: $2,100 - $2,125 (Rejection at Bearish OB).
📉 TARGET 1: $1,930 (Whale Liquidation).
📉 TARGET 2: $1,600 (The "Air Pocket" Vacuum).
Verdict: Do not long here. Let the institutions finish their war. We buy the blood at $1,600 , not the bait at $2,039 .
Safe Trading,

SOLT/SBIT Trading Pair - 15 minuteThis is the SOLT/SBIT trading pair 15 minute chart. Trade 2x Solana long or 2x Bitcoin short ETF's in your brokerage account. We are trading SOLT because it generally outperforms Bitcoin on the upside. As there is no -2x Solana short ETF, we use SBIT for the downside. BEWARE! As these are leveraged ETF's you can get wrecked in a heart beat. Manage position size and use stop losses to limit risk! Not Financial Advice.
We are now trading at the bottom of a horizontal channel just off All Time Lows for the pair. Stochastic RSI is low, RSI is oversold, and the BlackCat indicator is nearing the end of a down trend. The horizontal channel coincides with a Bull Flag pattern on the Solana 1 hour chart. A buy of SOLT at $2.60 with a tight stop loss at $2.52 risks -2.90% with Solana target of $110 is about 44.5% upside potential for SOLT target of $3.74
See my 1 hour Solana chart for more technical analysis of the Solana trade.
WARNING! HIGH RISK, HIGH REWARD POTENTIAL.

When to Close Losers and When to Hold WinnersClosing losers and holding winners is not a mindset problem. It is a structural one. The decision should come from whether the market has invalidated your narrative or continues to support it. Emotion enters when that framework is missing.
A losing trade should be closed when the reason for the trade no longer exists. In practice, this happens when structure breaks beyond the point that defined risk. If price violates the level that anchored the setup, the market has proven a different story. Holding beyond that point turns analysis into hope. The stop is not there to protect comfort. It is there to protect logic.
Losers also need to be closed when market conditions change.
Volatility expansion, liquidity drain, or session transitions can invalidate a setup even if price has not reached the stop. If execution relied on clean participation and that participation disappears, staying in the trade increases risk without increasing probability. Capital is better preserved for conditions that support the original thesis.
Winners require a different lens. A trade should be held as long as structure continues to support the direction. Higher lows in an uptrend or lower highs in a downtrend indicate that control remains intact. Premature exits usually occur when traders focus on unrealized profit instead of structural confirmation.
Partial profit-taking can be used to reduce pressure, but full exits should align with objective signals. Momentum decay, failure to progress toward the next liquidity objective, or a clear structural break against the position are valid reasons to reduce or exit.
Another consideration is location. When price reaches major opposing liquidity or higher timeframe levels, risk increases. Holding through these areas without reassessment often leads to giving back gains. Exiting or reducing exposure here is a strategic decision, not a fear-based one.
The discipline lies in treating losses and gains symmetrically. Both decisions are governed by structure, liquidity, and environment. When trades are managed by narrative instead of emotion, losses remain controlled and winners are allowed to develop. Over time, this alignment does more for performance than any adjustment to entry technique.

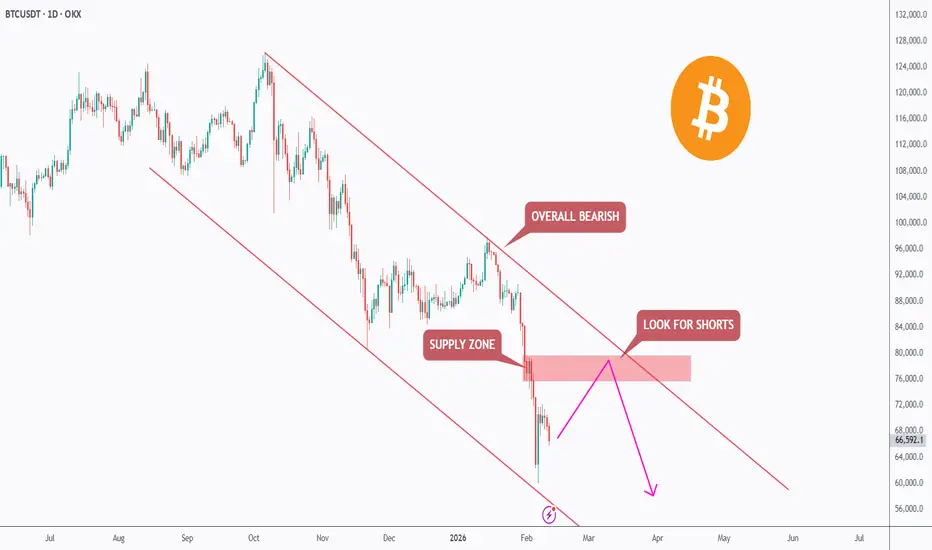
Bitcoin: Rally Into Resistance?Bitcoin remains overall bearish, trading inside a clear falling channel.
Now price is approaching a critical area:
🔴 The upper bound of the falling channel
🔴 A well-defined supply zone marked in red
When a dynamic trendline meets a static supply zone, it creates a high-probability reaction area.
As long as price remains inside the channel, the bias stays bearish.
📌 The plan is simple:
We look for trend-following short setups upon rejection from this confluence.
If sellers step in here, continuation toward the lower bound of the channel becomes the path of least resistance.
⚠️ Disclaimer: This is not financial advice. Always do your own research and manage risk properly.
📚 Stick to your trading plan regarding entries, risk, and management.
Good luck! 🍀
All Strategies Are Good; If Managed Properly!
~Richard Nasr
Why Risk Management works differently in Funded AccountsRisk management inside funded accounts is often reduced to position sizing and percentage risk. In reality, it operates under a very different set of constraints than personal capital. The presence of hard rules changes what risk actually represents.
In a funded account, risk is not only financial. It is structural. Daily loss limits, maximum drawdowns, and trailing equity thresholds define a fixed boundary. Once that boundary is crossed, the account ends. There is no recovery phase, no opportunity to adjust or wait for conditions to improve. This turns normal variance into a critical threat rather than a temporary setback.
Because of this, two trades with identical risk on paper can carry very different consequences. A perfectly valid loss taken early in the day may remove the ability to participate in high-quality setups later. A sequence of small losses, well within a strategy’s historical tolerance, can still violate account rules simply due to timing. Risk becomes path-dependent rather than distribution-based.
This reality shapes execution. Traders tighten stops to protect drawdown, even when market structure suggests wider protection is needed. They reduce position size beyond what their edge requires to survive longer. Some shift toward higher win-rate setups with lower expectancy to smooth equity. These adjustments are logical responses to constraints, but they redefine what “good” risk management looks like.
In personal accounts, drawdown is elastic. Losses are uncomfortable, but they do not end participation. This allows traders to think in terms of long-term expectancy, sample size, and recovery. Risk management focuses on sustainability over time rather than immediate survival.
Problems arise when traders apply real-account logic to funded environments, or vice versa. What feels conservative in one context can be reckless in another. Funded accounts reward survival within limits. Real accounts reward consistency across cycles.
Understanding this distinction removes confusion and self-blame. Effective risk management is not universal. It is conditional on capital structure. Traders who adapt their expectations and execution to those constraints stop fighting the rules and start working within them.

$BTC 1W: Zoomed out update, down we go Bitcoin continues to weaken on the weekly timeframe after decisively losing the 72.9k support, with price now trading in the mid-60s and firmly below the rising trendline that had supported the broader uptrend. The rejection from the 92.6k region marked a clear lower high, and the impulsive breakdown that followed shifts momentum firmly in favor of sellers in the near term. Structurally, this opens the door for a grind lower toward the major macro support around 52.8k, which represents the prior cycle higher low and the most important level on the chart. From a market structure perspective, it would not be surprising to see BTC chop and bleed lower into that 52k region, allowing time-based correction and sentiment reset before any meaningful reversal attempt. While this does not invalidate the broader bull market unless 52k is lost on a weekly closing basis, the current trend favors rallies being sold until strong acceptance back above 72.9k occurs. For now, the path of least resistance remains slightly lower, with 52k acting as the key demand zone that could determine whether this is a deeper bull-market retracement or the start of something structurally heavier.

Gitcoin in Danger Zone- currenty under the 200 week EMA
But on a brighter Note, this is usually the sign that we are entering the Bottom Area, as mentioned Previously..
I was hoping PA would remain above and it may go back by End of this week, by Candle close.
PA is oversold on may Timeframes but the 4 hour has reached up to Beutral and the Nulls may let this cool off before a continued Range..
We just have to wait and see BUT it does present EXCELLENT Buying oppertunities.
And again, as mentioned Previously, On Friday 13th ( snigger snigger ) We have the inflation figures being released in the USA..
THIS could be a signal for a movement.....We may just be waiting till then

Bitcoin Bored Range… Big Bounce Loading? (66K Zone)Over the past four or five days, Bitcoin ( BINANCE:BTCUSDT ) has been moving within a range, which might have made some traders a bit bored.
Right now, BTC is moving inside a heavy support zone($78,260-$64,850) and, in the past couple of days, seems to be inside a small descending channel.
From an Elliott Wave perspective, it looks like Bitcoin is completing the corrective wave C of the main wave Y, in a Double Three Correction structure(WXY).
I expect that Bitcoin will rise from the Cumulative Long Liquidation Leverage($66,120-$64,420) and climb at least to $68,971. If it breaks the upper line of the descending channel with strong momentum, we could even anticipate a move up to $71,311. Let me know your thoughts!
First Target: $68,971
Second Target: $71,311
Stop Loss(SL): $63,821
Points may shift as the market evolves
Cumulative Long Liquidation Leverage: $60,000-$58,000
Cumulative Short Liquidation Leverage: $73,100-$71,620
CME Gap: $84,560-$79,660
CME Gap: $54,545-$52,980
💡 Please respect each other's opinions and express agreement or disagreement politely.
📌Bitcoin Analysis (BTCUSDT), 1-hour time frame.
🛑 Always set a Stop Loss(SL) for every position you open.
✅ This is just my idea; I’d love to see your thoughts too!
🔥 If you find it helpful, please BOOST this post and share it with your friends.

BTC/USDT Analysis. Testing the Lower Range Boundary
Hello everyone! CryptoRobotics trader-analyst here with your daily market analysis.
Yesterday, Bitcoin continued its decline and reached the lower boundary of the range at $67,300. After breaking this level, price failed to reclaim it. Instead, when retesting the level from below, volumes increased but failed to produce upward movement. The primary expectation for the next 24 hours is continued decline toward the nearest demand zone.
Within the buy zone, we will look for confirmation signals to consider long positions. If buyer reaction is absent, the decline may continue, potentially pushing Bitcoin below $60,000.
Buy Zones
$65,000–$63,000 (maximum traded volumes)
$72,200–$56,000 (daily buy zone)
Sell Zones
$72,500–$75,200 (selling pressure)
$77,800–$79,200 (accumulated volumes)
$82,000–$85,500 (volume anomalies)
$87,600–$90,500 (accumulated volumes)
This publication is not financial advice.

USD/JPY | Retesting (READ THE CAPTION)As you can see in the 4H chart of USDJPY, it has been on a bearish run for the past 3 days from Monday open. It gradually dropped in the price from 157.66 all the way to 152.80, that's almost 400 pips in a span of 3 days!
USDJPY hit the demand zone today and it is being traded at 153.21.
If USDJPY manages to stay above the demand zone and manages to go through the IFVG, the targets are: 153.28, 153.40, 153.52 and 153.64.
If it fails at retesting the IFVG: 153.10, 153.00, 152.90 and 152.80.

EUR/USD | Consolidation over? (READ THE CAPTION)By analyzing the 15m chart of EURUSD we can see that it has been consolidating in the same range in the past 2 days, Currently being traded at 1.1915, barely above the NDOG High. If EURUSD manages to hold itself above the NDOG, the targets are: 1.1922, 1.1929, 1.1936 and 1.1943.
If it fails to hold itself above the NDOG Midpoint (1.19135), the targets will be: 1.1908, 1.1900 and 1.1892.

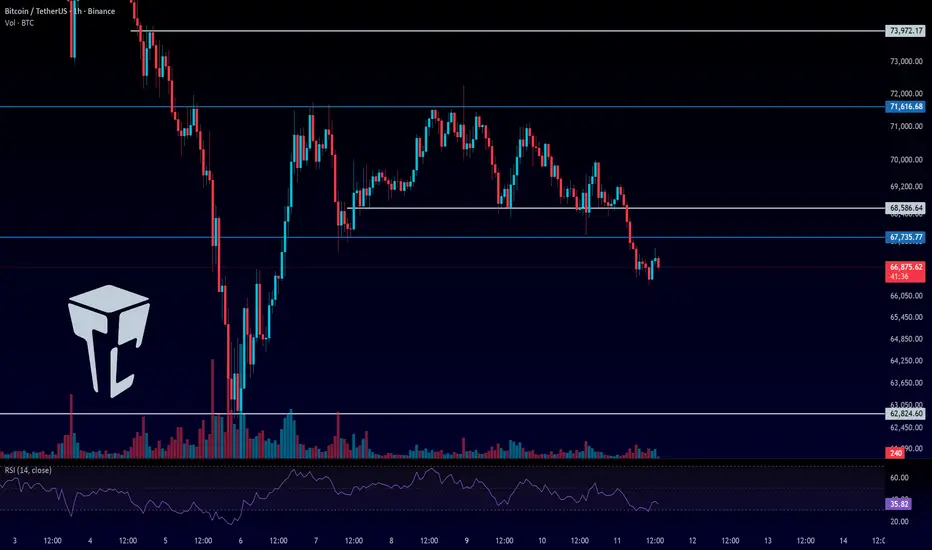
TradeCityPro | Bitcoin Daily Analysis #265👋 Welcome to TradeCity Pro!
Let’s move on to Bitcoin analysis. The market has finally started its bearish move.
⌛️ 1-Hour Timeframe
Yesterday, we had two short triggers on Bitcoin. The first was the break of 68,586, and the second was the break of 67,375.
✔️ If you opened a position on the break of either of these levels, price has now reached the target, and you can take profits.
🔍 That said, I believe there’s still a good chance price continues toward Bitcoin’s main low at 62,824. For that reason, I suggest securing partial profits and keeping the rest of the position open.
💥 If the RSI enters the oversold zone, the probability of this move increases significantly. Volume is also currently in favor of the sellers, with red candles showing stronger volume than green ones.
✨ Based on this, the chances of price moving down toward 62,824 are high. However, if you didn’t enter using yesterday’s triggers, we don’t have a new trigger today on Bitcoin itself, and we need to wait for a new structure to form.
⚖️ If this bearish move that started yesterday turns out to be a fake move, and price manages to stabilize back above 68,586, strong bullish momentum will enter the market, and the probability of breaking the 71,616 high will increase significantly.
🎲 So we need to stay alert and, if yesterday’s move gets invalidated, look for long opportunities.
🔔 As for short positions, just like I mentioned, we don’t have a new trigger today and need to wait for fresh structure to develop.
❌ Disclaimer ❌
Trading futures is highly risky and dangerous. If you're not an expert, these triggers may not be suitable for you. You should first learn risk and capital management. You can also use the educational content from this channel.
Finally, these triggers reflect my personal opinions on price action, and the market may move completely against this analysis. So, do your own research before opening any position.
Bitcoin Breaks Major Support — Extreme Fear or Another Leg Down?Bitcoin ( BINANCE:BTCUSDT ), as I highlighted in my previous weekly idea , started its decline. The drop came with higher momentum than expected, surprising many, and it successfully broke the heavy support zone($78,260-$64,850).
Now, here are the fundamental reasons for Bitcoin’s movement in the last 24-48 hours, as well as the general context:
•Global Risk-Off Sentiment: Investors moved away from high-risk assets as global equity markets—especially tech stocks—came under heavy selling pressure.
•Lack of Strong Spot Demand: There was no meaningful inflow of fresh capital to absorb selling pressure at key support levels.
•Institutional Pressure & Unrealized Losses: Large BTC holders and public companies with Bitcoin on their balance sheets reported increased unrealized losses, weakening market confidence.
•Correlation With Traditional Markets: Bitcoin continued to trade as a risk asset, following the downside momentum of global financial markets.
•Forced Liquidations: High leverage across the market led to cascading liquidations, accelerating the downside move.
Bitcoin Fear & Greed Index is currently at 9 — marked as “Extreme Fear”.
This is the lowest reading since June 2022, when the market sentiment collapsed following major events like the Terra crash.
Historically, when the Fear & Greed Index dropped this low, Bitcoin experienced prolonged selling pressure and volatility, followed by eventual stabilization as fear subsided. Extreme Fear readings often coincide with market bottoms or oversold conditions, but they do not guarantee an immediate price reversal.
In short: Extreme fear can signal that market participants are overly pessimistic — possibly a contrarian buying environment — but confirmation from price action and other indicators is crucial before assuming a trend reversal.
Now, let’s take a quick look at Bitcoin’s 4-hour chart to assess the current situation.
It appears that Bitcoin, given its momentum, has successfully broken the heavy support zone($78,260-$64,850) and is currently pulling back toward that zone.
From an Elliott Wave perspective, it seems we are in the final stages of the main wave 4. After this pullback near Fibonacci levels, we anticipate another decline. Since the drop’s momentum has been strong, wave 5 could potentially be truncated.
I expect Bitcoin to resume its drop from one of the Fibonacci levels or Cumulative Short Liquidation Leverage($68,900-$67,200), targeting at least $64,123.
First Target: $64,123
Second Target: $62,103
Stop Loss(SL): $72,033
Points may shift as the market evolves
Cumulative Long Liquidation Leverage: $60,000-$58,000
CME Gap: $84,560-$79,660
CME Gap: $54,545-$52,980
💡 Please respect each other's opinions and express agreement or disagreement politely.
📌Bitcoin Analysis (BTCUSDT), 4-hour time frame.
🛑 Always set a Stop Loss(SL) for every position you open.
✅ This is just my idea; I’d love to see your thoughts too!
🔥 If you find it helpful, please BOOST this post and share it with your friends.

BTCUSDT Long: Descending Channel Breakout - Demand HoldingHello traders! Here’s a clear technical breakdown of BTCUSDT (2H) based on the current chart structure. Bitcoin previously traded within a well-defined consolidation range, where price moved sideways for an extended period. This ranging phase reflected a temporary balance between buyers and sellers and allowed liquidity to build above and below the range boundaries. Eventually, this equilibrium resolved to the downside, triggering a strong bearish impulse. After the range breakdown, BTC entered a clean descending channel, characterized by consistent lower highs and lower lows. Price respected both the upper and lower channel boundaries well, confirming controlled bearish pressure rather than emotional selling. This structured decline indicates that sellers remained in control while buyers were only able to generate short-lived pullbacks. The bearish move culminated at a clear pivot low, where selling momentum exhausted and aggressive buyers stepped in. From this pivot point, Bitcoin produced a sharp bullish reaction, breaking decisively above the descending channel, which marked a meaningful structural shift from bearish continuation to recovery. Following the breakout, price impulsively rallied and reclaimed key levels before reaching the Supply Zone around 71,700, where bullish momentum temporarily stalled. This level acted as a logical resistance, leading to a pullback.
Currently, BTC is consolidating above the Demand Zone and along the rising demand line, suggesting that the retracement is corrective rather than the start of a new bearish trend. Multiple reactions from this demand area indicate active buyer interest and defense of the level, reinforcing the idea of a developing higher-low structure. As long as price holds above the Demand Zone and respects the rising demand line, the broader bias remains cautiously bullish.
My primary scenario favors upside continuation after consolidation. A sustained hold from demand opens the door for a renewed push toward the 71,700 supply level (TP1), which represents the first major upside target and a logical area for partial profit-taking. A clean breakout and acceptance above this supply zone would confirm bullish continuation and signal potential expansion toward higher highs. Conversely, a decisive breakdown below the Demand Zone and loss of the rising demand line would invalidate the bullish recovery scenario and suggest a deeper corrective move. Until such confirmation appears, the current market structure points to balance with a bullish continuation bias from demand. Manage your risk!

BTCUSDT 5X Long with 339% profits potentialAt times, numbers can convey a stronger message than words... Maybe because we are talking about trading? Or maybe because there is no room for hiding mistakes. It is either hit or miss, and many people can appreciate this —thank you.
Numbers cannot lie, words either. Only humans can lie. Here comes the truth!
Bitcoin is bullish now based on a strong recovery and major low 6-February. The move we are witnessing today is a classic retrace. The retrace that tends to happen after prices move up in anticipation of additional growth.
Since the market is red... "Buy when the market is red."
Full trade-numbers below:
_____
LONG BTCUSDT
Leverage: 5X
Potential: 339%
Allocation: 5%
Entry zone: $60,000 - $67,000
Targets:
1) $69,800
2) $75,625
3) $85,300
4) $93,100
5) $100,911
6) $112,033
Stop: Close weekly below $58,000
_____
Thank you for reading. Your continued support is highly appreciated.
If you missed the entry 6-February, here is your second chance. It is now or never.
Leveraged trading is for experts only.
Namaste.

BITCOIN Is $50000 inevitable??Bitcoin (BTCUSD) is again on the downturn after almost reaching its 1W MA200 (orange trend-line) just last week. One would thought that long-term buyers would make their presence clear on this historically supportive level but so far their absence is more than emphatic. If this continues, the market eyes the next critical Support level, the 1W MA350 (red trend-line), which is where the previous 2022 Bear Cycle bottomed.
In fact, we identify a quite similar pattern on BTC's last three major correction events (2022 Bear Cycle and late 2019 - early 2020 on COVID flash crash). As you can see a Double Top rejection followed by a Higher Lows trend-line bearish break-out has been the common pattern on all (including the current correction). The previous two both broke below the 1W MA200 and their respective 1.618 Fibonacci extension levels, with the 2022 fractal bottoming just above the 1.786 Fib ext while the 2020 below it. In both cases, the 1W MA350 held.
As a result, if buyers continue to be absent and BTC is getting heavily sold after every short-term rally, we can expect the market to target $50000, which isn't just the next psychological level but also just above the current 1.786 Fib and will still be above the 1W MA350 (based on its current trajectory).
So do you think a $50k test is inevitable at this point? Feel free to let us know in the comments section below!
---
** Please LIKE 👍, FOLLOW ✅, SHARE 🙌 and COMMENT ✍ if you enjoy this idea! Also share your ideas and charts in the comments section below! This is best way to keep it relevant, support us, keep the content here free and allow the idea to reach as many people as possible. **
---
💸💸💸💸💸💸
👇 👇 👇 👇 👇 👇
