AVAX Update – Watch for Pullback to Key SupportAVAX has rallied nearly +23% since our last trade idea and is now facing strong resistance. The move has been sharp, but price is showing signs of exhaustion here, and we expect a pullback before any further upside. This creates a solid opportunity to position for the next wave.
🔍 We're targeting a long spot entry around $13.30, which lines up with a previous support zone. This level offers a good risk/reward window, especially with confirmation from past price structure.
📌 Trade Plan:
Long Entry: ~$13.30
Take Profit Targets: $15.00 – $17.10, $18.50 – $21.00
Stop Loss: Below $12.70
Bitcoin (Cryptocurrency)

ETH/USDT | From this FVG to the other! (READ THE CAPTION)By analysing the 2h chart of ETHUSDT, we can see that 3308, it dropped in price all the way down to the lower FVG's high, showing an initial reaction before dropping in the FVG zone yet again. It is currently being traded at 3109. I expect it to hit the Consequent Encroachment of the FVG and then going back up to test the high of the FVG again.
Current targets: 3113, 3124, 3136, 3148 and 3160.

$ZEC 1D update: The trend has been bucked, monitoring... ZEC has now dumped back down decisively, and attention shifts straight back to the $300 level.
The recent breakdown from the rising channel confirms that the prior uptrend leg has been interrupted. What initially looked like consolidation has resolved lower, with expanding volatility and an impulsive move down, which usually signals unfinished business to the downside rather than an immediate reversal.
The $300–310 zone is once again the key level that matters. This area previously acted as a major demand base and launch point for the last expansion. A controlled move into that region with slowing momentum would still fit a broader bullish digestion narrative. However, a fast loss of $300 on a daily closing basis would materially weaken the structure and open the door to deeper retracement.
From a market behavior standpoint, this type of flush is not unusual for ZEC. It tends to overshoot, shake out late positioning, and only then form a more durable base. For now, I’m treating this as a volatility phase rather than assuming the larger trend has already resumed.
Bias here is cautious and reactive. I’m watching how price behaves as it approaches $300, not trying to front-run a bounce. The reaction at that level will determine whether this is just another reset before continuation, or something that requires more time to rebuild structure.

BTC - Demand Did Its Job. Now Watching the ChannelBTC reacted exactly where it was supposed to... the blue demand zone held, and buyers stepped in!
Since that reaction, price has started to shift short-term momentum to the upside, forming a rising channel. Nothing aggressive yet, but structure is slowly improving.
From here, my focus is simple:
as long as BTC keeps trading within this blue channel, I’ll be patiently looking for pullbacks toward the lower bound, and from there, trend-following long setups.
The natural upside magnet remains the orange structure zone, which is still acting as the key decision area.
⚠️ Disclaimer: This is not financial advice. Always do your own research and manage risk properly.
📚 Stick to your trading plan regarding entries, risk, and management.
Good luck! 🍀
All Strategies Are Good; If Managed Properly!
~Richard Nasr

BTCUSD Long Analysis****BTCUSD Long Analysis**
Bitcoin is holding a strong **support zone around 90,000**, where price has shown multiple rejections and buyer interest. Recent price action suggests **base formation and higher lows**, indicating bullish momentum building from this demand area.
As long as BTC remains **above the 90K support**, a bullish continuation toward **92,000** is expected. A clean breakout above the near-term resistance will further confirm upside strength.
**Bias:** Bullish above 90,000
**Target:** 92,000
**Invalidation:** Sustained break below 90,000
---
#BTCUSD
#Bitcoin
#BullishBias
#SupportZone
#CryptoTrading
#PriceAction
#TechnicalAnalysis
**Not financial advice. Trade at your own risk.**

Cipher Mining(CIFR) 1D: compression before expansionCipher Mining is a US-listed Bitcoin mining company with direct exposure to the BTC cycle and infrastructure scalability.
On the daily chart, price is forming a symmetrical triangle after the prior impulse. The key decision zone sits around 15, where the 0.786 Fibonacci level, diagonal support, MA100 and volume profile align. This area defines the execution zone, while direction is confirmed by higher timeframes.
Direction comes from the higher timeframes. On the weekly and monthly charts, indicators maintain a bullish configuration: moving averages are rising and positioned below price, the broader structure remains intact, and oscillators stay neutral-bullish with no reversal signals. This confirms that the current daily consolidation is occurring within a larger bullish context. The daily MA100 acts as dynamic support inside the range, strengthening the importance of the 15 level.
The base scenario assumes support holding at 15 followed by an upside breakout from the triangle. Initial targets sit near 20.5, followed by 25.5. A decisive breakdown below 15 invalidates the setup.
Fundamentally, CIFR remains a cyclical mining play. Revenue remains elevated, with the next quarterly estimate around $88M. EPS is still negative and free cash flow remains under pressure, which is typical during expansion phases. Strong financing inflows help support liquidity and ongoing infrastructure growth. The stock remains a leveraged bet on Bitcoin continuation.
In short: daily defines the entry, weekly and monthly define the direction.

Bitcoin CME Gaps (1H)Bitcoin currently has two unfilled CME gaps located in the lower price regions. Historically, CME gaps tend to act as strong magnets for price, as Bitcoin often revisits these areas to fill the gaps before resuming its primary trend. While this behavior is not guaranteed, it has occurred frequently enough to be considered an important factor in technical analysis.
At the moment, the first CME gap is positioned in the 91K–90K zone, which represents a relatively shallow pullback area and could be tested during a normal corrective move. If selling pressure increases or the market enters a deeper retracement phase, the second CME gap located around 88K may come into play as a stronger downside target.
These levels should be monitored closely, as price reactions around CME gaps can provide valuable insight into market strength, liquidity absorption, and potential trend continuation. A clean fill followed by strong bullish confirmation could indicate that the market is preparing for the next leg higher. Conversely, failure to reclaim these levels may suggest extended consolidation or deeper correction.
As always, CME gaps should be analyzed in confluence with other technical tools such as market structure, support and resistance zones, volume behavior, and momentum indicators. They are not standalone signals, but when combined with broader market context, they can significantly improve trade planning and risk management.
If you have a coin or altcoin you want analyzed, first hit the like button and then comment its name so I can review it for you.
This is not a trade setup, as it has no precise stop-loss, stop, or target. I do not publish my trade setups here.

SOL/USDT | Back to the demand zone (READ THE CAPTION)As you can see in the 4H chart of SOLUSDT, After an initial run to 143.48 level, Solana has dropped in price again, reaching the demand zone it was stuck to for a matter of weeks at 133.79 level, it is currently being traded at 134.80, barely above the demand zone.
It is expected for it to retest the IFVG.
For the time being, Bullish targets: 136, 137.20, 138.40 and 139.60.
Bearish targets: 133.80, 132.65, 131,50 and 130.35.

BITCOIN Realized Price shows where the bottom might be.Bitcoin (BTCUSD) has always priced its bottom below its Realized Price (red trend-line) on every signal Bear Cycle it had.
In fact the bottom was considerably lower than the Realized Price. The last two Bear Cycles (2022 and 2018) have had fairly similar bottoms, dropping by -33.80% and -35.45% respectively from the moment the price broke below the Realized Price.
Based on where the Realized Price is now (which by the time BTC hits it, will be lower) a rounded up -30% decline would have us reach $39000. The Realized Price deviation band (orange cloud) however would be just under $45000 towards the end of the year (which is roughly when we expect the Bear Cycle to end)
As a result, a fair bottom zone could be $45000 - $39000.
Do you think that's a feasible level to expect? Feel free to let us know in the comments section below!
---
** Please LIKE 👍, FOLLOW ✅, SHARE 🙌 and COMMENT ✍ if you enjoy this idea! Also share your ideas and charts in the comments section below! This is best way to keep it relevant, support us, keep the content here free and allow the idea to reach as many people as possible. **
---
💸💸💸💸💸💸
👇 👇 👇 👇 👇 👇

Bitcoin - Weekly Trend Holds, $146K Fib Extension NextBitcoin Weekly Structure Intact: $90K Support Holding, $146K Extension Target
Bitcoin is respecting the weekly uptrend structure with current consolidation around the $90K zone.
The 0.618 Fibonacci retracement at $72,395 held as support during the recent correction, and price is now positioned for the next leg higher targeting the -0.618 Fibonacci extension at $146,676. Historical precedent from August 2024 suggests this pattern could repeat.
📊 Current Technical Picture:
Weekly Trend: The ascending trendline from the 2023 lows remains intact. Price is consolidating above the 0.5 Fibonacci retracement at $79,487, showing the correction has found support.
Multiple weekly closes above $90K would confirm continuation setup.
Key Fibonacci Levels: The 0.618 retracement at $72,395 acted as strong support during the pullback.
Current price around $90K sits between the 0.5 Fib ($79,487) and the 0.382 Fib ($86,578). The 0.236 Fib at $95,383 is the next resistance to clear.
Upside Target: The -0.618 Fibonacci extension projects to $146,676, representing 63% upside from current $90K levels.
🔄 August 2024 Precedent:
What Happened Then: In August 2024, Bitcoin consolidated at the 0.5 Fibonacci level around $49,366. After confirming support, price launched into a powerful rally that extended to the previous all-time high zone near $73,000. The move delivered approximately 48% gains in just a few months.
The Pattern: Consolidation at mid-range Fibonacci level. Weekly trend confirmation with higher lows. Breakout above resistance. Extension to Fibonacci projection target. Volume expansion on the move higher.
Why It Matters: The current setup mirrors August 2024 structure. Bitcoin is consolidating at a key Fibonacci support zone with the weekly trend intact. If the pattern repeats, the measured move targets the $146K extension level.
📈 Why $146K Target:
Fibonacci Extension Math: From the cycle low to the previous high, the -0.618 extension projects to $146,676. This isn't arbitrary, it's based on the golden ratio mathematical relationship that Bitcoin has respected throughout its history.
Market Cap Context: $146K Bitcoin equals approximately $2.9 trillion market cap. While this seems aggressive, it represents similar percentage gains to previous bull cycle extensions. The 2020-2021 cycle saw Bitcoin go from $10K to $69K, a 590% gain. From current $90K to $146K is 63%, conservative by historical standards.
Institutional Backdrop: Spot ETF inflows, corporate treasury adoption, and nation-state interest provide fundamental support for the technical projection. The infrastructure for six-figure Bitcoin now exists.
🎯 The Setup:
Support Zone: $90K holding as current consolidation floor. Deeper support at $79,487 (0.5 Fib) and $72,395 (0.618 Fib) if needed.
Resistance to Clear: $95,383 (0.236 Fib) is immediate resistance. Break above this level with volume confirms the next leg up is beginning.
Target: $146,676 (-0.618 Fibonacci extension). This represents the measured move if the weekly trend continues and Bitcoin follows the August 2024 playbook.
Timeframe: If the pattern mirrors August 2024, the move could take 3-6 months to fully develop. Expect consolidation periods along the way.
📊 Weekly Trend Analysis:
Trendline Intact: The ascending trendline from 2023 lows has not been violated. Every test of this trendline has resulted in continuation higher. Current price action is respecting this structure.
Higher Lows Pattern: Bitcoin continues to form higher lows on the weekly timeframe. The recent low around $90K is above the previous correction low. This is textbook uptrend behavior.
Volume Profile: The consolidation at $90K is occurring on declining volume, typical of healthy corrections. When the breakout occurs, volume expansion should confirm the move.
Moving Averages: Weekly 21 EMA and 50 EMA are both rising underneath price, providing dynamic support. Price has remained above these key moving averages throughout the trend.
🔄 August 2024 Comparison:
Then: Consolidated at $49K after pullback. Tested 0.5 Fibonacci support multiple times. Weekly trend remained intact. Launched to $73K (48% gain).
Now: Consolidating at $90K after pullback. Testing 0.5 Fibonacci area. Weekly trend remains intact. Targeting $146K (63% gain projected).
The Parallel: Same Fibonacci retracement level. Same weekly trend structure. Same consolidation behavior. If history repeats, similar explosive move higher.
🚀 Catalysts for the Move:
Spot ETF Flows: Institutional accumulation continues through Bitcoin ETFs. Daily inflows provide consistent buying pressure that supports upward momentum.
Halving Cycle: The April 2024 halving historically leads to bull market peaks 12-18 months later. We're now 9 months post-halving, entering the typical acceleration phase.
Macro Environment: Potential Fed rate cuts in 2025 would benefit Bitcoin as a scarce asset. Liquidity conditions improving supports risk assets.
Nation-State Adoption: Countries and corporations continue adding Bitcoin to treasuries. This long-term HODLing reduces available supply.
⚠️ What Could Invalidate:
Weekly Close Below $72K: If Bitcoin closes a weekly candle below the 0.618 Fibonacci at $72,395, the trend structure is compromised. This would suggest the correction is deeper than anticipated.
Trendline Break: A decisive break below the ascending weekly trendline would indicate trend failure. This is the critical support that must hold for the bullish thesis.
Macro Shock: Recession, financial crisis, or major risk-off event could override technical structure. Bitcoin still correlates with broader risk sentiment.
Volume Failure: If Bitcoin attempts to break $95K without volume expansion, it suggests lack of conviction. Sustainable moves require volume confirmation.
🧠 Why Most Will Miss This:
At $90K Now: "It's already up so much from $16K, too risky to buy here."
At $110K: "Should have bought at $90K, I'll wait for a pullback."
At $130K: "This is a bubble, it's going to crash."
At $146K: "Why didn't I buy at $90K when it was obvious?"
The Pattern: Early entries feel uncomfortable. Confirmation feels late. Obvious is actually late. Right now, at $90K with weekly trend intact, is still early for the $146K target.
⚠️ Important Disclaimers:
This analysis is for educational purposes and reflects a technical view based on Fibonacci extensions, historical pattern recognition, and weekly timeframe structure. It is not financial advice or a recommendation to buy or sell Bitcoin or any cryptocurrency.
Cryptocurrency investing carries extreme risk. Bitcoin can experience 20-30% corrections even during bull markets. The $146K target is a mathematical projection based on Fibonacci ratios, not a guaranteed outcome.
The August 2024 comparison is based on similar technical setups, but past patterns do not guarantee future results. Each market phase has unique characteristics and risks.
Weekly trend analysis provides structure but can fail during major market dislocations. The 0.618 Fibonacci support could break, invalidating the bullish thesis.
Position sizing must account for Bitcoin's volatility. Never invest more than you can afford to lose completely. Cryptocurrency should represent only a portion of a diversified portfolio.
Always conduct independent research, manage risk appropriately, and consider your investment timeframe and risk tolerance. All cryptocurrency trading involves substantial risk of loss.

BTC : This May Be Your Last Chance Before Exploding to Upside !!It can be said that if Bitcoin manages to break above 97k, it could easily reach 150k and begin new bullish waves.

BTCUSDT Holding Higher Lows, $94,700 Resistance in FocusHello traders! Here’s my technical outlook on BTCUSDT (3H) based on the current chart structure. BTCUSDT initially experienced a strong sell-off, marked by aggressive bearish momentum as price dropped from higher levels. After this decline, the market found a base and started to grow, transitioning into an ascending channel. This phase showed a clear shift in control from sellers to buyers, supported by a rising support line and multiple bullish reactions along the channel. However, as price approached the upper boundary of the channel and the Seller Zone, upside momentum began to slow. During this phase, BTC formed several fake breakouts and failed attempts to hold above resistance, signaling strong selling pressure near the highs. Price then broke back below short-term structure and entered a consolidation phase, forming a clear range. This range reflected temporary balance, with buyers defending the lower boundary while sellers capped the upside. Recently, BTC broke out from the range to the upside and reclaimed the Buyer Zone, confirming renewed bullish intent. Price is now trading above key support around 91,500–92,000 and is respecting the rising support line, indicating that buyers are actively defending pullbacks. The current move is pushing price back toward the Resistance Level and Seller Zone around 94,700, where a test is expected. My scenario: as long as BTCUSDT holds above the Buyer Zone and the rising support line, the bullish bias remains intact. I expect price to retest the 94,700 Resistance, with TP1 aligned near this level. A clean breakout and acceptance above resistance would confirm bullish continuation and open the door for higher targets. However, a strong rejection from the Seller Zone followed by a breakdown below support would invalidate the bullish scenario and suggest a deeper corrective move. Please share this idea with your friends and click Boost 🚀

BTC KEY TO DIRECTIONMorning folks,
As we said last time, the bearish scenario is not off the table. In fact, market now stands in a big triangle which is the key. BTC now is challenging 90K support. If it will be broken, the next is the last one around 88K. Downside breakout will open road to 75-78K lows again.
Now I do not see any good buying opportunities and prefer to watch for market reaction on major support levels.

EURUSD Compressing Into a Triangle — Volatility ExpansionEURUSD on H1 is currently trading within a symmetrical triangle, reflecting a clear contraction phase after the prior bearish move. The market is no longer trending impulsively; instead, price is compressing between descending resistance and ascending support, signaling indecision and energy build-up.
Structurally, sellers remain in control below the descending trendline, while buyers are gradually stepping in at higher lows. Price is trading below the EMA 50, which continues to act as dynamic resistance and reinforces the corrective nature of the current price action rather than a confirmed trend reversal.
A key supply / reaction zone around 1.1700–1.1710 has already caused multiple rejections. This area is critical for short-term direction, as acceptance above it would signal a shift in momentum, while rejection keeps the compression bearish-neutral.
At the same time, the rising trendline support is holding, preventing immediate continuation to the downside. This confirms that the market is waiting for a break-and-confirm before committing to the next directional move.
Bullish scenario: A clean breakout above the descending trendline, followed by acceptance above 1.1710, would confirm bullish continuation toward 1.1750 and potentially 1.1780.
Bearish scenario: Failure to break resistance and a confirmed breakdown below the ascending support would expose downside targets toward 1.1680, with extension risk toward 1.1650.
Until a breakout occurs, entries inside the triangle carry elevated risk. Patience is key — the best opportunities will come after confirmation, not while price remains compressed within the structure.

TradeCityPro | Bitcoin Daily Analysis #258👋 Welcome to TradeCityPro!
Let’s move on to the Bitcoin analysis, today the market is going through a correction.
⏳ 4-hour timeframe
On the 4-hour timeframe, after Bitcoin reached the 94478 resistance, it entered a corrective phase and its bullish momentum decreased significantly.
✔️ In the first corrective leg, price retraced to the 0.382 Fibonacci level, and since then it has retraced down to the 0.618 level.
💥 The 0.618 Fibonacci area overlaps with 90373, forming a strong PRZ. If Bitcoin’s next bullish wave is going to start, price can build a bottom here and begin its upward move.
✨ If the correction extends further, the next support is 89040. If this level is also lost, price can move down toward the main low at 86855, in which case the entire bullish move we had so far becomes a fakeout.
🔔 If price finds support right here at 90373, we can open a long position after the structural break that Bitcoin creates. The main confirmation for the start of the next bullish wave will be the break of 94478.
🎲 For a short position, I will wait until price stabilizes below 90373, and then I will look for a trigger.
❌ Disclaimer ❌
Trading futures is highly risky and dangerous. If you're not an expert, these triggers may not be suitable for you. You should first learn risk and capital management. You can also use the educational content from this channel.
Finally, these triggers reflect my personal opinions on price action, and the market may move completely against this analysis. So, do your own research before opening any position.

Be careful with bitcoin !!!The price could rise from here to the top of the wedge, potentially reaching around $150k

XAUUSD | Still bullish! (READ THE CAPTION)In the hourly chart of XAUUSD we can see that after reaching 4500 in the early hours of Wednesday, Gold dropped all the way to 4415, a massive drop of 850 pips! However, after hitting the C.E. of the FVG and closing the smaller FVG in that zone, it retraced and reached 4439. At the moment, it is being traded 4430, and I believe Gold will go back up soon enough.
For now the targets are: 4440, 4453, 4466 and 4479.

BTC/USDT | A massive drop! (READ THE CAPTION)In the 4H chart of BTCUSDT we can see that after reaching 94,789 level and sweeping the liquidity there, BTC experienced a massive drop all the way to 89,641 and hitting the IFVG High, it has retraced and it is now being traded at 90,600. For the time being, these are the targets for BTCUSDT: 91,200, 91,700, 92,200 and 92,700.

ETH/USDT | new ATH ahead in 6 Months! (READ THE CAPTION)Ethereum rallied to $3,300 and is currently attempting to hold above this level. If price stabilizes above $3,300 within the next 24 hours, the next short-term targets are $3,450 and $3,620. A clean break above $3,620 could accelerate momentum toward $3,850 and $4,000. The $2,100–$2,700 demand zone remains a strong institutional support, and as long as Ethereum stays above it, the medium-term outlook remains bullish with a high probability of reaching a new all-time high in the first half of the year.
Please support me with your likes and comments to motivate me to share more analysis with you and share your opinion about the possible trend of this chart with me !
Best Regards , Arman Shaban

TON/USDT | TON Coin Rallying Over 20%, Bullish Momentum ContinueCRYPTOCAP:TON has surged from $1.65 to $1.95, delivering over 20% return since our last analysis. Price has held above the key $1.58 level and is now pushing aggressively higher, confirming short-term bullish momentum.
If strength continues, next bullish targets to watch are $2.07, $2.22, $2.38, and $2.60.
Please support me with your likes and comments to motivate me to share more analysis with you and share your opinion about the possible trend of this chart with me !
Best Regards , Arman Shaban

SUI Pullback Setup – Eyeing the Next Leg UpSUI has rallied impressively from the ~$1.40 area into strong resistance at $2.00. This move confirms bullish strength, but we’re now seeing signs of exhaustion near this resistance zone. A short-term pullback is expected, which could offer a better entry point for the next leg higher.
📍 Entry Zone: Watching for a dip toward $1.65, which aligns with potential support from previous structure and could act as a launchpad for buyers to re-enter.
🎯 Targets:
• TP1: $2.20 – $2.50
• TP2: $3.00 – $3.30
❌ Stop-Loss: Just below $1.50, to protect against a deeper correction or invalidation of the bullish setup.

BTC/USDT | More Bullish Move Ahead ? Let's See!By analyzing the CRYPTOCAP:BTC chart on the Daily timeframe, we can now confirm a powerful breakout above previous resistance. Bitcoin surged to $94,800 and is currently trading around $92,500.
If price manages to sustain above the key $90,000 level, the bullish scenario strengthens, and we may see an extension toward higher targets. The next key resistance zones to watch are $97,000, $99,000, $101,400, and $104,000.
The bias has shifted from bearish to bullish, but only if $90K holds as new support. Momentum remains in buyers’ hands as long as structure and volume confirm this shift.
Please support me with your likes and comments to motivate me to share more analysis with you and share your opinion about the possible trend of this chart with me !
Best Regards , Arman Shaban

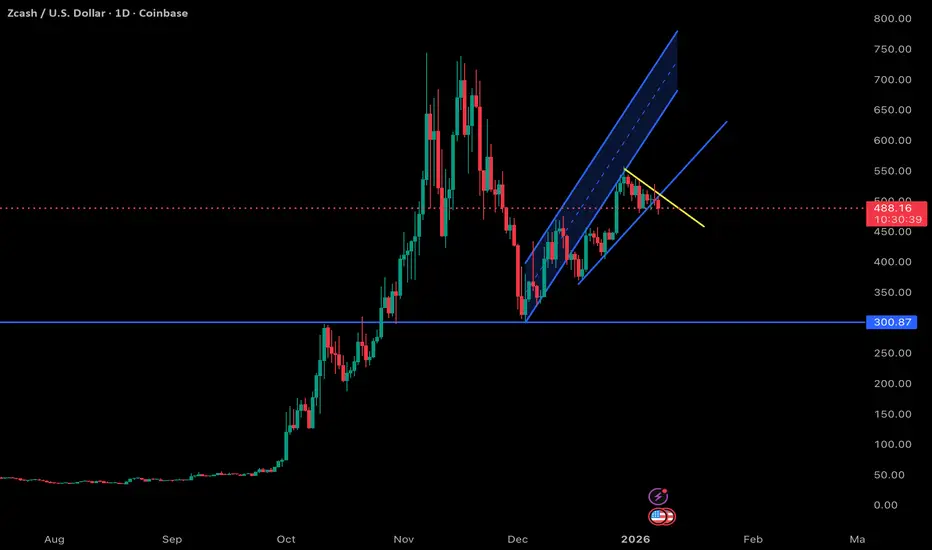
ZEC 1D Update: Bucking the uptrend again ZEC is bucking the uptrend again in the short term, and the price action is starting to look more volatile rather than clean continuation. After riding the rising channel higher, price has rolled over near the upper portion of the structure and is now slipping back toward the mid-range instead of holding the highs.
This kind of behavior usually signals that the market isn’t ready to trend yet. Momentum has cooled, upside follow-through stalled, and price is breaking short-term support, which opens the door for more back-and-forth and potentially another push lower before any sustained move higher develops.
Importantly, this doesn’t break the broader bullish structure. As long as the larger support levels hold, this still looks like digestion after a strong advance rather than a full trend failure. ZEC has a history of being messy before it really starts moving, and this volatility fits that pattern.
My base case here is more chop and possibly lower prices in the near term, shaking out late longs and resetting momentum. If that happens while higher timeframe support remains intact, it likely sets the stage for a stronger move once it finally gets cooking. For now, patience matters more than prediction.