BITCOIN Can it reach $50000 during this Bear Cycle?Bitcoin (BTCUSD) has already started its new Bear Cycle since its October All Time High (ATH). We're past that, we've covered this extensively during the past 3 months. What's more important now is to cover the next stages, which is something we've started doing recently, in order to get a better understanding of the potential course of this Bear Cycle.
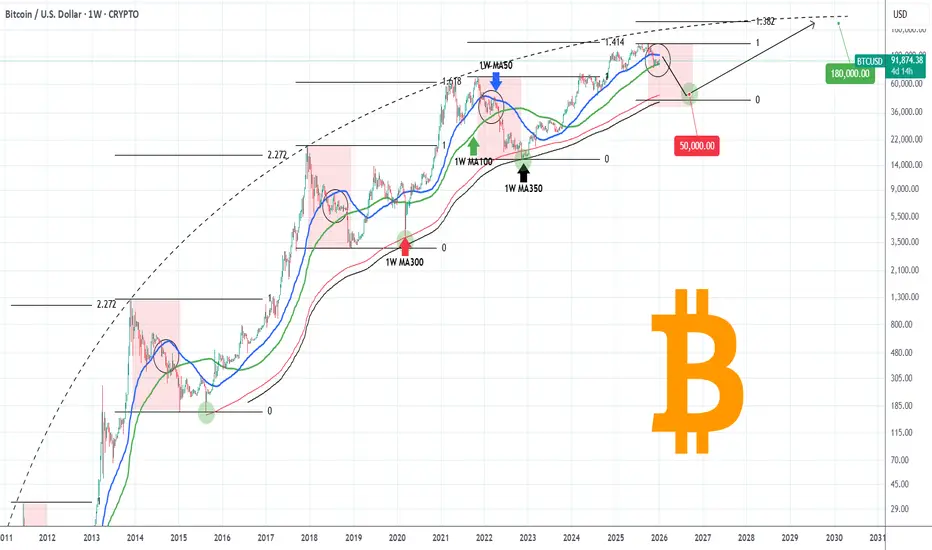
Right now BTC is consolidating within its 1W MA50 (blue trend-line) and 1W MA100 (green trend-line), which is a familiar pattern during all prior Bear Cycle, where after a 1W MA50 rejection, it starts Stage 2 of the Cycle.
The last Bear Cycle bottomed exactly on the 1W MA350 (black trend-line). The two before it, hit the 1W MA300 (red trend-line) before rebounding (and it was a secondary Low). As a result the 1W MA300-350 form a strong Support Zone and is the strongest candidate for the new bottom as well. Contact with the 1W MA350 (based on its current trajectory) should be made around $50000. A 45-50k potential Buy Zone would be more fair.
In any case, based on BTC's parabolic growth curve and the diminishing Fibonacci extension on each Bull Cycle Top, we expect the next ATH to be on its 1.382 Fib extension, i.e. around $180000.
Is that a trading plan you would follow if you were a long-term investor? Feel free to let us know in the comments section below!
---
** Please LIKE 👍, FOLLOW ✅, SHARE 🙌 and COMMENT ✍ if you enjoy this idea! Also share your ideas and charts in the comments section below! This is best way to keep it relevant, support us, keep the content here free and allow the idea to reach as many people as possible. **
---
💸💸💸💸💸💸
👇 👇 👇 👇 👇 👇
Bitcoin (Cryptocurrency)
Coinranger| BTCUSDT. Potential reversal to 90100🔹At 16:15 UTC+3 - ADP nonfarm payrolls data.
🔹At 18:00 UTC+3 - PMI in services and the JOLTS employment report. More important.
High volatility is possible on both news.
🔥BTC
🔹Currently, Bitcoin has made just enough progress on the h4 to begin a reversal, but interestingly, this timeframe is currently experiencing the same level of uncertainty as it did on the h1 on Monday before the small rally. Summary:
1️⃣ The important h4 level is 93450 above.
2️⃣ There's a whole set of levels for decline with potential extensions: 91160, 90100 (especially important), 88200, and 86700.
I think we'll drop to 90100 today or tomorrow, and then there'll be a turning point.

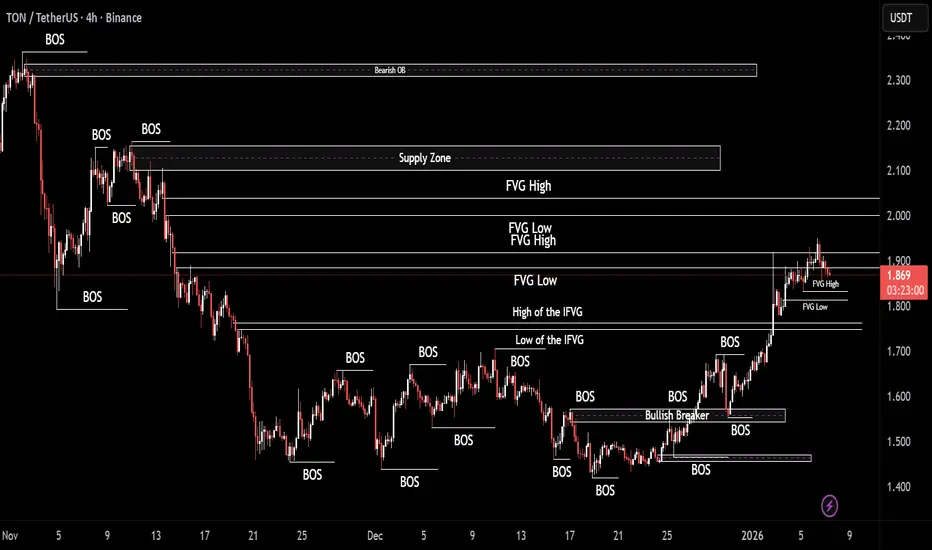
TONUSDT | Where is it headed? (READ THE CAPTION)As you can see in the 4H chart of TONUSDT, yesterday it made it out of the FVG zone, going as high as 1.950, but then it dropped and went below the FVG at 1.852, and currently being traded 1.875. I'd like to see it drop to the FVG High below it at 1.833 to see a reaction.
Bullish targets, if it bounces back up: 1.880, 1.895, 1.910 and 1.925.
If it fails and drops further, the targets are: 1.865, 1.850 and 1.835.
How to audit your own trades like a risk manager would Auditing your trades is not about replaying charts to confirm whether you were right or wrong. A risk manager audits to protect capital durability, reduce mistake frequency, and identify exposures created by process, not emotion. When you adopt this mindset, performance leaks become easy to detect and easier to correct.
A professional audit begins with environment classification. Every trade is labeled by the market phase it was executed in. Volatility is assessed as expanding or compressing. Liquidity incentives are identified before execution, not after it. For example, BTCUSDT and SOLUSDT produce wider candle ranges during expansion and thinner order books when liquidity drains. These are high-invalidation conditions. If you increased size here, you paid an execution tax without a volatility reason. A risk manager never scales into widening ranges. They scale into tightening ranges.
The second step is measuring invalidation distance. Risk officers place stops beyond structure, not arbitrary percentages. A stop below a random 1% or 2% rule means nothing if the structure required 3.5% distance to invalidate the narrative. Your stop must sit beyond the point where the market proves the opposite story. If your invalidation distance widens while volatility expands, that is alignment. If it widens while volatility contracts, that is a process breach.
Next comes execution quality scoring. Professionals deconstruct execution into sequence components: liquidity sweep first, micro-structure break second, displacement third, retest respected fourth, impulse continuation fifth. A trade that triggered on the first touch of a level without displacement is not a good fill. It is the fill the market used for liquidity. Score execution quality based on whether the sequence completed before entry, not whether the P&L was positive.
The fourth layer is correlation risk. Risk auditors measure how many positions were open simultaneously on the same asset or narrative theme. One trade rarely kills a small account. Correlated trades during the same thesis do. Mistake correlation compounds drawdown faster than strategy flaws ever could. Limit correlation by design, not hindsight.
Finally, audit outcomes against process wins. A trade that worked without a reason is not audit approval. A trade that worked because it followed a reasoned sequence is. When you measure behavior instead of candles, you gain intervention points. Intervention points protect capital. Reflection points identify capital already lost.
Small accounts scale when traders audit like capital protection matters more than capturing the entire move. Your audit should produce fewer open questions and more closed rules. The goal is not to defend the trade. The goal is to defend the account.

RSI Is Not a SignalRSI is one of the most widely used tools in trading, yet it is also one of the most misunderstood. Many traders approach it as a switch. When the line reaches a certain level, they expect price to react. When it does not, frustration follows. The issue is not the indicator itself, but the expectations placed on it.
RSI reflects how aggressively price has been moving over a recent period. It gives insight into pressure, participation, and pacing. What it does not do is decide when price should reverse or continue. Markets can remain stretched far longer than most traders anticipate, especially during strong trends. When that happens, RSI staying elevated or depressed is a sign of persistence rather than exhaustion.
Context changes everything. In a clearly trending market, RSI often settles into a higher or lower band and fluctuates within it. Pullbacks that look extreme on the oscillator are often normal pauses in price rather than warnings of a reversal. Traders who react to those readings without considering structure often find themselves trading against the dominant flow.
Range-bound conditions tell a different story. When price rotates between defined highs and lows, momentum naturally fades near the edges. In those environments, RSI extremes tend to align more closely with short-term turning points. The same indicator behaves differently because the market itself is behaving differently.
Another source of confusion comes from fixed thresholds. Levels such as 30 and 70 are treated as universal rules, even though they were never meant to apply across all instruments and conditions. Some markets trend with RSI rarely dropping below 40. Others rotate for weeks without ever reaching classical extremes. Blindly applying static levels removes nuance from decision-making.
RSI becomes useful when it is read as part of a broader process. Structure, liquidity, and location should come first. Momentum then helps assess whether price behavior supports the idea or raises caution. When used this way, RSI adds clarity instead of pressure.
Traders who struggle with RSI are often searching for certainty. RSI does not provide certainty. It provides information. Those who learn to interpret that information within market context stop forcing trades and start aligning with what price is actually doing.

Bitcoin - time to take 100k Bitcoin - time to take 100k
Price is at VAH with rising open interest
all other coins are pumping
That's why I think BTC cna take that zone
after we`ll se what's next - big drop or break above VWAP

Bitcoin BTC Update: Waiting for Trend Confirmation | Key Levels I’m currently watching Bitcoin (BTC) closely — and right now, it’s sitting in no man’s land. We’ve had a bullish break, but a full trend reversal isn’t confirmed yet. For that, we need to see BTC break the most recent highs and retest the level successfully, holding above it to confirm a proper bullish shift.
At the moment, BTC is trading between a major institutional support zone and strong resistance. How it reacts at these key levels will determine the next move.
Here’s my plan:
Buy Opportunity: If BTC breaks above the recent highs and holds, I’ll be looking for a long entry.
Sell Opportunity: If BTC breaks below support, I may look for a short position.
There’s no confirmed trend yet, so patience is key. I focus on institutional levels, market structure, and price action to identify trade opportunities.
⚠️ Risk Management Reminder: Always protect your capital, scale out partial profits where possible, and adjust your stop loss to minimize risk.
❗ Not financial advice: This content is for educational purposes only and reflects my personal market analysis.

DOGE/USDT | Retesting the supply zone (READ THE CAPTION)As you can see in the 4H chart of DOGEUSDT, yesterday, it reached a high of 0.15656, hitting the low of the supply zone, but then it faced a massive drop in price, all the way to 0.14352, and now is being traded at 0.14900, retesting the high of the first supply zone.
I expect DOGE you to break through the first 2 supply zone, retesting the 3rd one.
For the time being, the targets are: 0.15000, 0.15330 and 0.15656 and 0.16000.
However, if it is rejected, the bearish targets are: 0.14680, 0.14350 and 0.14020.

BTC Hits a Wall: Is a $90k Liquidity Grab Next?COINBASE:BTCUSD is currently testing the upper limits of its recent relief rally, which saw a ~17% recovery from its late-2025 local bottom of $80,600. After a strong five-day streak of gains to start January 2026, momentum is showing signs of exhaustion as price encounters a dense supply wall in the $93,600 – $94,500 range. The market structure on the H1 timeframe reveals a series of failed attempts to break the local high, suggesting a transition from an impulsive phase to a distribution or corrective phase.
The technical alignment remains precarious. While the broader sentiment has improved due to slowing ETF outflows and new institutional positioning for the year, the short-term price action is struggling to maintain its footing above the psychological $93,000 level. The price is currently hovering near the EMA 50, which is the immediate dynamic support. A failure here would likely confirm the bearish projection indicated by the current rejection from resistance.
Key Levels
Resistance: 93,696 – 94,563 (Local High & Supply Zone)
Support: 90,690 – 90,979 (Major Support Zone)
Mid-Level Pivot: ~92,222
EMA 50 Support: ~92,737
Trading Scenarios
➡️ Primary: Rejection at the $93,339 resistance level → downward move to test the $92,222 pivot → eventual deeper correction into the $90,690 – $90,979 Support Zone to gather fresh liquidity.
⚠️ Risk: A decisive breakout and acceptance above $94,563 would invalidate the corrective outlook, potentially triggering a "short squeeze" toward the $97,000 – $100,000 targets.

At Trendline Resistance — Pullback Before the Next Leg?BITSTAMP:BTCUSD is pressing into the descending trendline resistance after a strong impulsive rally. Momentum remains constructive, but price is now at a reaction area, where profit-taking and pullbacks are likely. The broader structure still favors continuation as long as higher lows are maintained.
The EMA cluster is rising and aligning with a strong demand zone, supporting a dip-buying framework rather than immediate reversal.
Resistance: 93,200 – 93,800 (trendline)
Support: 89,200 – 89,800 (strong demand)
EMA support: ~90,600
➡️ Primary: rejection at trendline → pullback into 89.2k–89.8k → higher low → continuation higher.
⚠️ Risk: clean breakout and acceptance above trendline opens extension toward new highs without a deep pullback.

BTCUSD WARNING: The Ultimate Bull Trap or a One-Way Ticket......Hello traders! Here’s a clear technical breakdown of BTCUSD (1H) based on the current chart structure.
Market Structure: Bitcoin is currently displaying a textbook bullish trend structure. Following a solid pivot low, the market has transitioned into a series of aggressive impulse moves, characterized by clear Higher Highs (HH) and Higher Lows (HL). The EMA 89 (yellow line) is sloping upward and trending below the price, providing strong dynamic support and confirming that the primary trend remains firmly bullish.
Price Action and Continuation: After the most recent impulse leg, BTCUSD has entered a healthy corrective phase. This pullback is occurring on decreasing volatility, forming what looks like a Bull Flag or an ascending continuation pattern. Crucially, the current pullback is holding well above the previous Higher Low (HL), suggesting that this is a "buy the dip" opportunity for smart money rather than a trend reversal.
Key Levels: The immediate Demand Zone is located around the 93,150 level, which aligns with the current corrective floor and the EMA 89 support. On the upside, the previous Higher High at 94,750 serves as the immediate resistance target.
My Scenario: As long as BTCUSD maintains its structure above the current 93,150 Support Zone, the broader bullish expansion remains the dominant play. I expect a period of accumulation here before an explosive move higher to retest and break the 94,750 peak. However, a decisive close below the EMA 89 would signal a loss of momentum and could open the door for a deeper correction to flush out late longs.
Manage your risk!

The Stealthy Ascent: Decoding Bitcoin’s Strategic Pullback....Hello everyone,
On the H1 timeframe, the key focus right now is not the recent bearish candles, but how Bitcoin (BTC/USD) is reacting after rejecting from the upper boundary of its ascending channel and pulling back into a well-defined support structure.
Structurally, the market remains contained within a remarkably clean ascending channel, with price consistently forming higher highs and higher lows since the start of the year. The most recent push higher stalled precisely at the upper resistance line and the $95,000 psychological level, where sellers stepped in to lock in profits. This rejection confirms that the upper boundary is still a formidable barrier and that a period of cooling off was necessary after the recent impulsive move.
Following that rejection, BTC is now rotating lower toward the $92,500–$93,000 support zone, which aligns perfectly with the lower trendline of the channel. This area is technically important: it has served as a consistent reaction base, as seen in the previous sessions highlighted on the chart. The current move lower appears orderly and corrective—a classic "retest" of the support—rather than a signs of an impulsive breakdown or a change in the primary trend.
From a price action perspective, there is no confirmed trend reversal at this stage. The decline into the lower boundary fits well with a healthy pullback within the broader bullish structure. As long as price holds above this ascending support, the downside follow-through remains a temporary rebalancing act.
The projected path on the chart reflects this logic:
- A test or sweep of the $92,800–$93,000 support zone to check for fresh demand.
- A technical rebound back toward the mid-range of the channel.
- Potential continuation higher toward the $96,000+ level if buyers regain strength at the boundary.
Only a clean breakdown and acceptance below the channel's support line would invalidate this bullish pullback scenario and open the door for a deeper correction toward the $90,000 handle. Conversely, a strong bounce here would be the first signal that the bearish pressure was merely transitory and that the market is ready to challenge new highs.
Until confirmation appears, Bitcoin is not breaking its trend; it is simply rebalancing after a rejection at the highs, and patience around these key levels remains critical.
Wishing you all effective and disciplined trading.

BTC $94.5K Fatigue: Decoding the $92.3K Line in the SandBitcoin (BTC/USD) Technical Breakdown
Bitcoin recently completed a steep impulsive move, encountering significant selling pressure at the Resistance Zone ($94,400 – $94,600). The appearance of long upper wicks (rejection candles) at this level confirms that profit-taking is underway, pushing price back to test internal liquidity.
The pair is currently trading near the blue EMA, which serves as immediate dynamic support. However, the short-term bias remains tilted toward a deeper "healthy pullback" to re-accumulate buy orders. The Support Zone around $92,300 is the critical "pivot area" where institutional demand is expected to resurface.
Key technical scenarios:
- Base-case scenario: Following the projected path on the chart, BTC is likely to continue its retracement toward the $92,300 support. A bullish reversal signature (such as a pin bar or engulfing pattern) at this level would confirm a Higher Low (HL) and set the stage for a recovery test of $93,300 and beyond.
- Bullish continuation: Should the bulls defend the $92,900 level and decisively reclaim $93,500, the correction may end prematurely, opening the door for an immediate retest of the $94,500 supply zone.
- Bearish risk: A decisive close below the $92,000 psychological level would invalidate the immediate bullish structure. This would expose BTC to a deeper correction toward $91,000 or the $90,000 liquidity pool.
Macro Drivers Impacting Bitcoin
As of January 2026, Bitcoin's price action is heavily influenced by institutional flows and global macro shifts:
- ETF Inflows & Institutional Floor: The maturity of Spot ETFs has created a persistent "floor" for price. Current volatility is likely driven by early-year portfolio rebalancing by major asset managers.
- Monetary Policy & Fed Outlook: Market participants are closely monitoring Fed signals. Expectations of quantitative easing or rate pauses in Q2 2026 continue to support the long-term "debasement trade" narrative, favoring BTC.
- Geopolitical Risk Premium: Ongoing tensions in key global regions (Middle East/Eastern Europe) reinforce Bitcoin’s status as "Digital Gold." Safe-haven flows tend to limit the downside during macro uncertainty.
- Risk-On vs. Risk-Off Sentiment: The Fear & Greed Index remains in "Greed" territory. While the trend is bullish, this high sentiment often precedes "liquidity sweeps" where over-leveraged long positions are flushed out at key support levels.
Summary
Technically, Bitcoin is undergoing a textbook correction after hitting a major resistance ceiling. This phase is essential for market health, allowing for the rotation of capital and the removal of weak-handed leverage.
The $92,300 support is the line in the sand. As long as price holds above this zone, the broader bullish trend remains intact. Traders should remain disciplined, waiting for confirmed price rejection at support rather than chasing the move mid-range.

Bitcoin Holds Firm, Bulls Stay in ControlBTCUSDT is currently trading around 93,300–93,400 USDT, holding onto its upward momentum after the strong breakout seen in early January. The market still looks buyer-driven, with recent pullbacks appearing more like healthy technical corrections rather than a shift in sentiment.
From a broader perspective, crypto market sentiment continues to improve as capital flows back into risk assets and expectations grow that global liquidity conditions may ease in the coming period. This backdrop allows Bitcoin to maintain its role as a market leader, especially since there has been no negative news strong enough to trigger a reversal.
The preferred scenario remains a continuation of the short-term uptrend. As long as BTC holds above the rising trendline, a clean break above 94,000–94,500 could open the door toward the 96,000 USDT area in the near term. On the downside, any pullbacks into current support zones are still viewed as constructive pauses within an intact bullish structure, rather than signs of trend exhaustion.

Bitcoin closes 3 months red—relief rally now! Altcoins updateThe relief rally is on! Bitcoin closed three months red and this is now confirmed and this does two things: (1) A relief rally is now guaranteed but (2) also a bearish continuation long-term.
Let's see what we can expect on this relief rally.
Without a shadow of doubt; with 100% certainty, we get January 2026 green. That is an entire month of bullish action.
Based on past history, a relief rally lasts always two months minimum but it can be more. This means that February 2026 we also get green but there can be some variations, let's look at those.
February will be bullish but reaching the end of the month prices can start to drop. Think of this, Bitcoin goes high up and while the month closes green a decline is present on the daily timeframe before the month closes and then we get red in March. This is the standard relief rally.
The second variation goes like this: Bitcoin rises and produces a strong close in February, in March 2026 we get additional growth also until the first half and after the first half the market turns red and starts dropping.
The bearish trend is already confirmed by three months red. Bitcoin never closed three consecutive months red since the peak in 2021. This means that we have these two months to make the most out of Bitcoin but, what about the altcoins?
The altcoins will be mixed growing super strong. The altcoins vs bitcoin trading pairs will do awesome and many can even grow while Bitcoin goes down. The market is big and will continue to grow. There will be endless opportunities while Bitcoin cements its bottom.
The altcoins that we are reading as bullish can follow Bitcoin the first few weeks or an entire month when Bitcoin start to decline and then detach and move ahead. Many of these projects that we are seeing as bullish long-term can falter by producing strong volatility, big red candles followed by a strong reversal. There will be projects growing, many of them, while some of the big ones go down.
Just know: Just as the bull market can never be cancelled or nullified, it happens like clockwork, it is the same for the bearish wave. The good news is that a big portion of the bearish action is already in and we have plenty of time to adapt and prepare. In fact, we can even profit from the bearish cycle if we plan ahead of time.
Thank you.
Namaste.

ADA/USDT | $ADA Demand Zone Played Out Perfectly – 33% Surge!CRYPTOCAP:ADA dropped into the $0.32–$0.36 demand zone exactly as forecasted. Once it hit the zone, strong buying pressure kicked in, launching the price above $0.43 and delivering a sharp 33% rally. The main analysis remains valid. As long as price holds above $0.38–$0.40, new bullish targets are $0.46, $0.50, and potentially $0.54.
Please support me with your likes and comments to motivate me to share more analysis with you and share your opinion about the possible trend of this chart with me !
Best Regards , Arman Shaban

Bitcoin: Range Mode After Rejection — Break Levels MatterLadies and gentlemen, After reacting to 94,330.16, Bitcoin got hit with a strong rejection and dropped about 3% (down to pivot point level 4). I'm expecting a range in these areas until tomorrow. 🧙♂️
📈If a range forms, we can open pre-breakout longs on breaking its ceiling. If you want to play it safe for longs, wait for a break of resistance 94,330.16 —there's a ton of liquidity in this zone, and its break would be massive. That's probably why I say it's better to have pre-breakout positions.
📉For shorts, we need to see lower highs on the 4H timeframe—nothing there right now.
Capital management—don't ever forget it, and stay miles away from FOMO.
By the way, I’m Skeptic, founder of Skeptic Lab.
I focus on long-term performance through psychology, data-driven thinking, and tested processes.
Thanks for riding this idea—if it delivered value, hit that boost to keep the momentum rolling and follow to build the squad. Toss any symbol you want dissected in the comments, I'll handle it. 🩵
Now get outta here.

BTCUSDT.P - January 7, 2026Bitcoin has dropped sharply into a major support zone at 91,000–91,300, where prior buying interest is evident, while overhead resistance stands near 93,800–94,000. A long entry is favored on retracements holding within 91,100–91,300, targeting a rebound toward 93,500–94,000. A stop-loss should be placed below the lower support at 90,200–90,400, as a break there would signal continuation of the decline.

Bitcoin Pumps With Gold & S&P — But Is a Pullback Coming First?Bitcoin ( BINANCE:BTCUSDT ) started the new week with bullish momentum, pumping alongside Gold( OANDA:XAUUSD ) and the SPX500 Index( SP:SPX ).
At the moment, Bitcoin is trading within a resistance zone($94,840-$93,020), close to the upper line of the ascending channel, while also moving around the Cumulative Short Liquidation Leverage($94,970-$94,300).
From an Elliott Wave perspective, it appears that Bitcoin is in the process of completing microwave 4 of the main wave C.
My expectation is a minimum pullback toward the Cumulative Long Liquidation Leverage($92,190-$91,610) and the nearby support zone($90,960-$90,090). From that support zone($90,960-$90,090), we can look for a potential renewed bullish move.
Note: If geopolitical tensions in the Middle East escalate, a sudden and sharp drop in Bitcoin is possible.
Note: If Bitcoin breaks and holds below the support zone($90,960-$90,090), we should be prepared for a deeper downside continuation.
Cumulative Long Liquidation Leverage: $87,140-$86,210
Cumulative Short Liquidation Leverage: $98,480-$96,970
CME Gap: $91,595-$90,530
CME Gap: $88,720-$88,120
First Target: $90,029
Second Target: $90,867
Stop Loss(SL): $96,223(Worst)
Points may shift as the market evolves
💡 Please respect each other's opinions and express agreement or disagreement politely.
📌Bitcoin Analysis (BTCUSDT), 1-hour time frame.
🛑 Always set a Stop Loss(SL) for every position you open.
✅ This is just my idea; I’d love to see your thoughts too!
🔥 If you find it helpful, please BOOST this post and share it with your friends.

BTC is on Weekly trendline Area : New ALL Time High ?BTC is on Weekly trendline Area : New ALL Time High ?
I am seeing BTC cross above 150k

BTC Intraday Short
Context:
Working within the current market structure and liquidity framework, I’m monitoring signs of buyer weakness at current levels.
Observation:
• Ask-side imbalance
• Anomalous volume
• Lack of upside continuation
Expectation:
A potential intraday pullback toward the first target at 91,800.
Risk:
This is a higher-risk environment, therefore position sizing and execution discipline are critical.
Note:
Bias does not equal execution.
Follow for updates and next intraday ideas.

XAU/USD | Bullish momentum continues (READ THE CAPTION)As you can see in the Hourly chart of Gold, the market opened at 4356 yesterday and then it went on a Bullish Move, reaching as high as 4475. That means in a matter of a single day, Gold moved more than 1000 pips!
Currently it is being traded at 4455, I can see it going going to the high of the FVG and then going upwards again.
Gold Targets for now: 4463, 4475, 4487 and 4500.
P.S: Be cautious with your trades and watch out for geo-politic events.

BTCUSD(bitcoin): Double Bottom Breakout ScenarioHi!
Bitcoin is forming a double bottom structure after a prolonged downtrend. The descending trendline has been broken, indicating a potential shift in market structure.
Price is currently approaching a key resistance zone around 99,000. A confirmed breakout above this level would validate the double bottom and open the door for further upside.
• Support: 93,000–94,000
• Resistance: 99,000
Targets (if resistance breaks):
• Target 1: 99,000 (retest/confirmation)
• Target 2: 103,500 (measured move of the double bottom)
As long as price holds above support, the bias remains bullish, with continuation dependent on a clean break above resistance.
Disclaimer: As part of ThinkMarkets’ Influencer Program, I am sponsored to share and publish their charts in my analysis.
