ETHUSD: breakout above 2,200🛠 Technical Analysis: On the H4 chart, ETHUSD remains in a broader bearish trend after the sharp decline from the upper resistance zones around 2,900 and 3,300. Price has now transitioned into a base-building phase, forming an accumulation range after the selloff. The key technical trigger is the upper boundary of this accumulation near the 2,140–2,200 resistance area. A confirmed breakout and hold above this zone would signal a recovery leg toward the next supply at 2,430, with a wider objective into the 2,400–2,500 area. Note that the moving averages (SMA 50/100/200) are still overhead, so this move is treated as corrective until ETH reclaims higher resistance. If buyers fail to break above the range and price slips back below the base, the downside risk returns with a possible retest of the lower support band.
———————————————
❗️ Trade Parameters (BUY)
———————————————
➡️ Entry Point: 2,142.28 (buy on confirmed breakout above the 2,140–2,200 resistance)
🎯 Take Profit: 2,431.75
🔴 Stop Loss: 1,950.94
⚠️ Disclaimer: This is a potential trade idea based on current analysis; market conditions and price direction are subject to change based on news factors and volatility.
Bitcoin (Cryptocurrency)

XAU/USD | Going for the NDOG (READ THE CAPTION)By examining the hourly chart of Gold we can see that after touching the Daily IFVG Low and going as high as 5116, it dropped in price and experienced a massive drop after the NFP news drop. It has somewhat recovered from the drop, but it's been consolidating in the same zone for the past couple of days, currently being traded at 5063. I expect gold to go for the Feb 12th NDOG soon, and then after the initial reaction we'll see how gold reacts.

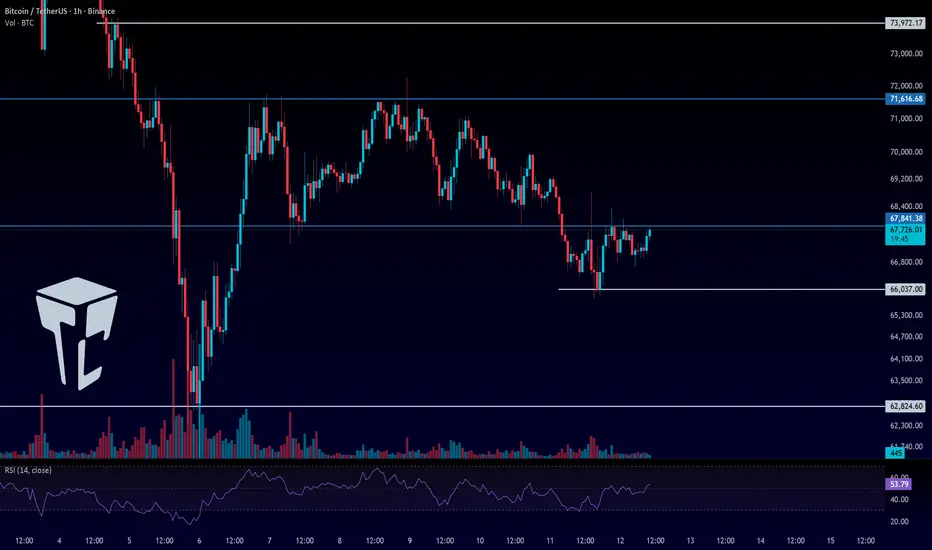
TradeCityPro | Bitcoin Daily Analysis #266👋 Welcome to TradeCity Pro!
Let’s move on to Bitcoin analysis. After activating our trigger yesterday, the market is now moving sideways.
⌛️ 1-Hour Timeframe
At the moment, Bitcoin has formed a small range box between 66,037 and 67,841, and after breaking 67,841, price has entered a consolidation phase.
✨ The fact that price started ranging after the break of 67,841, without bearish momentum entering the market, shows that sellers don’t currently have enough strength and haven’t been able to win the battle against buyers.
✔️ On the other hand, buyers haven’t been able to fake this breakout either, so their strength isn’t dominant as well. Overall, we can say that there’s no clear power or momentum in Bitcoin right now.
✨ If price doesn’t spend too much time inside this range and breaks out before the end of today’s New York session, momentum could enter the market.
📊 A break above 67,841 would confirm that the bearish move was fake and signal the entry of bullish momentum.
A break below 66,037 would confirm the continuation of the bearish move.
💥 Personally, I won’t open a long position on the break of 67,841, but I’ll be watching closely in case the market gives a trigger for a risky long position. The main long trigger remains 71,616.
⚖️ For shorts, the 66,037 level is a valid trigger. If you don’t already have a short position, you can enter on a break of this level.
💡 Since the market currently lacks momentum, RSI isn’t very useful right now. We should wait for the next impulsive leg to begin before relying on momentum oscillators again.
❌ Disclaimer ❌
Trading futures is highly risky and dangerous. If you're not an expert, these triggers may not be suitable for you. You should first learn risk and capital management. You can also use the educational content from this channel.
Finally, these triggers reflect my personal opinions on price action, and the market may move completely against this analysis. So, do your own research before opening any position.
ETH/BTC 4H – Pressure Building Below Channel ResistanceETH/BTC continues to trade within a well-defined descending channel (Base Channel) following the completion of a prior impulsive decline. The recovery attempt has remained structurally weak, producing lower highs while respecting the lower boundary of the channel.
Price is currently approaching a confluence between the 0.236–0.382 retracement region and the lower boundary of the parallel channel. This area also aligns with prior breakdown structure, making it a technically sensitive level.
Price appears to be forming a temporary consolidation near resistance. If this rebound stalls below the lower boundary of the channel, the next move is likely to be another decline toward the lower part of the structure, with downside targets projected below recent lows. If the price decides to break in the parallel channel, then the move is likely headed upwards targeting the middle and upper boundaries. As long as the Wave (4) invalidation area is not violated, the count remains valid.
The broader bias remains negative while price trades below the highlighted invalidation band near 0.0325–0.0330. A sustained move above that region would neutralize the immediate downside scenario.
Until then, rallies appear corrective rather than impulsive.

BTC AB-CD IS THE BEST CASE...Morning folks,
So, BTC under the negative wave - massive sell-off, whales' buying can't help, Clarity Act is stuck etc...
By technical picture market is strongly oversold. At the same time, price stands too close to downside AB=CD target @52K to ignore it. So, we suggest chances on solid pullback from 52K as solid .
That's why now, if even we get the pullback it will not be the major one. At the best case scenario we will get minor AB-CD to ~75-76K area from 5/8 support. Most probable that we get a kind of Double Bottom instead with the same target.

GBP/USD | NWOG Retest (READ THE CAPTION)As you can see in the 30m chart of GBPUSD, after it hit the Feb 9th NWOG Midpoint (Consequent Encroachment), it bounced back up, but after hitting Jan 26th NWOG Low, it dropped again, going back to the Feb 12th NDOG, hitting it and going back up a bit and it is now being traded at 1.3638.
I expect GBPUSD to retest the Jan 26th NWOG.

EUR/USD | Going back to 1.1900 (READ THE CAPTION)Well hello folks, Amirali here.
Starting the day with an analysis on the 15m chart of EURUSD, after it hit the Bullish OB it started a upwards move, going through Today's NDOG, and now being traded at 1.1877. If it holds above today's NDOG, I expect to go higher and going for the Feb 11th NDOG.
Targets: 1.1885, 1.1893 and 1.1900.
If it goes below the NDOG: 1.18700, 1.1863 and 1.1855.

BTCUSD (1M): The Bottom SignalMacro Analysis
We are analyzing the Monthly (1M) Logarithmic Chart of Bitcoin utilizing Bollinger Bands and RSI. This setup has historically pinpointed every major cycle bottom with high precision.
Lower Bollinger Band Test: The price action has retraced to the Lower Bollinger Band. Historically (as marked by the upward arrows on the chart), touching or hugging this lower band indicates the cyclical "accumulation zone." We saw this in 2015, 2019, 2020, and 2022. We are currently testing this zone again.
RSI at 43: The Monthly RSI is currently at 43, sitting exactly on the historical support line (red horizontal line).
Every time the Monthly RSI has touched the 42-44 zone in the last 14 years, it marked the end of the bear market/correction phase.
This suggests that seller momentum is mathematically exhausted on a macro scale.
While the indicators suggest a bottom, the price is currently below the Middle Band (Red Line). This confirms we are in a "buyer's market" (accumulation) rather than a confirmed bull run. The strategy here is accumulation at support, anticipating a mean reversion to the middle band.
Bitcoin is trading at a "Maximum Financial Opportunity" zone based on historical Logarithmic Band and RSI data. While fear is high, the math suggests the downside is limited compared to the cyclical upside.
BBW (Bandwidth)

GBPJPY outcome!GBPJPY waiting for a strong confirmation to go in LONG with a bounce at or near the TrendLine. Not being PATIENT is part of the trading strategy that most people lose.

BTCUSD Falling Wedge Breakout Setup | 69K TargetBTCUSD on the 30m timeframe is forming a clear falling wedge pattern after a sharp sell-off. Price is compressing near the lower trendline with multiple rejections, showing signs of accumulation and seller exhaustion.
A breakout from this wedge can trigger a strong bullish move. The structure suggests a potential push toward the 69,000 – 69,200 resistance zone if buyers step in with volume.
🔹 Falling wedge pattern (bullish reversal)
🔹 Higher lows forming inside compression
🔹 Key breakout level near current consolidation
🔹 Target zone: 69K area
Watching for a clean breakout and retest for confirmation. This setup offers a good R:R for intraday traders.
Trade safe. Wait for confirmation

ETH/BTC Losing Momentum Below 21 MA#ETH/BTC on the daily timeframe is trading inside a clear descending channel structure.
Price recently broke back below the 21 MA and lost the 0.0324 range support. That former range is now acting as resistance. The pair is currently sitting near the mid-to-lower portion of the channel, with immediate structure support around 0.0290.
Below current price, the major higher timeframe support sits at 0.0259. This level aligns with historical reaction and is the key level to watch.
If 0.0290 fails to hold, the market is likely to rotate into the 0.0259 demand zone. A loss of 0.0259 opens the path toward 0.0194, which is the next major structural support on the chart.
On the bullish side, reclaiming the 21 MA and breaking back above 0.0324 would be the first sign of strength, opening room toward 0.0354 and potentially the upper channel boundary.
Currently, structure remains bearish while price stays below the channel midline and 21 MA.

BITCOIN (BTCUSD): Another Bearish Wave Coming?!
It feels like Bitcoin is preparing for another bearish move.
The market completed a consolidation, breaking
a support of a horizontal range on a daily time frame.
The closest strong support is 63000.
I think it will be reached soon!
❤️Please, support my work with like, thank you!❤️

BITCOIN Very strong zonesThese zones represent strong structural support. Should Bitcoin trade into these areas, they offer high-probability long opportunities.
BINANCE:BTCUSDT CME:BTC1! BYBIT:BTCUSDT

Bitcoin is going to the hell???hi follow me , boost this post and read
everything shows me that bull trend is over , weakness in highs , candles and the momentum
the targets for retracement is 83 to 74 and after that 50k
i know its hard to hear that but this is market he do what he wants so accept it.
thank you. i reply to questions anytime.

IS BITCOIN READY FOR A HUGE PUMP?!!!!!! (must see) Yello Paradisers! Enjoy the video!
And Paradisers! Keep in mind to trade only with a proper professional trading strategy. Wait for confirmations. Play with tactics. This is the only way you can be long-term profitable.
Remember, don’t trade without confirmations. Wait for them before creating a trade. Be disciplined, patient, and emotionally controlled. Only trade the highest probability setups with the greatest risk to reward ratio. This will ensure that you become a long-term profitable professional trader.
Don't be a gambler. Don't try to get rich quick. Make sure that your trading is professionally based on proper strategies and trade tactics.

BTC long-term TABitcoin is still in a very bearish formation, there has been no change in trend direction since October last year.

BTC/USD - Advanced Wyckoff Distribution Analysis: Targeting $61K
Hello Traders,
I’m sharing my latest outlook on Bitcoin, utilizing a pure Wyckoff Method approach to identify the current market cycle. We are currently witnessing a textbook Distribution schematic playing out.
Technical Breakdown:
Schematic Identification: After a prolonged consolidation, the price failed to sustain momentum above the $71K-$72K zone.
Phase C & LPSY: Following the "Test" of the highs (Upthrust), we saw a clear rejection. The subsequent LPSY (Last Point of Supply) confirmed that the path of least resistance is now to the downside.
Current Trade: I am currently in a short position. Stops have already been moved into profit to ensure a risk-free ride to the target.
Target: My primary objective is the $61,900 region, where we expect to see the completion of this markdown phase.
About the Analyst: I am Daniel, a Wyckoff specialist with 12 years of experience in the financial markets. My expertise lies in deciphering institutional footprints and market cycles. In a world of indicators, I prefer to focus on the only thing that matters: the relationship between Supply and Demand.

BTC: The "Invisible Wall" at $70k (Why We Flush to $59.8k)The retail narrative is that Bitcoin is "consolidating" at $70k. The On-Chain data says Bitcoin is DISTRIBUTING . We just hit an "Invisible Sell Wall" driven by three massive structural failures. This is not a dip to buy; it is a Rational Deleveraging triggered by a $6.3B supply shock that the market cannot absorb.
1. THE ON-CHAIN REALITY (SUPPLY SHOCK) ⛏️
• Miner Capitulation: Miners transferred 90,000 BTC ($6.3B) to exchanges in the last 72 hours.
• Historic Magnitude: This is the largest miner sell-off since 2024, signaling they are selling to survive as margins tighten.
• The Impact: Spot demand cannot absorb $6.3B in selling pressure without a significant repricing event. The "Wall" is real.
2. THE MACRO & STRUCTURE 📉
Bearish Triggers:
• Yield Spike: US 10-Year Treasury Yields spiked to 4.17% . When risk-free rates rise, capital flees crypto.
• Capital Flight: While BTC is down -3%, high-beta alts (BNB, ZEC, SUI) are down -6%+, signaling a "Risk-Off" environment where liquidity exits to USD, not Alts.
• Broken Support: We lost the 200-Week EMA at ~$68,000, a major secular bull/bear line.
The Conflict:
Retail is waiting for "Alt Season" while Institutions are executing a "Flight to Safety." The divergence between the Miner Sell Wall and retail hope creates a trap at $66k.
3. THE TRADE SETUP 🎯
🔴 Scenario A: The Rational Deleveraging
• Trigger: Rejection at $67,500 - $68,000 (Retest of broken 200W EMA support)
• Entry: $67,500 zone (selling into the Miner Wall)
• Target 1: $62,000 (October Support Cluster)
• Target 2: $59,800 (The "Weak Low" Liquidity Sweep)
• Stop: 4H close above $70,500 (Invalidates the Miner Capitulation thesis)
🟢 Scenario B: The Reclaim (Low Probability)
• Trigger: Daily close back above $70,000
• Context: Requires Miners to stop selling and Coinbase Premium to flip positive
• Target: $74,000 range high
MY VERDICT
The "Miner Wall" is too heavy. The market needs to clear the leverage at $59,800 before the bull run can resume. I am positioning SHORT into any relief rally near $67.6k. Confidence: 75% Bearish

bitcoin keeps going down & downmore downward impulse for bitcoin as things are not looking very bright for crypto investors, every upward correction is a chance to exit COINBASE:BTCUSD

Is Bitcoin About to Complete Wave C and Explode Upward?First of all, make sure to pay close attention to the timeframe — this analysis is based on the 1-day timeframe.
Bitcoin appears to be approaching the completion of wave C within the current corrective structure. If this count plays out as expected, we could see the end of the corrective phase soon, followed by a potential bullish reversal. The next upward move may develop either as a new impulsive wave to the upside or as an X wave within a larger corrective structure. In both scenarios, the probability of a bullish continuation increases once wave C is fully completed and confirmed.
On the chart, two key trendlines are marked in red. These trendlines are critical for short-term price direction. A confirmed breakout above the first trendline would be an early signal of strength and could open the path for price to move toward the second trendline. The second trendline acts as a higher-level dynamic resistance, and the reaction there will provide further confirmation of whether the market is transitioning into a stronger bullish phase.
A clearly defined support zone is also highlighted on the chart. This area represents a potential accumulation region. Rather than entering with a full position at once, a DCA (Dollar-Cost Averaging) strategy is recommended within this support range to manage risk more effectively and reduce the impact of short-term volatility.
Upside targets are specified on the chart as well. As part of proper risk management, it is advisable to secure the trade at the first target by moving the stop loss to breakeven. This approach allows traders to eliminate downside risk while keeping exposure for potential continuation toward higher targets.
As always, wait for confirmation, manage your risk carefully, and avoid overexposure in volatile conditions. This analysis is based on the current wave structure and trendline behavior, and it should be reassessed if the market invalidates the outlined scenario.
If you have a coin or altcoin you want analyzed, first hit the like button and then comment its name so I can review it for you.
This is not a trade setup, as it has no precise stop-loss, stop, or target. I do not publish my trade setups here.

ETH: The $80M "Whale Trap" (Why $1,930 Is Next)Most traders are celebrating the $80M Long that just opened on Hyperliquid.
They think this is a "Bullish Whale."
They are wrong.
My on-chain analysis confirms this is a classic Liquidity Hunt . Here is the data retail is missing:
1. The "Bait" (Hyperliquid Whale)
A fresh wallet (0x6C85) opened an $80.9M Long at ~$2,039 .
The Flaw: They used 20x Leverage .
The Math: Their Liquidation Price is mathematically pinned at ~$1,930 .
2. The "Hammer" (Trend Research)
Simultaneously, institutional fund Trend Research deposited 35,000 ETH ($80.8M) into Binance.
The Reality: While the Speculator is Longing on-chain, the Institution is preparing to Sell Spot on Binance.
The Goal: Drive the Index Price down to $1,930 to force-liquidate the Hyperliquid whale and grab that $80M liquidity pocket.
3. Technical Structure (Bearish)
Market Structure: We are trapped in a Converging Wedge with a "Bearish Order Block" overhead at $2,148 .
Funding Rates: BitMEX spiked to +0.049% (Extreme Greed). When funding goes positive during a downtrend, it signals a "Bull Trap."
🎯 The Trade Plan
I am betting AGAINST the whale. The path of least resistance is a flush to the liquidation magnet.
❌ SHORT ZONE: $2,100 - $2,125 (Rejection at Bearish OB).
📉 TARGET 1: $1,930 (Whale Liquidation).
📉 TARGET 2: $1,600 (The "Air Pocket" Vacuum).
Verdict: Do not long here. Let the institutions finish their war. We buy the blood at $1,600 , not the bait at $2,039 .
Safe Trading,

SOLT/SBIT Trading Pair - 15 minuteThis is the SOLT/SBIT trading pair 15 minute chart. Trade 2x Solana long or 2x Bitcoin short ETF's in your brokerage account. We are trading SOLT because it generally outperforms Bitcoin on the upside. As there is no -2x Solana short ETF, we use SBIT for the downside. BEWARE! As these are leveraged ETF's you can get wrecked in a heart beat. Manage position size and use stop losses to limit risk! Not Financial Advice.
We are now trading at the bottom of a horizontal channel just off All Time Lows for the pair. Stochastic RSI is low, RSI is oversold, and the BlackCat indicator is nearing the end of a down trend. The horizontal channel coincides with a Bull Flag pattern on the Solana 1 hour chart. A buy of SOLT at $2.60 with a tight stop loss at $2.52 risks -2.90% with Solana target of $110 is about 44.5% upside potential for SOLT target of $3.74
See my 1 hour Solana chart for more technical analysis of the Solana trade.
WARNING! HIGH RISK, HIGH REWARD POTENTIAL.

When to Close Losers and When to Hold WinnersClosing losers and holding winners is not a mindset problem. It is a structural one. The decision should come from whether the market has invalidated your narrative or continues to support it. Emotion enters when that framework is missing.
A losing trade should be closed when the reason for the trade no longer exists. In practice, this happens when structure breaks beyond the point that defined risk. If price violates the level that anchored the setup, the market has proven a different story. Holding beyond that point turns analysis into hope. The stop is not there to protect comfort. It is there to protect logic.
Losers also need to be closed when market conditions change.
Volatility expansion, liquidity drain, or session transitions can invalidate a setup even if price has not reached the stop. If execution relied on clean participation and that participation disappears, staying in the trade increases risk without increasing probability. Capital is better preserved for conditions that support the original thesis.
Winners require a different lens. A trade should be held as long as structure continues to support the direction. Higher lows in an uptrend or lower highs in a downtrend indicate that control remains intact. Premature exits usually occur when traders focus on unrealized profit instead of structural confirmation.
Partial profit-taking can be used to reduce pressure, but full exits should align with objective signals. Momentum decay, failure to progress toward the next liquidity objective, or a clear structural break against the position are valid reasons to reduce or exit.
Another consideration is location. When price reaches major opposing liquidity or higher timeframe levels, risk increases. Holding through these areas without reassessment often leads to giving back gains. Exiting or reducing exposure here is a strategic decision, not a fear-based one.
The discipline lies in treating losses and gains symmetrically. Both decisions are governed by structure, liquidity, and environment. When trades are managed by narrative instead of emotion, losses remain controlled and winners are allowed to develop. Over time, this alignment does more for performance than any adjustment to entry technique.
