BTCUSD — Structure FirstAfter the recent liquidation-driven sell-off, BITSTAMP:BTCUSD has entered a very different phase.
Momentum is gone, volatility has compressed, and price is no longer behaving like it did during the impulsive advance that preceded the correction.
From a structural point of view, this move looks less like the start of a new bearish trend and more like a reset within a broader cycle. Higher-timeframe supports are still holding, and instead of continuation to the downside, price has stabilized and begun to balance.
This type of behavior usually appears between phases, not at the beginning of a strong directional move.
From a fundamental perspective, the picture is equally mixed.
Liquidity conditions remain tight, rate expectations are still uncertain, and risk assets are highly sensitive to macro data and policy communication. At the same time, Bitcoin is no longer trading in isolation — ETF flows, institutional positioning, and broader market correlation are now part of the equation.
In this environment, extremes tend to be punished.
Price needs time to absorb information, reposition participants, and rebuild structure.
That is why, at this stage, structure matters more than narrative.
Key Levels
Major structural support: 65,000 – 68,000
This is the area that separates consolidation from continuation. As long as it holds, the broader structure remains constructive.
Current acceptance zone: ~70,000
Price is stabilizing here. Acceptance or rejection around this level will define the next leg.
First meaningful resistance: 78,000 – 80,000
A clear supply zone where reactions are likely.
Higher-timeframe supply: 90,000+
A reference level if the market successfully rebuilds bullish structure.
Trade Framework
Base case (balance / recovery):
Acceptance between 70k–72k favors a rotation toward 78k → 80k → 85k.
This scenario assumes continuation of consolidation and gradual structure rebuild.
Recovery continuation:
Sustained acceptance above 74k–75k opens the path toward 85k → 90k, suggesting renewed confidence and participation.
Bearish continuation:
A daily close below 68k would invalidate the balance and shift the focus toward 62k and 58k as next downside areas.
Bitcoin is not in a momentum phase right now.
It is in a decision-making phase, shaped by both technical structure and a complex macro backdrop.
The reaction around 68k, 70k, and 78k will be far more important than short-term headlines.
Until structure resolves, patience and level-based execution remain the edge.
Illyrian Finance — Trading structure, not predictions.
Bitcoin (Cryptocurrency)

Its a Short Divergence Bull Trap Farm $BTC
We have been in a Bull Trap since October 26th 2025 when the first 2 week sunday closer Bull trap was set and executed.
- The Bulls buy pressure is being exhausted through 16 day weak short Divergence Swings followed by repeating 2 week Sunday Closer Bull Traps (estimated 60 days per swing).
- This is the third and final weak Short Divergence Trap in progress now (3 hour candles).
- We will reach a true divergence in 60 days (estimated time) and execute another 2 Week Sunday Closer Bull Trap before our final decent to 50k.
- When we reach 50k True Divergence will begin to set on the 4 hour Candles and Weekly Candles, whether it is wide or short will depend on public sentiment and buy pressure...
- The Divergence Buy Zones will be between 50k and 30k.
Good Luck!
CRYPTO:BTCUSD BITSTAMP:BTCUSD COINBASE:BTCUSD BINANCE:BTCUSD BINANCE:BTCUSDT

XAU/USD | Small upwards move? (READ THE CAPTION)As you can see, Gold has been moving between this week's NWOG and Jan 26th NWOG today. Currently it's being traded at 5011. If it fails to go through the 26th Jan NWOG and above 5050, I expect it drop in price, targets will be: 5000, 4990, 4980, 4970 and 4960.
However, if it manages to go through and stay above 5050 level, the short-term targets will be: 5060, 5070 and 5080.

Bitcoin Dips Below Key $70,000 LevelBitcoin Dips Below Key $70,000 Level
Bitcoin (BTC-USD) has slipped below the critical $70,000 threshold, down 2.41% amid broader crypto volatility and market rotations. This dip follows a wild ride, potentially signaling the end of a bear phase based on Sharpe Ratio metrics, but questions linger on sustained recovery.
Key facts: Trading near $68,500, BTC faces support at $65,000 with resistance at $72,000. The move correlates with tech sell-offs and AI capex shifts, where energy demands indirectly pressure crypto mining costs. Ethereum (ETH) shows similar weakness, down in tandem.
Implications: This could present buying opportunities 💡 for long-term holders, especially with interconnections to AI (e.g., data center energy) and commodities (gold as a hedge). However, risks from regulatory scrutiny and market sentiment tied to upcoming US jobs/CPI data warrant caution ⚠️. Altcoins may follow, amplifying volatility.
Links to bigger pictures: Bitcoin's movements often preview tech trends; watch for rebounds if Dow sustains above 50,000. Consider staking strategies for yields above 4% in stable protocols.

Bitcoin(BTC), has yet to reach a cyclical low.BINANCE:BTCUSDT
It’s been about four months since my post calling the end of Bitcoin’s bullish season, and here is an updated cycle-based outlook.
(CME chart during the 22-year bear market)
After forming a downside gap near the 81K level, Bitcoin saw a one-way selloff down to around 60K, followed by a technical rebound.
I believe this 81K gap is likely to be filled in the next bullish cycle, similar to the price action observed during the 2022 bear market.
From a cycle perspective, the macro bottom is expected to form around August–September 2026. Until then, Bitcoin may continue moving in a prolonged consolidation phase driven more by time correction than sharp price movements.
My projected downside target zones are:
• Primary zone: 49K–52K
• Deeper correction: below 39K
• Extreme scenario: toward the 32K region
However, if price moves up first and fills the 81K gap, this bearish cycle scenario will be invalidated.
Your follow and boost would mean a lot. 🚀

Bitcoin’s Unfilled CME Gap: A Price MagnetBitcoin currently has a CME gap between $79,600 and $83,730, which remains unfilled.
From a historical and statistical perspective, CME gaps have a strong tendency to be filled over time, making them important reference zones for both swing traders and long-term market participants.
At the moment, price has moved significantly away from this range, which reduces the probability of a gap fill in the short term and makes any immediate retracement less likely without a clear catalyst. Strong momentum and trending conditions can delay gap fills for extended periods.
However, this does not invalidate the gap. Instead, it should be viewed as a high-probability magnet zone that may come into play during future corrections, deeper pullbacks, or broader market structure shifts.
As long as this CME gap remains open, it represents a key area of interest for liquidity, potential support/resistance reactions, and higher-timeframe mean reversion. Traders should keep this zone marked on their charts and be patient, as sooner or later the market tends to revisit and fill these inefficiencies.
Risk management and confirmation from price action are essential when approaching this area.
If you have a coin or altcoin you want analyzed, first hit the like button and then comment its name so I can review it for you.
This is not a trade setup, as it has no precise stop-loss, stop, or target. I do not publish my trade setups here.

BTCUSDT PLAN B ROCKED
As we discussed earlier Plan-B worked hope it helped you guys, now lets wait for retracement then will update the move as Price Action

ASTER Rejected at Resistance — Support Retest LikelyASTER has just faced a rejection at a key resistance level, signaling a potential move back down toward support. This pullback could offer a solid opportunity for bulls to re-enter if price stabilizes. The current structure remains valid as long as price doesn’t break below the invalidation zone.
🔔 Trade Setup
Entry Zone: $0.56 – $0.57
Take Profit Targets:
• TP1: $0.64
• TP2: $0.70
• TP3: $0.80
Stop Loss: $0.48
Risk management is key. Wait for confirmation.

Bitcoin Faces Key Test as Macro Pressures Influence Price ActionRecent Market Forces Shaping Bitcoin’s Direction
Bitcoin sentiment has shifted noticeably since late 2025 as optimism about greater institutional adoption met a more challenging macroeconomic environment. The most important headline for Bitcoin has been the change in expectations around global liquidity. Since November 2025, markets have repriced the path of rate cuts as US inflation data re-accelerated and labor markets remained resilient. This pushed bond yields higher and strengthened the US dollar, creating a headwind for Bitcoin and other risk assets.
Another specific driver has been ETF related flows. Spot Bitcoin ETF inflows slowed materially through November and December after a strong first half of the year. Several weeks of flat to negative net flows reduced the marginal bid that had supported higher prices earlier in 2025. At the same time, miners increased hedging activity into year end, adding incremental supply during a period of weaker demand.
Across the broader crypto complex, performance has been mixed to weak. Large cap altcoins have underperformed Bitcoin, while smaller tokens saw sharper drawdowns as liquidity thinned. This has reinforced a defensive tone within crypto, with capital rotating back toward Bitcoin dominance rather than expanding risk. Overall sentiment can best be described as cautious and reactive rather than outright bearish, with participants focused on where longer term value may re-emerge.
What the market has done
• Since the end of October 2025, buyers lost control of 110000, which aligned with the 2025 developing VPOC. Sellers were then able to take control and offer prices back down toward the 87700 to 83100 area, which corresponds with the 2024 VAH and a key yearly level.
• From November 2025 through January 2026, the market balanced between 98600 and 83100 as buyers and sellers fought for control. This period reflected uncertainty around macro policy direction, slower ETF inflows, and reduced risk appetite across global markets.
• In the past week, buyers failed to defend the 83100 area. Price auctioned aggressively through the 2024 value area and reached the 60200 area, which marks the 2024 VAL. Buyers have responded at this level, suggesting responsive demand at longer term value.
• The broader decline since November 2025 has occurred alongside tighter financial conditions, a firmer US dollar, and fading expectations for near term monetary easing, all of which historically pressure Bitcoin valuations.
What to expect in the coming weeks
Key levels to watch are 82000, which aligns with a yearly level and offer block 2 low, and 60200, which represents the 2024 VAL.
Neutral scenario
• Expect the market to consolidate and auction two way between 82000 and 60200 as value is rebuilt.
• This scenario would likely align with stable macro data, no major policy surprises from central banks, and muted ETF flows that neither add nor remove significant demand.
Bullish scenario
• If buyers are able to step up bids within the current range, it may be an early signal that the bullish scenario is developing.
• A break and acceptance above 82000 would open the door for a move back through offer block 2 toward the 100000 area, which aligns with the 2025 LVN, where sellers are expected to respond.
• A bullish outcome would likely require renewed ETF inflows, easing financial conditions, or a clear shift toward more accommodative monetary policy.
Bearish scenario
• If sellers begin to step down offers within the range and compress price toward the 60000 area, it would hint that the bearish scenario is in play.
• A break and acceptance below 60000 would suggest continuation lower toward the 40000 area, which aligns with the 2023 VAL, where buyers are expected to respond.
• This path would likely coincide with further tightening in financial conditions, stronger dollar trends, or renewed risk off behavior across global markets.
Conclusion
Bitcoin is currently trading at a critical inflection point where longer term value is being tested against a challenging macro backdrop. Technically, the response at the 2024 VAL near 60200 is constructive, but acceptance back above 82000 is needed to shift the balance in favor of buyers. Fundamentally, the next sustained move will depend on liquidity conditions, ETF flows, and how global markets price the path of monetary policy. Until clarity emerges, Bitcoin is likely to remain in an environment where patience and level awareness matter most.
Let me know how you are positioning around these key levels and which scenario you think is most likely to play out.
Disclaimer: This is not financial advice. Analysis is for educational purposes only; trade your own plan and manage risk.
Acronyms:
C - Composite
w - Weekly
m - Monthly
VAH - Value Area High
VAL - Value Area Low
VPOC - Volume Point of Control
LVN - Low Value Node
HVN - High Value Node
LVA - Low Value Area
SP - Single print

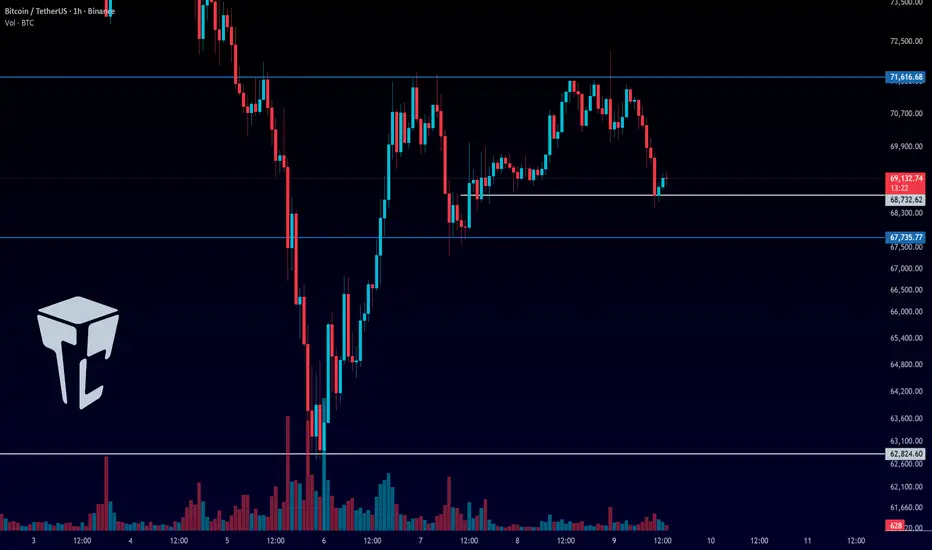
TradeCityPro | Bitcoin Daily Analysis #263👋 Welcome to TradeCity Pro!
Let’s move on to Bitcoin analysis. Today, the market may continue its bearish move.
⌛️ 1-Hour Timeframe
On this timeframe, after getting rejected from the 71,616 high, Bitcoin is moving down toward its support at 67,735.
🔍 At the moment, price has reacted around 68,732, and it could now enter a ranging phase. In that case, we can look to open a short position on a break of 68,732.
📊 Otherwise, we can wait and look for a short entry on the break of 67,735.
✨ For long positions, our trigger remains the break of 71,616. If buying volume starts to increase, we can enter a long position once this level is broken.
⚡️ A break above 71,616 would give us the first bullish signal, and after that, forming higher highs and higher lows above this area would confirm a trend reversal to the upside.
✔️ However, if the short trigger at 67,735 gets activated, price could move toward 62,824. A break below 62,824 would then signal the start of the next bearish leg.
❌ Disclaimer ❌
Trading futures is highly risky and dangerous. If you're not an expert, these triggers may not be suitable for you. You should first learn risk and capital management. You can also use the educational content from this channel.
Finally, these triggers reflect my personal opinions on price action, and the market may move completely against this analysis. So, do your own research before opening any position.
SOL 1W Update: Zoomed out thoughts and viewSolana’s weekly dump is showing signs of exhaustion, with downside momentum clearly decelerating as price presses into a major long-term demand zone around 80–85. The sell-off has been steep and highly directional within a falling channel, which often precedes mean-reversion relief moves rather than immediate continuation. Notably, SOL has already retraced a large portion of its prior impulse leg and is now trading well below former range support at 125.5, suggesting late sellers are entering after most of the damage has been done. While the broader structure remains corrective until higher levels are reclaimed, the risk–reward is beginning to shift in favor of short-term upside relief. A bounce toward 100–110 would be a reasonable first reaction if buyers step in, with a more meaningful trend improvement requiring acceptance back above 125.5. As long as 44 holds as macro support, this move still fits a deep bull-market correction, and current price action favors stabilization and a counter-trend bounce rather than continued freefall.

Give them Nothing, but take from them everything!Good day Traders and investors,
The million dollar question right now...
Is the bottom in ?
The truth... No one really knows.
However, I feel as if is very very close. Closer than most realize.
If you measure from the top of price action, there is no way the bottom would even be close yet. There simply has not been enough time.
If you measure from the bottoms using the RSI. There has 100% been enough time to call it or say it's close.
Approx. 55k should be the bottom , at least from what I am seeing at this point in time.
The truth is anything can happen. The only thing we can do is take historical data, and use it to mitigate risk.
The fear and greed is also lining up with the RSI Both at levels that were the best buy areas of prior market bottoms. Take a look at the time separation from market to market. This is a weekly chart, so those measurements are weeks. The RSI is resetting, while fear is in extreme territory. This has always been a very good time to accumulate. This is not my opinion, its a historical fact.
Never let fear rule you.
Regards,
WeAreSatoshi

BTC NOT CLEARBitcoin looks stuck in a range, trading heavily without clear momentum. It’s consolidating, and the next decisive move will show whether it breaks higher or lower.

Weekly Review of Your TradesA weekly review is not a recap of wins and losses. It is a diagnostic process. The goal is to identify patterns in behavior, execution, and decision-making that are invisible during live trading. Without this review, mistakes repeat quietly and improvements stay accidental.
The review begins with context. Each trade should be grouped by market environment: trending, ranging, or transitioning. Volatility conditions and session timing matter. A losing trade taken during thin liquidity or volatility expansion carries a different lesson than one taken during a clean trend. Results mean very little without environment classification.
Next comes execution sequencing. Review whether trades followed the intended order of events. Liquidity interaction, structural shift, displacement, and retest should be evaluated in that sequence. When trades fail, the question is not whether the idea was wrong, but which step was skipped or rushed. Most performance leaks come from entering before permission is established.
Risk behavior deserves its own section. Compare planned risk to actual exposure. Check whether position size increased after wins or clustered during the same session. Identify correlation between trades that relied on the same narrative. Many drawdowns are not caused by bad ideas but by stacking exposure when conditions deteriorate.
Entry and exit behavior often reveals more than setups. Early exits during valid moves point to discomfort with unrealized profit. Late exits on losers point to avoidance of taking losses. These patterns repeat until they are measured. The chart alone rarely explains them.
Quantify execution quality separately from outcome. Track how many trades met all setup criteria, how many were partial alignments, and how many were impulse decisions. A profitable week with poor execution is a warning sign. An unprofitable week with disciplined execution is often progress.
The final step is adjustment. One or two focused changes are enough. Narrow session windows, reduce exposure during specific environments, or tighten rules around confirmation. A weekly review should simplify trading, not complicate it.
Consistency is built between trades, not during them. The weekly review is where structure replaces emotion and where improvement becomes intentional rather than accidental.

BTC — Range Deviation Play & Bear Flag TargetBitcoin continues to trade inside a clearly defined sideways range. Recently, the price made a deviation above the range high — a classic false breakout — and quickly returned back inside the channel, confirming the upper boundary as strong resistance.
Now, on the daily timeframe , the market is forming a bear flag , which typically acts as a continuation pattern to the downside. If this structure breaks lower, it opens the way toward the $68–67K zone , which aligns perfectly with the lower boundary of the range.
A move into this area would likely create a deviation below the range low, mirroring the earlier deviation at the top. Such symmetrical deviations often signal liquidity grabs before a potential mid-term reversal.
Key Points:
Range structure remains intact
Upper deviation confirmed — failed breakout
Daily bear flag suggests continuation lower
Target: $68–67K (potential lower deviation zone)
This scenario remains valid as long as BTC stays below the mid-range and the bear flag structure holds.

Bitcoin Cycle Fractal: Consolidation Before Bear Market 2026History Repeats: 2020–2022 vs 2024–2026
In 2020 , before the strong bull run of 2020–2021, Bitcoin formed a clear bull flag consolidation on the higher timeframe.
After the bull market top in 2021 , price entered a distribution phase , forming a bearish structure, which eventually led to the bear market of 2022.
The current market structure looks very similar.
During 2024–2025, Bitcoin is again consolidating after a strong impulse, forming a rising structure that resembles previous pre-bear-market consolidations.
If this fractal continues to play out, I expect:
Continuation of consolidation in 2025
Transition into a bear market in 2026
My near-term downside target is the 60–65k USD range, which aligns with previous support and structural levels.

S-Tier or E-Tier? — Rating your SetupNot all trades deserve the same risk. Treating every setup as equal is one of the fastest ways to flatten performance. Rating your setup forces you to separate opportunity from activity and adjust exposure based on quality.
A setup is not rated by how clean it looks. It is rated by how many conditions align before execution. The first condition is environment. Volatility, session, and market phase determine whether continuation is likely or whether noise dominates. A technically valid setup taken during thin liquidity or transition phases deserves a lower rating than the same setup during active participation.
The second condition is location. Entries taken near higher timeframe levels, inside discount or premium zones, and close to liquidity objectives carry more weight than entries taken mid-range. Good location reduces invalidation distance and improves risk efficiency. Poor location forces wider stops and relies on hope rather than structure.
Sequence is the third factor. High-quality setups follow a clear order of events: liquidity taken, structure shifts, displacement appears, and a retest confirms acceptance. When a trade skips steps, its rating drops. A setup entered on the first touch of a level without confirmation may work occasionally, but it should never be rated highly.
Momentum and follow-through add another layer. Clean impulse away from the entry zone signals participation. Weak or overlapping candles signal uncertainty. A setup with strong follow-through deserves more confidence than one that relies on slow grinding movement.
Risk clarity is the final filter. A setup is stronger when invalidation is obvious and contained. If the stop is based on a vague percentage or an emotional tolerance rather than a structural point, the setup quality is lower regardless of how attractive the potential reward looks.
Rating your setup is not about finding perfect trades. It is about matching risk to conditions.
High-rated setups justify full risk. Mid-rated setups justify reduced size. Low-rated setups are often best ignored. Over time, this process reduces drawdowns, limits emotional decision-making, and shifts focus from frequency to quality. Consistency improves when risk follows logic instead of excitement.

IREN Still lower to complete wave 4NASDAQ:IREN printed another daily bearish divergence in a downtrend, signalling continued momentum to the downside. Price met the 200EMA and caught a bid Friday closing its candle only +5%, a far cry from the competitors last week, considering its volatility, showing weakness.
The narrative and buzz of the bull run is still being sold into as investors are still greedy.
Wave C of 4 has a termina target f the major High Volume Node support and 0.382 Fibonacci retracement, the highest probability area for wave 4 to end, $27.
Daily RSI has room to fall. The daily pivot is lost.
Safe trading

Bitcoin - good healfy Up trend - need long accumulationBitcoin - good healfy Up trend - need long accumulation
in this video i shared my local idea fro next weeks and algo global view

BITCOIN always leads stocks when Bear Cycles happen. This time??Bitcoin (BTCUSD) completed a more than -50% drop last week from its October 2025 All Time High (ATH) while stocks stayed close to their ATH. This chart shows that while BTC is obviously on a Bear Cycle, the S&P500 (SPX) illustrated by the blue trend-line, is still on Bull Cycle territory.
So why this huge divergence between BTC and stocks. Well looking at it historically, this is not uncommon. During the 2022 Bear Cycle, Bitcoin had to crash by more than -40% before the stock market started its own correction, while in 2018 Bitcoin again crashed by more than -50% before the SPX started a Bear Cycle.
This is very logical from a long-term investing standpoint as investors seek first to liquidate the massive profits on riskier assets like Bitcoin, add some remaining capital on stocks and then when the stock market shows signs of a long-term correction, withdraw their funds from there as well. This is usually when the USD takes off as they convert stocks to dollars and choose to weather out the storm primarily in cash (others might choose precious metals).
In any event, this analysis shows that since Bitcoin is already down by more than -50% from its historic High, we might be seeing a Bear Cycle starting on the S&P500 as well.
Do you agree with that? Feel free to let us know in the comments section below!
---
** Please LIKE 👍, FOLLOW ✅, SHARE 🙌 and COMMENT ✍ if you enjoy this idea! Also share your ideas and charts in the comments section below! This is best way to keep it relevant, support us, keep the content here free and allow the idea to reach as many people as possible. **
---
💸💸💸💸💸💸
👇 👇 👇 👇 👇 👇

CIFR Triangle path played out nicely..NASDAQ:CIFR triangle in wave B played out, following my path closely, touching the daily 200EMA and major High Volume Node support line, at the 0.236 Fibonacci retracement. This is a highly probable place for wave 4 to end.
Triangle are a penultimate pattern, so that thrust lower last week should mark the end of the downtrend.
There is no divergence in the daily RSi and has a little room left to hit oversold but can do so on a bullish divergence without a new low.
Price closed Fridays candle at the highs +16% showing consumer confidence to hold over the weekend news cycle.
Safe trading

COIN, Elliot wave degree changed, Wave 2 complete?NASDAQ:COIN has a larger sell off then expected completely falling out of its rising wedge. This suggests that the top was a wave 1, completing 5 wave ups diminishing with wave V, with a poke above all time high, IPO launch.
The Elliot wave count is textbook. Wave C of 2 looks to have complete 5 waves down, just below the weekly 200EMA at the major High Volume Node support, 0.382 Fibonacci retracement. While the trend remains down and below the weekly pivot I think Friday was a capitulation event and we move up from here. Theres always a sweep of the lows possible first.
Friday closed at the daily candle high, showing investor confidence to hold over the weekend news and BTC price cycle.
Weekly RSI is tapping oversold, with slight hidden bullish divergence.
Safe trading

SHIB: breakout or dead cat bounce? key levels to watchSHIB. Still waiting for this dog to wake up or is it just pretending to be alive? Meme coins have cooled off again according to market chatter, with flows rotating back into majors while SHIB burns keep growing but price refuses to follow. That combo usually means only speculators are left in the game, not real trend buyers.
On the 4H chart price is stuck in a tight range around local support near 0.0000060 after a brutal downtrend, with a staircase of red supply zones right above. RSI is climbing from oversold but still under 50, so it looks more like a relief bounce than a reversal. Volume profile shows the real liquidity sitting slightly higher, so I expect a push up into the 0.0000066–0.0000070 zone first, then sellers to hit it again.
My base plan ✅ wait for price to spike into that supply, watch for rejection wicks and fading RSI, then look for shorts back to 0.0000055–0.0000050. If buyers suddenly punch through and we start closing 4H candles above 0.0000072 with decent volume, I’ll flip to a long idea toward the next red zone higher. I might be wrong, but for me SHIB still looks more like a dead cat bounce setup than the start of a new meme season.
