BTCUSDT 30M Analysis: Reverse Zone Re-Test Before Major Drop 📊 BTCUSDT 30-Minute Technical Analysis – Reversal Zone Under Pressure
This 30-minute BTCUSDT chart highlights an important bearish setup forming after a sharp downside move. Bitcoin is currently consolidating near a Reversal Zone, suggesting that price may attempt a retest before continuing lower.
🔻 Market Structure Overview
Bitcoin recently experienced:
A strong impulsive sell-off
A brief consolidation phase
A minor recovery back into a previous support now acting as resistance
This structure indicates that sellers are still in control.
🟥 Reversal Zone (Major Resistance Area)
The highlighted red zone is the primary bearish reaction area.
Why this zone matters:
Price broke below this level with strong momentum
It is now acting as a potential supply zone
A bearish candlestick pattern in this area would confirm sellers stepping in
Your chart clearly notes: “Bearish Pattern Need On That Zone.”
A rejection here is the most important bearish confirmation.
🟦 Mini Reversal Zone (Previous Demand Area)
Below current price sits a smaller demand zone.
This zone previously showed:
Buyer reactions
Short-term reversals
Support in the recent downtrend
If price breaks below this mini zone, BTCUSDT may aim for deeper liquidity levels, confirming bearish continuation.
📉 Expected Price Behavior
Based on the projected path drawn on your chart:
Price will retest the Reversal Zone
A bearish engulfing, pin bar, or rejection wick may form
Price may drop aggressively after confirmation
Final target is a deeper zone around the previous swing lows
The downward arrow illustrates the expected continuation if bulls fail to defend nearby support.
⭐ Key Takeaways
Bitcoin remains in a bearish structure on the 30M timeframe
A strong bearish pattern in the Reversal Zone is required for confirmation
Rejection from this resistance may trigger another downside wave
Break and hold above the zone would invalidate the short-term bearish outlook
🧠 Short Summary for Minds
Bitcoin is approaching a key Reversal Zone on the 30-minute chart. If a bearish pattern forms here, BTCUSDT may continue dropping toward lower support levels. Sellers remain strong unless bulls break above the resistance zone.
Bitcoinanalysis

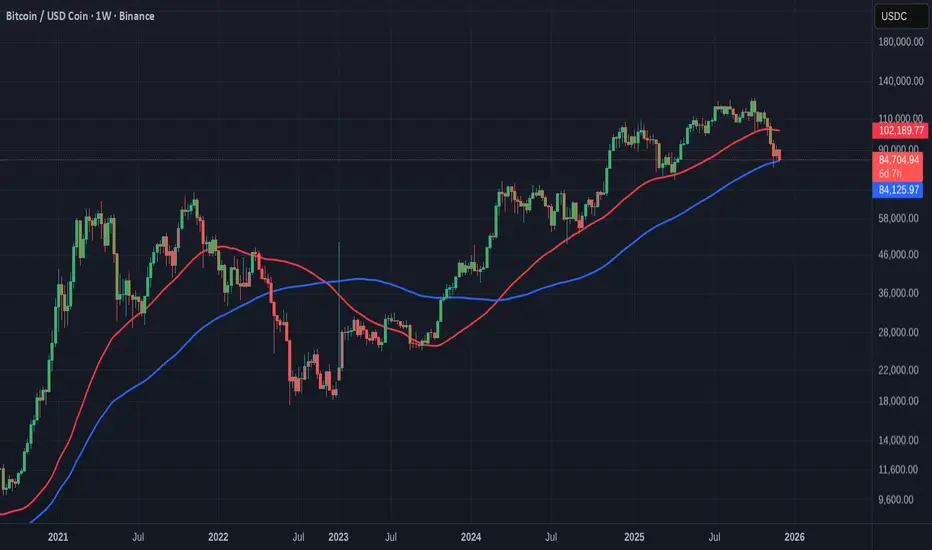
Really Simple Clue to "Is Bitcoin in a BEAR or BULL"
It is as simple as this.
If PA falls below that BLUE 100 WEEK SMA, Bitcoin is in a BEAR
While we remain above it, we have Hope of returning back to a BULL RUN
The RED line is the 50 Week SMA, which was the first warning Shot.......
We will find out this month I hope.........................
Bitcoin Daily Heiken Ashi does not lead to short term confidenceBitcoin Daily Chart showing VRVP on the right. The lines mentioned below can offer Resistance, Support.
Horizontal Dashed Yellow - Value Area High VAH currently around 128K usdt
Horizontal Dashed Red - Value area Low VAL currently around 95K usdt
Horizontal Dotted Red line - POC, Point of control currently around 110k usdt
Horizontal Dashed Blue line - Current ATH
The Red diagonal "line " is part of a 236 Fib circle that often provides strong resistance and, on this occasion, has rejected Pa ever since the current ATH.
PA is getting Squeezed between this and that 2.414 Fib Extension, forming a pennant with an apex around 4 Dec.
PA ALWAYS REACTS BEFORE THE APEX so I do expect a sharper move from PA by the end of the 3rd Dec.
The possibility does exist that the Bulls will make a stand and PA, rarely, may just range through this but that would then, at least , take us to the other side of that Fib circle and Offer hope that we Remain above that circle.
But, For me, I am sideing with a Drop lower, maybe to that next Fib Extension at around 78500.
This will scare some people and knowing the direction after that is hard to tell.
As yet, I have not seen many signs of short term recovery But..........
The Daily MACD is VERY OverSold and has the room to recover.
But shorter Term, the 4 hour MACD is still falling BEARISH and has room to drop further
.
So, as mentioned in a number of posts, This month is the KEY to telling where we are...Bull or BEAR.
But I think dynamics have changed and the time ay have arrived were we look at Bitcoin PA in a different Way
We Wait.......
This is Bitcoin

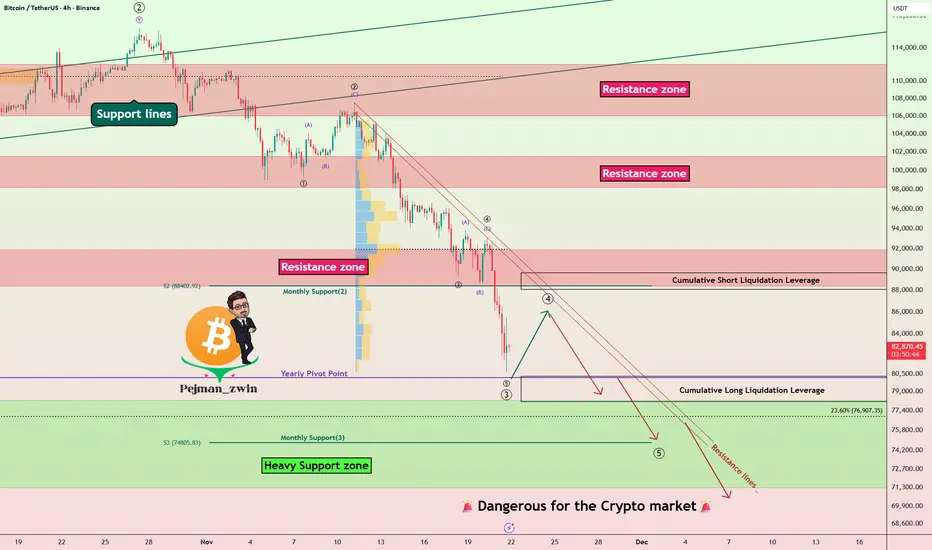
Bitcoin: Final Pump Before the Fall?Over the past five to six days, Bitcoin ( BINANCE:BTCUSDT ) has been attempting to recover from previous weekly declines, and it still appears to be in a corrective phase. This analysis builds on my previous idea, and if you’d like a deeper look at Bitcoin’s mid-term chart, you can check out the 4-hour timeframe in that previous analysis .
Now, a key point for Bitcoin traders is that, despite the recent rally in the S&P 500 ( SP:SPX ) over the past few days, Bitcoin hasn’t been able to keep pace. While it had a good correlation with the S&P 500 in the past, it didn’t experience a similar upward movement this time. Therefore, once the S&P 500 corrects, we may also see Bitcoin resume its downward trend.
Currently, Bitcoin seems to be near a resistance zone($92,200-$88,400) and Cumulative Short Liquidation Leverage($91,570-$89,660). It also appears to be forming an ascending channel over the past few days, indicating a corrective structure.
From an Elliott Wave perspective, Bitcoin seems to be completing microwave C of the microwave Y of the main wave 4, and we can expect this corrective phase to end soon, leading to another downward move. A break of the lower line of the ascending channel would confirm the end of this Wave 4.
I expect that after the Cumulative Short Liquidation Leverage($91,570-$89,660), Bitcoin will resume its decline and move towards the Support zone($86,200-$85,130).
Cumulative Long Liquidation Leverage: $86,000-$85,000
Cumulative Long Liquidation Leverage: $83,249-$81,840
Cumulative Long Liquidation Leverage: $80,263-$78,131
First Target: $86,290
Second Target: $83,800
Stop Loss(SL): $92,229
Points may shift as the market evolves
Note: At lower price levels, Bitcoin’s price includes several Cumulative Short Liquidation Leverages, each potentially causing further price drops. However, if the S&P 500 starts another correction, these levels may break more easily.
Note: Overall, trading in crypto has become a bit challenging lately, with less volatility, so it’s wise to be cautious and manage your capital carefully.
Note: If Bitcoin breaks through the resistance zone($92,200-$88,400) around $92,229, we can expect a renewed upward trend and hope for a bullish movement.
💡 Please respect each other's opinions and express agreement or disagreement politely.
📌Bitcoin Analysis (BTCUSDT), 1-hour time frame.
🛑 Always set a Stop Loss(SL) for every position you open.
✅ This is just my idea; I’d love to see your thoughts too!
🔥 If you find it helpful, please BOOST this post and share it with your friends.

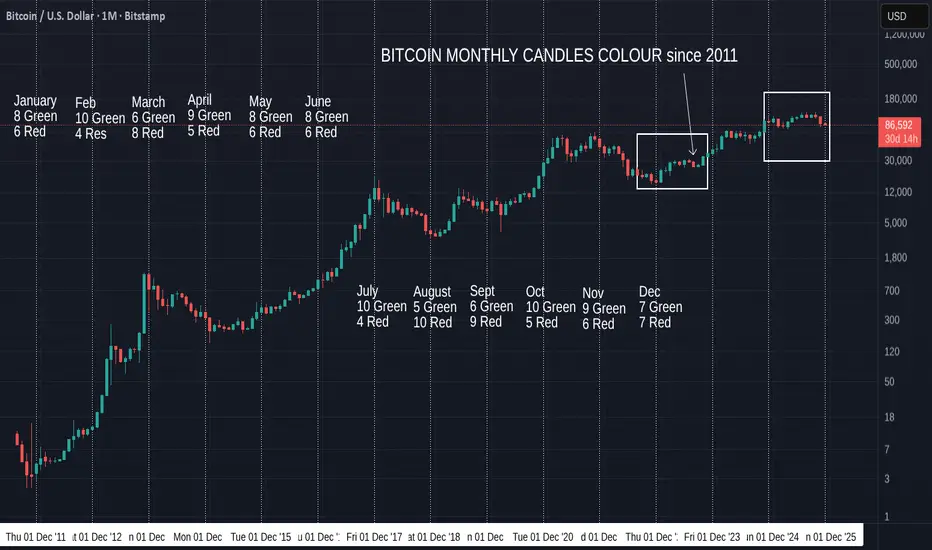
Bitcoin Monthly Candle Close Color since 2011 and patternsNovember closed RED as expected and so we have continued to follow Sequence in the left Box, mentioned in the October post.
The left Box shows the only similar monthly Candle sequence, similar to the one we currently have. If you look closely, it is also a very similar "Curve" shape. Descent to low, rise, flatten out.
The Candle Sequence to see is Red, Green. 2 Red. 4 Green, 1 red, 1 Greeno 1
red
That Sequence was followed by a larger Red Candle, which we have just also done.
The Thin down facing arrow in the left Box, points to the equvilant candle to the one we just closed, thought the month was August and not a November.
The left box starting in September 2022 and the Right Box starts in December 2024.
These Sequences run for 11 Months so Far..
This is the only 2 occasions this sequence has ever happened in Bitcoin history...and they are Both in the same "Bull Run"
And I will just mention that the Left Box was the recovery period after the 2022 Bear market.
A Very positive period.
If we continue this Sequence, we should see a Green Candle in December, though maybe not a large one. Some charts point to a Red start to December, so remain cautious.
We should also remember that a pattern workss untill it Stops...but the longer it runs, the higher the chance of that point being reached.
Just to Recap from the October post of this Series.....
"The Red November in 2011 was the bottom and was the start of Bitcoins 2 year push to ATH.
The Red one in November 2022 marked the Bottom of the Bear, though December was red but a small candle.
Nearly half of the Red Novembers called the Bottom of a Bear, a turning point in market behaviour." (There had been only 5 Red Novembers at the time of writing)
What is also very interesting is how the November 2022 Red candle was approx -27% draw down. (Wicks included) -> the following December in 2022 closed a small Red candle.
The Red November we just closed was also approx -27%
However, To follow the Color sequence, we will expect a Green December.
Of the Previous Red NOVEMBER closes, we have only ever had ONE Green December, way back in 2011,
The Odds do point to a Red December close....but hopefully a small one.
If this happens, the color sequence gets broken but I will look at what happened in early 2023 as a possible follow on. The November, December, January candles for sure....
Looking Forward. Previous December closes.
7 Green to 7 Red - A 50 - 50 mix.
Of the previous 7 Red December Closes, 4 were followed by a Green January, the last one being in December 2022 and was followed by a Lovely Green January, marking the start of the current push higher by Bitcoin from 15K usdt low to over 120K usdt.
That January Candle was over 50% rise.
Only one Red December led us into a Deep Bear market, the others signalled change.....
So, While the odds, technically, point to a Red December close, to follow previous moves and sentiments, this may not be a bad thing.
A Red December would break the sequence we have been talking about, as the next in sequence is a GREEN candle. And so were the next 6 Months.
So, December Close will answer Many questions and is, once again, a pivotal month. The Sentiment for the entire year to follow will be set by this months Candle Close..
We currently have a number of pointers suggesting this is an End to a "Bear"....and this Draw back right now has seen PA fall below a number of Key support levels but interestingly, we have got no where near the "traditional " - 80% Bear draw down.
Very confused signals, hinting at moves in either direction.
We have to wait......as ever.... But I am VERY BULLISH
As it stands, a Red or a Green December has the potential to be Good, providing that, obviously, a BEAR market is not confirmed.
My preference is fr a small Red candle this month........
NOV.30,2025 BITCOIN (BTC) PRICE CHART ANALYSISBitcoin on the monthly and Weekly charts has officially confirmed a bearish cycle. The daily chart is consolidating around the 21 EMA resistance moving average. I think the sideways price action will continue for a while as the weekly candle we have formed is an inside bar candle suggesting a pause.
What I am carefully watching is these fib level on the daily chart ( 90,793, 94,219, 98,573). A break above 98k zone could put the $103k & $109k level on the table. Since we have daily cycle high, I think price will continue sideways with the 21EMA holding resistance, this level is also the 0.382 fib of the last impulse selling, before a continuation to the downside.
The weekly chart has hit stochastic cycle low and RSI could also keep up into the 35 level before the next strong selling, so patience here is important. Both the weekly and monthly still confirms the bottom is not here yet and more falling is very likely at this point. With the monthly MACD officially crossing down since July 2023 when this rally began. If these indicators proves right, BTC will continue to fall for the next few months.
These are my thoughts and observation on Bitcoin price action. Practice some risk management and money management as the market maker will seek to do a liquidation event before the downtrend continuation.
Thank you as always for reading my publications and kindly support my work with a boost and share what you think in the comments section. Let's be a community that conquers the market together. Cheers!!!

BTC Sell/Short Setup (4H)Based on the previous wave counts, it seems that wave D will complete in the red zone.
We have prepared a setup that you can use to enter a position with 10X to 14X leverage.
The targets, stop-loss levels, and entry point are marked on the chart.
For risk management, please don't forget stop loss and capital management
When we reach the first target, save some profit and then change the stop to entry
Comment if you have any questions
Thank You

BTCUSD: A fragile rebound, with risk of returning to the 84,000 After a fairly “tiring” week , Bitcoin has ticked up slightly at the start of the week, but the overall picture still leans clearly toward the bears . Outflows from U.S. spot Bitcoin ETFs have now extended into the fourth consecutive week , showing that institutional money is still cutting exposure. At the same time, the market is both hoping for a Fed rate cut in December (around 70% probability) and worrying because many Fed officials remain cautious. With no new bullish catalyst , the crypto market in general – and BTC in particular – remains under short-term downside pressure.
On the D1 timeframe, BTCUSD is holding a clear downtrend below the Ichimoku cloud . A descending trendline drawn from the previous highs continues to cap every rebound. Price is currently trading around 87,000 USD, after dropping to a recent low near 83,500 USD and then bouncing slightly. The scenario illustrated on the chart suggests BTC may range and consolidate before pushing up to retest the 96,700 USD area – a key confluence resistance where the descending trendline meets a horizontal supply zone.
If BTC reaches the 96,700 USD region but faces strong selling, the primary scenario is a new leg down back toward the 84,000 USD support zone. With ETF flows still negative and the Fed’s outlook still uncertain, every bounce into higher resistance levels currently looks more like a distribution opportunity than the start of a sustainable uptrend .

NOV.23,2025 ANALYSIS- DXY, BTC, NAS100, SPX500, XAUUSD & XAGUSDDXY CAUTION: at weekly resistance but Uptrend with a huge bullish candle suggests continuation to the upside. I expect some sideway price action potential pullback to 99.365 level and then continuation to the upside target of 100.608. A break below 99.365 will invalidate upside targets.
BITCOIN: STILL BEARISH, All my initial bearish targets from previous analysis got smashed. BTC is now in a new bearish territory only finding support at the fib extension 1.618 from the $126,296 high. RSI is very oversold and potentially there could be a sideways price action around this level re-testing $80,524 this week. Ultimately the next bearish target is between $70k and $78k.
NAS100 & SPX500 BEARISH: Both indices closed with a strong bearish candle but found support around their 21EMA on the weekly chart. I observed some unconfirmed hidden divergence plus daily stochastics cycle lows so I expect some sideways consolidation and next leg down to targets of about $23,169 for Nas100 and $6,418 for SPX500.
GOLD & SILVER SIDEWAYS: Gold on the weekly chart showed only a doji candle consolidating price action but lower high of($4,194) confirmed on the chart. I envisage that this consolidation will continue into next week and finally breakdown to the $3,826 target. Silver has maintained the double tops on the weekly and daily charts. The lower high of $52.98 also suggest more downside price action with the initial target of $45 - $47 zone.
I hope my publications are helpful to your own analysis and perspective. Thank you and please show your support for these analysis with a boost or comment so it's shown to other traders. Have a great and profitable trading week and remember risk management is your first job as a trader. Cheers!!

Bitcoin is approaching an important support level (1D)Bitcoin has entered a strong bearish structure.
It is currently near an important origin zone that has broken significant highs (BOS). It is expected to make an upward reversal from this area.
It’s natural for this momentum to require some base-building, and since the movement is on the daily timeframe, the upward reversal may take some time.
The target range is 95K to 96K.
A daily candle closing below the invalidation level will invalidate this analysis
Do not enter the position without capital management and stop setting
Comment if you have any questions
thank you

TODAY is the day Bitcoin Needs to React and has the strength to HEIKEN ASHI candles on the charts, take out the noise of change and show Trends better.
Bitcoin Daily Chart showing VRVP on the right. The lines mentioned below can offer Resistance, Support.
Horizontal Dashed Yellow - Value Area High VAH currently around 128K usdt
Horizontal Dashed Red - Value area Low VAL currently around 95K usdt
Horizontal Dotted Red line - POC, Point of control currently around 110k usdt
Horizontal Dashed Blue line - Current ATH
Notice the "Pocket" on the right, in the VRVP, just above the VAL. This is a price range that has little Trading volume and tends to attract PA. We are also currently in a little one and PA has risen in it.
The one just above us now, after the VAL line Could Take PA up to the POC around 110k
Likely to meet strong resistance there but PA is Very oversold right now..PA has the ability to push a lot higher
But it is TODAY that we really need to pay attention to.
See the Diagonal lines dropping down from left to right.
These Are FIB CIRCLES> and that Red one is a 236. Those that follow me will understand that I have always said to be careful of them.
And it is THAT that has been dropping PA since ATH.
And TODAY, we need to break through it or face a Stiff push lower.
I think we will break through but that VAL line could be a problem. Nervous day BUT with confidence.
DAILY MACD
MACD has crossed Bullish. WE do need to keep this going to renew sentiment but, as you can see, There is a long way to go before PA become OverBought..THIS alone could take PA back up to the 120k + zone..But there is a LOT of resistance en-route.
But this is a good sign
DAILY RSI
VERY Strong push up from OverSold on the RSI and, again, this shows some very good possibilities ahead as we come to month end.
So, Bitcoin PA has the ability to push high.
The 4 hour Bitcoin chart shows the shorter term
So, here it is...PA pushing up against that 236 Fib Circle, right where the VRVP has a line of resistance.
THIS is why today is so important. WE NEED TO BREAK THROUGH
On this 4 hour chart, you can see how PA is above the POC..that is support if we get rejected off the 236 fib circle.
The VAL is just below that and we bounced off that once before already
So, TODAY, watch this carefully....
In th elonger term, I do not expect BTC PA to Roar up just yet. Thge November candle will close RED, December will be Green as confidence returns and I am thinking that January will be EPIC.
But..we need to break this resistance today...
Hang on You Lot

Bitcoin Weekly - PA on Cycle Base Support line and bouncing.
We are now in the last week of November and we may have hit the Low / Bottom and produced that Red candle that was suggested at month start.
PA Could Wick down in a Flash crash to Kill Longs that are mounting, before a sustained push higher in December, so remain Cautious.
This is just My opinion..It could obviously Go either way but we can see PA sitting on that Blue line, that is LONG Term support from way back in 2013
PA Fell though that line Once only, in late 2015 and recovered
The Weekly MACD
The weekly MACD is still dropping but is now approaching oversold. This has begun to open the door to it turning up. It will not drop forever
We need to watch the Histogram and wait for that to change colour, showing us that the MACD (Yellow) is getting closer to the signal line ( Red ),
The Weekly RSI
While the RSI is below Neutral, it is NOT fully over Sold yet but is a lot lower than previously.
AND we can see that it has turned Flat, stopped dropping.
This last week of November, PA could see a slight rise and so the RSI is the first thing we see moving higher.
So, For now, I think we have seen the worse of the Blood letting and now, we level out, maybe rise some, with the potential for a Flash crash to take out leverage.
I am fully waiting for December to start now.....
We are nearly out of the Woods.....Hang in there
I am not to sure how much influence the FED and its Rates decision will have over all.
We have seen in the past how BTC PA will often move independent of Rate Rises / Drops.
The chart above shows BTC PA and the Rate changes....
There ar elots of influences but , well, I am not to sure Bitcoin is finished just yet.
December and January will tell us for sure.

BItcoin Short Term Analysis (4H)As we had already identified Bitcoin’s support zone in previous analyses, this area is still valid.
To assess Bitcoin in the lower timeframes, there are two possible scenarios:
One is that it starts moving upward from the current prices, and the other is that it revisits the green zone once more, forms a double bottom, and then moves toward the red target.
A daily candle closing below the invalidation level will negate this analysis.
For risk management, please don't forget stop loss and capital management
When we reach the first target, save some profit and then change the stop to entry
Comment if you have any questions
Thank You

Short-term analysis of Bitcoin (12H)After the heavy drops | which we had already identified in previous analyses () | Bitcoin is now approaching a strong supportive order block.
From the point where we marked the red arrow, Bitcoin entered a bearish phase, and it is expected that wave C of this phase will complete around the green zone.
We will see whether the price reaches the green area or not.
The initial target for this bounce can be the 95K to 96K range.
For any reason, the closing of a daily candle below the invalidation level will break the structure and invalidate this upward correction
For risk management, please don't forget stop loss and capital management
When we reach the first target, save some profit and then change the stop to entry
Comment if you have any questions
Thank You

BTCUSD Liquidity Sweep Setup Before Bearish ContinuationBTCUSD Liquidity Sweep Setup Before Bearish Continuation
Overview
BTCUSD continues to display persistent downside pressure across the mid-term structure. Price action on the 3H timeframe shows a sequence of lower highs and lower lows, reflecting sustained bearish control. Despite short periods of stabilization, the overall market environment remains distribution-driven.
Market Structure
Recent price behavior confirms multiple break-of-structure (BOS) events, each reinforcing the broader downward momentum. Every attempt at upward expansion has been met with supply absorption, indicating that buyers are failing to regain initiative. The consolidation developing in the current region suggests an accumulation of short-term liquidity, but without structural evidence of reversal.
Supply & Liquidity Context
Price is positioned directly beneath a key supply zone highlighted on the chart. This zone remains unmitigated and acts as the primary area where counter-trend reactions are likely to be absorbed. The tightening range beneath this level indicates liquidity buildup, commonly preceding engineered sweeps by institutional players.
The current model suggests that the market may execute a short-term liquidity run above local highs before resuming its downward trajectory. Such a move would align with previous behavior in this trend cycle, where short-term rallies were primarily used to deliver liquidity into higher-timeframe supply.
Downside Expansion Risk
Should the market complete a liquidity sweep into the supply zone, the next phase of downside continuation becomes probable. The structural projection on the chart anticipates a revisiting of the lower demand region around 74,300 – 75,000, an area aligning with previous inefficiencies and untested demand.
This target supports the continuation of the broader bearish structure unless a significant shift in order flow emerges.
Summary
BTCUSD remains positioned within a well-defined bearish cycle, characterized by repeated structure breaks and unmitigated supply zones controlling price. Current compression suggests the market is preparing for another liquidity-driven move. Unless buyers regain structure above the key supply region, the market retains a high probability of extending toward lower demand zones.

Bitcoin Hits Heavy Support Zone — Is the Next Big Crash Coming?Recently, Bitcoin ( BINANCE:BTCUSDT ) experienced another decline of over -10%, largely due to the sudden drop in the S&P 500( SP:SPX ). As I mentioned in previous ideas, in recent weeks, Bitcoin and the crypto market, especially Bitcoin, have shown a strong correlation with U.S. indices, particularly the S&P 500. This means that even technically sound analyses for Bitcoin can fail if we don’t consider these external factors, which is quite normal. Therefore, it’s crucial to incorporate all parameters—news, fundamentals, on-chain data, and relevant indices—to get an accurate Bitcoin analysis. This complexity can make things a bit challenging.
Over the past ten days, Bitcoin has swiftly broken through several support levels. Many factors have contributed to Bitcoin’s decline recently, but it’s now approaching a heavy support zone($78,300-$71,280). This zone is crucial because if Bitcoin loses it, we could see even larger declines, affecting altcoins as well. Altcoins, in general, haven’t matched Bitcoin’s gains in recent months, so a significant drop in Bitcoin could lead to severe losses for them. It’s essential to manage your investments carefully and stay alert.
From an Elliott Wave perspective, the recent decline suggests that Bitcoin might be in the midst of a five-wave downward, which isn’t positive news. There’s a chance that the heavy support zone($78,300-$71,280) might be breached. However, considering that weekends typically have lower trading volumes, it’s less likely that the support will break in the next couple of days. Still, we must remain vigilant and prepared for any scenario.
In terms of Elliott Waves, it seems Bitcoin has completed its main wave 3, and we might be looking at the completion of the wave 4 over the weekend, with another push towards the heavy support zone($78,300-$71,280) at the start of next week.
Also, the USDT.D% ( CRYPTOCAP:USDT.D ) chart looks bullish, which could not be good news for Bitcoin.
I expect that after a brief rebound, Bitcoin will resume its decline and test the heavy support zone($78,300-$71,280) again.
Cumulative Short Liquidation Leverage: $89,642-$88,079
Cumulative Long Liquidation Leverage: $80,263-$78,131
First Target: $78,523
Second Target: $75,123
Stop Loss(SL): $92,123(Worst)
Points may shift as the market evolves
Note: The S&P 500 also might face downward pressure in the coming days, which could further impact Bitcoin’s support levels. It’s essential to manage your investments carefully and wait for strong reversal signals in higher timeframes. You might miss out on some short-term gains, but it will allow for more confident entries later on.
Note: Tensions between the U.S. and Venezuela are escalating day by day. Should these tensions intensify to the point of direct confrontation, it could act as a trigger for another Bitcoin decline. It’s important to keep this in mind.
Note: Additionally, there have been some suspicious transfers involving the Mt. Gox exchange recently. It’s worth monitoring these developments closely.
💡 Please respect each other's opinions and express agreement or disagreement politely.
📌Bitcoin Analysis (BTCUSDT), 4-hour time frame.
🛑 Always set a Stop Loss(SL) for every position you open.
✅ This is just my idea; I’d love to see your thoughts too!
🔥 If you find it helpful, please BOOST this post and share it with your friends.
Bitcoin Bear Market 2026 | Macro Cycle & Rising Wedge BreakdownBitcoin Macro Cycle Analysis (2013–2029) | Rising Wedge Breakdown • 2026 Bear Market Targets • Historical % Drops & Next Accumulation Zone
Bitcoin historical data strongly follows multi-year macro cycles , where each bull market has been followed by a deep bear market correction:
📉 2nd Cycle (2017–2018)
Top: 19,666 (17 Dec 2017)
Bottom: 3,122 (15 Dec 2018)
Correction: –84.23%
📉 3rd Cycle (2021–2022)
Top: 68,997 (8 Nov 2021)
Bottom: 15,479 (9 Nov 2022)
Correction: –76.64%
📉 4th Cycle (2025–2026 – Ongoing)
Top: 126,272 (6 Oct 2025)
Rising Wedge + Distribution Phase breakdown confirms bearish structure shift
Based on historical cycle behavior and on-chain indicators, Bitcoin has entered the 4th major bear market
📍 Projected Bottom Zone (2026)
Primary Support Zone:
➡️ $40,000 – $42,000 – $45,382
(Aligned with Wedge Breakdown + Macro Support)
Percentage-Based Targets:
–68.16% drop: → ≈ $40,000
–74% historical drop scenario: → ≈ $31,000 (max capitulation zone)
📅 Expected Bottom Window:
September – October 2026
→ Historically the strongest long-term buying opportunity .
📈 5th Cycle Expectations (2026–2029)
Bitcoin has been following a Long-Term Rising Wedge (Bearish Continuation / Reversal Pattern) since 2021.
This pattern is expected to fully complete by April 2029 → leading into a new long-term top and then the 5th bear market .
⭐ Why This Analysis Matters
Combines **cycle history**, **on-chain metrics**, **pattern analysis**, and **macro support zones**
Helps identify high-probability long-term Bitcoin accumulation levels
Useful for swing traders, long-term investors, and cycle-based portfolio strategies
🔔 If You Find This Analysis Helpful
👍 Like • 💬 Comment • ⭐ Save
It motivates me to share more high-quality Bitcoin cycle research!

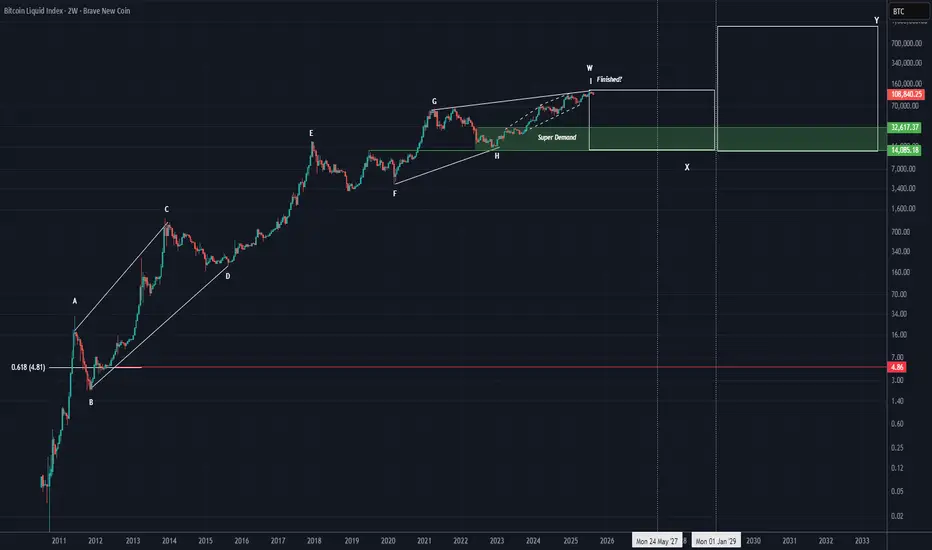
Is it really possible for Bitcoin to reach 1 million dollars?Is it really possible for Bitcoin to reach one million dollars?
This is the complete Bitcoin data | from when it was $0.01 up to the last all-time high of $125K. Whether we like it or not, a large-degree pattern on Bitcoin is reaching completion, and we are looking at the chart without bias, purely through wave theory.
The symmetrical pattern you see on the chart is on the monthly or 2-week timeframe.
We are currently in the final wave, wave i of W. Wave i of W itself is a diagonal or symmetrical pattern (which we discussed in THIS POST () |this post only concerns branch i of W of this pattern).
When such a large pattern completes, there are two possibilities:
A counter cycle of the same degree begins , or
An X wave forms.
First scenario: forming a new pattern is very unlikely because if it happens, the Fibonacci 0.618 target of this pattern would be reached | around $4–$10 for Bitcoin. If this happens, the entire crypto market would effectively become a scam. This scenario is highly improbable and currently illogical.
Second scenario: the formation of an X wave. It’s worth explaining X waves: X waves connect patterns of the same degree without requiring large time-price corrections relative to the previous pattern, allowing a phase | whether bullish or bearish | to extend. Here, since the first phase is bullish, the pattern after the X wave will also be bullish.
For Bitcoin, if an X wave forms, the best range for it to end is $32K–$14K, and the X wave could last until 2027–2028. The two time lines indicate where the X wave could end.
When a new cycle begins, it is of the same degree as the previous pattern. This means we will have years of bullish phases with corrections, similar to the first phase W, which is represented on the chart from wave A to I.
The target of the second pattern, Y, after the X wave, can realistically reach $1 million! The estimated time frame for reaching this target is 2031–2039, but why the 8-year tolerance? This accounts for the pattern type: if it’s a triangle, these targets could be reached faster, but if it’s another multi-branch pattern, the timing may extend.
From a technical and wave-theory perspective, this is indeed possible. This is our broad 10-year outlook on Bitcoin.
❤️ Stay with us updates will be provided in the future with support and resistance zones plotted on the chart. Do you really think Bitcoin can reach $1 million?

Bitcoin Roadmap: Is This the Beginning of the Short-Term Rally?Today I want to share with you the Bitcoin ( BINANCE:BTCUSDT ) chart on the 15-minute time frame. This analysis is in line with the previous analysis (still valid) .
These days, considering that Bitcoin is facing many parameters to analyze. One of the most important parameters is the SPX500 index ( SP:SPX ). I am long on the SPX500 index.
Bitcoin is currently moving in the Support zone($91,900-$88,400) and near the Support lines and Cumulative Long Liquidation Leverage($91,131-$90,477) .
In terms of Elliott Wave theory, it seems that Bitcoin completed wave 5 with an Expanding Ending Diagonal , and we can now expect the start of the bullish waves , at least in the short term .
I expect Bitcoin to start rising from the Support zone($91,900-$88,400) and at least attack the Resistance lines . If the Resistance lines and the $95,700 level are broken with high momentum, we can expect further growth of Bitcoin.
First Target: $93,921
Second Target: $95,273
Third Target: $97,477
Stop Loss(SL): $89,537
Points may shift as the market evolves
Cumulative Long Liquidation Leverage: $88,570-$87,227
Cumulative Short Liquidation Leverage: $94,500-$93,785
Where do you think Bitcoin’s correction will go?
Please respect each other's ideas and express them politely if you agree or disagree.
Bitcoin Analysis (BTCUSDT), 15-minute time frame.
Be sure to follow the updated ideas.
Do not forget to put a Stop loss for your positions (For every position you want to open).
Please follow your strategy and updates; this is just my Idea, and I will gladly see your ideas in this post.
Please do not forget the ✅' like '✅ button 🙏😊 & Share it with your friends; thanks, and Trade safe.

Is Bitcoin still bearish? (1D)In response to the question of whether Bitcoin is still bearish | the answer is yes.
After the drop, Bitcoin has reached a strong support zone, where it’s currently reacting and consuming lower supports. A rejection from the red zone is expected.
However, keep in mind that due to the high volume of short positions, the red zone might even experience a fakeout before the drop continues.
A daily candle closing above the invalidation level would invalidate this analysis.
For risk management, please don't forget stop loss and capital management
Comment if you have any questions
Thank You

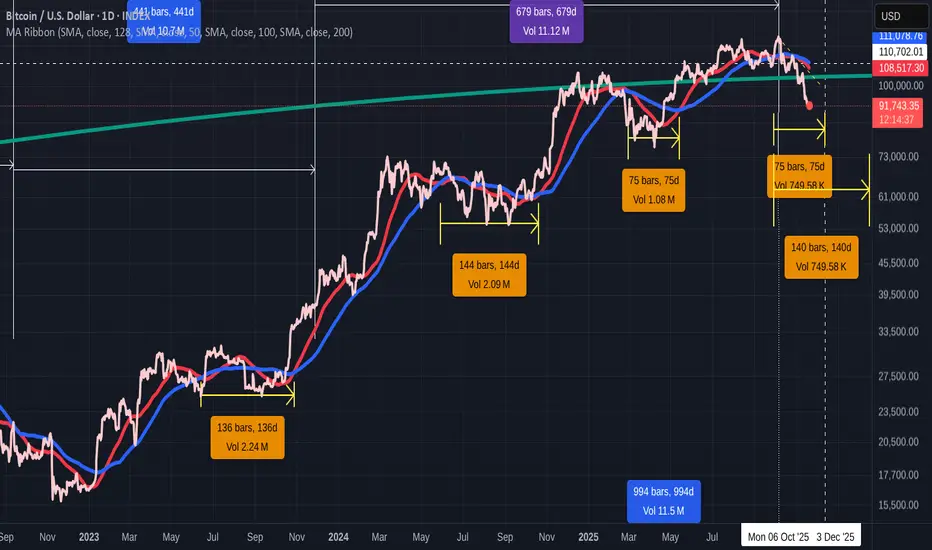
Bitcoin Daily 50 & 100 SMA day counts this cycle from crossover
This post is in conjunction with the weekly SMA I just posted.
It will predict nothing But it will give us an idea of how the "Cycle" is continuing or not, by the end of this month.
The day counts are from when the 50 SMA ( RED ) first drops below the 100 ( BLUE ) - BEARISH, to when the 50 Rises back above and remains above on the DAILY BITCOIN INDEX chart.
The First 2 occasions, since Jan 2023
2023 - 136 days
2024 - 144 days
Unusually, 2025 has 2 occasions where the 50 dropped below the 100.
The first lasted 75 Days in early 2025
And so , now, with the daily 50 having just crossed below the 100, we can maybe project forward and see when the 50 may recover back over the 100, IF the market remains Bullish
If we were to do another 75 days, we could expect the Bullish crossover at the beginning of December....which would be a similar total day count of the 50 below the 100 of the previous years this cycle ( 75 in early 2025 + 75 now )
THIS is what I think is possible as it has confluence with other charts.
If we have to wait around 140 days ( the average of the two previous longer occasions) we will be in February 2026
This Time does also have some confluence in other charts but it less strength
There is a Very Good reason Why O feel that PA HAS to climb again and that is simply that PA has fallen back below LONG TERM RESISTANCE>
As mentioned in many previous posts, that Blue Arc has rejected EVERY ATH since Bitcoin began its climb in 2011
There is also a line of resistance just below current PA position, that is squeezing PA....And it has never been crossed before.
IF PA drops much further, we WILL drop below that line of Support.
For me, THIS is what I am watching the most
Stay safe
Is it really possible for Bitcoin to reach 1 million dollars?Is it really possible for Bitcoin to reach one million dollars?
This is the complete Bitcoin data | from when it was $0.01 up to the last all-time high of $125K. Whether we like it or not, a large-degree pattern on Bitcoin is reaching completion, and we are looking at the chart without bias, purely through wave theory.
The symmetrical pattern you see on the chart is on the monthly or 2-week timeframe.
We are currently in the final wave, wave i of W. Wave i of W itself is a diagonal or symmetrical pattern (which we discussed in THIS POST () |this post only concerns branch i of W of this pattern).
When such a large pattern completes, there are two possibilities:
A counter cycle of the same degree begins , or
An X wave forms.
First scenario: forming a new pattern is very unlikely because if it happens, the Fibonacci 0.618 target of this pattern would be reached | around $4–$10 for Bitcoin. If this happens, the entire crypto market would effectively become a scam. This scenario is highly improbable and currently illogical.
Second scenario: the formation of an X wave. It’s worth explaining X waves: X waves connect patterns of the same degree without requiring large time-price corrections relative to the previous pattern, allowing a phase | whether bullish or bearish | to extend. Here, since the first phase is bullish, the pattern after the X wave will also be bullish.
For Bitcoin, if an X wave forms, the best range for it to end is $32K–$14K, and the X wave could last until 2027–2028. The two time lines indicate where the X wave could end.
When a new cycle begins, it is of the same degree as the previous pattern. This means we will have years of bullish phases with corrections, similar to the first phase W, which is represented on the chart from wave A to I.
The target of the second pattern, Y, after the X wave, can realistically reach $1 million! The estimated time frame for reaching this target is 2031–2039, but why the 8-year tolerance? This accounts for the pattern type: if it’s a triangle, these targets could be reached faster, but if it’s another multi-branch pattern, the timing may extend.
From a technical and wave-theory perspective, this is indeed possible. This is our broad 10-year outlook on Bitcoin.
❤️ Stay with us updates will be provided in the future with support and resistance zones plotted on the chart. Do you really think Bitcoin can reach $1 million?
BTCUSDT – Is This the “Wake-Up” Pullback Before a Breakout?While the market was still doubting Bitcoin’s momentum, BTC suddenly pushed to its highest level in weeks , leading a strong recovery across the crypto space. And this rebound didn’t happen by luck — it came from a mix of macro sentiment and real buying pressure .
On the news side, market sentiment is leaning toward the bulls as expectations grow that the Federal Reserve will soon end its rate-hike cycle . A softer Fed means less pressure on risk assets like Bitcoin, giving BTC more room to climb . Combined with rising institutional demand , the market is finding new reasons to believe in a potential recovery phase.
Another major driver is the anticipation surrounding the Spot Bitcoin ETF . Even the prospect of approval has boosted Bitcoin’s legitimacy in the eyes of institutions, creating a long-term supportive force. This is the “fuel” that keeps buy-side interest steady even though the chart still sits within a short-term downtrend.
On the 4H chart, BTC is reacting strongly at the major support zone around 90,300. Recent lows are no longer dropping deeper — a clear sign that selling pressure is weakening . If price continues to hold above this level and pushes toward the upper boundary of the descending channel, BTC could easily move up to the nearby resistance around 96,300.
In summary, with positive news flow and stable price reactions, buyers still have a good chance of driving a short-term Bitcoin recovery. A sensible strategy is to wait for a retest around 90,300 before considering long positions in line with the bullish bias.
