Could this be the final dump before Bitcoin pumps?Hi Guys
*Quick Disclaimer, this is not professional advice please do your own research before making any investments.
CHART OVERVIEW
The chart shows 6 Gann retracement lines and specific labels depicting certain phases of this suggested Wyckoff Accumulation Pattern, I won't go into every detail but will just discuss the end phase which we may be in right now, the bar pattern extending out from the current price is a projection of future prices and it is copied from the 29th of Jan until to the 21st of feb 2021 which was the movement out of our last accumulation phase.
ANALYSIS
We've just had a significant upthrust out of the last test of support, since then we've had a rough ride down towards the the bottom support area. The price is being pushed down, so far we have not reached the bottom of support, if this is a classic wyckoff accumulation pattern we'll see a further short sharp drop just under the 30k support with a quick turnaround, heading back above support (this is known as the "Spring").
Going out on a limb here, IMO the 30k support is such a strong support I doubt it will be broken. When everyone says it'll be broken and we're heading down to 27 or 24k that to me signals we're probably not. As i'm writing this the price is around 32k, so it may seem odd to be optimistic, however the best moments to invest tend to be in times of great fear.
On the chart we can see a bar pattern extending out of the current price, this was the actual sequence that happened two days after we reached the last dump in the last accumulation phase in January 2021; this is to show a very bullish outlook of what may happen, in a very approximate way.
CONCLUSSION
Only your future self knows exactly what's going to happen, we are in the field of spectacular speculation right now. This Wyckoff Accumulation Pattern makes the most sense to me, with my very bullish glasses on and going by this analysis we are going to see a huge reversal this week, perhaps within the next few days, then within 2 weeks we will be out of this pit stop and charging upwards; with my hybrid bear and bull glasses on I would say we are in for several more weeks or months of consilidation and with my full on bear glasses on we are heading down to 27 or 24k. I'm leaning more towards the most bullish sceneria of a turnaround not being so far away, what do you guys think, I would love to hear your thoughts?
Bitcoinbullish

Is Bitcoin bullish right now?Hi Guys
QUICK DISCLAIMER
First off please do your own research before trading/investing, this is not professional advice.
Let's crack on.
CHART OVERVIEW
Here is a weekly chart of the Bitcoin price (BTC/USDT); we are right now at this resting point, in the chart you'll see two Gann boxes placed side by side. The first Gann box extends from the major low to the major high, the second is copied and placed next to the box from the major low and high, creating one massive Gann box.
There are many lines (support and resistance) but Gann expressed the 45 degree angle to be the most important line.
I've placed two purple lines representing the two 45 degree angles, these can act as support and resistance depending on the price action.
Also there are retracement points I have set in green, the .375 and .5 are Gann retracements and the .382 is a Fib. retracement.
ANALYSIS
*The 45 degree angles
According to Gann the 45 degree angle is a perfect balance between price and time, price likes to gravitate towards this area. The further the price is above the ascending 45 degree angle the stronger the uptrend but also less sustainable the further away it climbs, the lower the price drops below 45 degree angle the stronger the downtrend but also less sustainable the lower it drops.
You can see that we are at this "tipping point" caught between these two 45 degree angles, we have touched and pushed above the top ascending 45d. angle on 4 occasions but have failed to convincingly close above it.
*The retracement points
The 0.5 is a significant retracement point and you can see that this has given us major support, in fact in the last 4 week candles we have closed above it. This support will be very hard to break convincingly, we have dropped below but the support has remained firmly intact. The retracement points above (.375 and .382) show strong confluence with previous price action. Judging by past price we can see that once these levels were broken, together with the 45d. angle, the bullish momentum continued.
CONCLUSSION
In my opinion we are in a massive re-accumulation zone or "shakeout zone". These are purposely designed to take the asset away from the public and into the hands of the big players pulling the strings of this specific episode. This current week could be the final major "grab" before the major uptrend continues, I expect one last short shakeout (potentially next week) around 40k before we recontinue the bullish uptrend. This is a very bullish scenario and could very well be incorrect, especially time-wise as this could last a few weeks or even months, however if you believe in the fundamental value of bitcoin then the current price action is a distorted reflection of the true intrinsic value of Bitcoin and therefore must be broken.
Would love to hear your thoughts and comments! Thank you for taking the time to read this!

Bitcoin is looking bullish!Bitcoin is breaking it's downward parallel channel.
This will require a strong follow through but so far it is looking very bullish.
Wait until the 4 hour candle is finished to confirm breakout.
*Disclaimer: This is not financial advice just my amateur observations.
What do you guys think, as I'm writing this the price is surging? Incredibly exciting!

Bitcoin W-Bottom Bullish Breakout Long at 37.3K! Time Sensitive!Hi guys, this is OG back with another daily technical analysis on Bitcoin. If you enjoy these posts, please like and follow, and feel free to ask questions and share your ideas in the comments below.
Today we are zooming in to the 15Min chart as I see a potential long trade setup. After the most recent rally, Bitcoin is having a small correction and have come down to the 200MAs on the 15Min chart. In this support zone, Bitcoin is forming a potential W-bottom, with the neckline at the 37.2-37.3K zone. If price breaks above this zone with a strong candlestick and strong volume, I will put in a long position, with stop loss below the 200MAs / swing low of 36-36.2K and targeting the recent highs of 38.5 as an initial take profit. Depending on the price action at that point, I will decide how much to take off the table and how much to keep in to target higher levels. Above the 38.5K level, we have 39.2K as a critical resistance level as it was the last major swing high, and price needs to break above that to start having a bullish reversal on the higher timeframes (4H and Daily).
As always, I’m not a financial advisor, do your own research, and stay safe!

Bitcoin Breakout Target Hit! Bear Trap & Bull Run To Continue?In yesterday's post, I mentioned that Bitcoin broke out of the inverse head and shoulders pattern after we got a bullish RSI divergence and that it was a good place for a long with a price target of 36.5K. That price target has been met, with price rallying as high as 37.5K. Price is now back within the symmetrical triangle and above the 200MAs. This is one of the three scenarios that I mentioned in my post 2 days ago, in which i laid out the path for price to break back into the symmetrical triangle, retest the bottom of the triangle as support and then rally up. So far we have seen price come back within the triangle, retest the triangle as support, and started another leg up, exactly as laid out in that post.
The next level to watch for the bulls is the triangle resistance at 38K to confirm further bullish momentum. On the downside, the triangle bottom of 36K is the level to watch. I break above 38K or below 36K could signal another big move in that direction. If price continues to go rally, we might have seen one of the biggest false breakdowns / bear traps in Bitcoin history, as the entire area from 35K to 31K, the area between the break below the triangle and then reclaiming back within the triangle, becomes an area that has trapped a large amount of shorts. These shorts could also serve as explosive fuel to the upside should price rally further and start to trigger more short liquidations and cause a short squeeze, where shorts are forced to buy in order to cover their short positions. It is still a bit too early to say that this is definitely the case, but a break above 38K would further confirm this thesis.
As always, I’m not a financial advisor, do your own research, and stay safe!

Buy Bitcoin While Its Still On DiscountBitcoin price is relatively cheap. Long term Bitcoin is bullish and will probably still reach $100,00 or beyond before the year is over. The adoption of Bitcoin is growing everyday. Paypal recently announced users will be able to buy, sell, send, receive and trade Bitcoin on their platform.
This is not financial advice, merely an opinion.

Will the Bull Season Continue?Bitcoin made a serious correction, I'm glad. The price remained above the EMA50 over the week period. In this collapse, the price touched its upward trend; March 2020, October 2020 and May 2021. The price came in an uptrend 7 months apart. With this logic, it will rise towards the end of the year and will seek support from the rising trend again in December. If the bull season ends, I think it may be the result of the upward trend break at the end of the year.
The price is currently around $36000 and moving up. There is significant resistance at $ 40,500. It would be nice if it closes above $ 40,500 weekly. Then we will continue with $50,000, $59,000, $70,000, $89,000 and $122,000.
My Bitcoin target is 122,000 dollars at the end of the year.

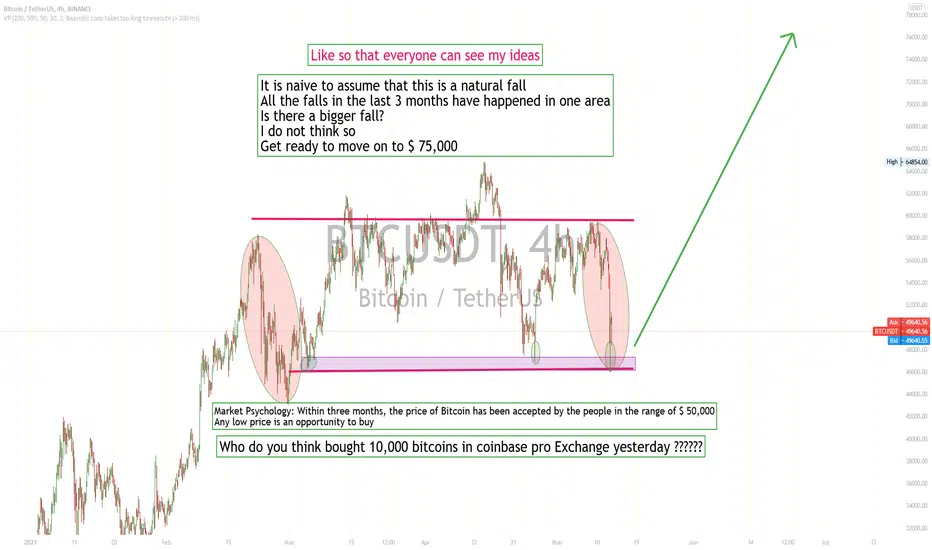
BTC USDT The cowards soldThe cowards sold
Big companies buy
Check out my ideas
I had correctly predicted this fall
Support me with likes and comments
Important points inside the idea
bitcoin ready to fly
$bitcoin
$btc
#bitcoin
BTC Going for Big Air?Bitcoin Dominance has rebound slightly, this trend-line has been closed above for most of the day. Inverse Head & Shoulders looking like a decent run for 60K + We shall see.
No guarantee, but looking decent.

🚀One Step Ahead - The bottom of the next Bear Market may be inEveryone is trying to figure out what will be the peak of the current Bull Market. However, when investing, you need to be forward-looking and think ahead. While the price target for the current market cycle is still very uncertain, it may be easier to foresee what will be the price floor of the next bear market.
Looking at the previous cycles, in both cases, the parabolic uptrend had a brief re-accumulation phase at around half of the way. The price level at which that consolidation happens market years after the same level at which the Bear market followed found its final support.
What if the current sideways price action on Bitcoin anticipates a more significant price drop instead of a new leg up? That is possible, yet unlikely. Usually, parabolic uptrends end up in a much sharper way. On-chain data and the macro environment are still positive, and that could offer a supportive tailwind for months.
Why predicting the bottom of the next Bear market is important? Because knowing that you have the chance to buy below such levels adds significant upside to your investment and will protect your allocation in future drawdowns. Short-term volatility may push prices slightly lower, but dollar-cost averaging Bitcoin may be a very interesting long-term strategy.
The best time to accumulate Bitcoin was years ago. The second-best time may be now.

Strong buying Growth Curve 61.8 Lvl and Bollinger Band BaseTL:DR
It appears we reached a local low
Everything Else
Greetings! I have been watching the Log Growth Curve for a while now and identified the 61.8 level as one of the more important levels when it cones to deterring the probable future of bitcoin. In previous markets cycles breaking the level has been indicated that bitcoin would be having a blow off top, but on each market cycle it seems bitcoin needs to spend more and more time to break through the level, as well as consolidate around the level. I continue to believe that once we get past this level onto the next level things are going berserk.
After the Pi cycle top indicator flashed we had a ferocious dump over the weekend.
Where did we fall? Right to the level I identified as crucial months ago. Even better, we only were below the level by 1% and less than 3 minutes.
I am personally in other cryptos as I think they have more upside but BTC is the benchmark for the whole crypto market. And the overall trend for bitcoin is bullish. Some of the best times to buy are when the price is out of the base of the daily bollinger bands.
To narrow it down to a realistic look at how we can recover I see it very likely that we get something resembling the last dump out of the daily bollinger band. Very probably we get a similar recovery with interactions around the blue trendline flipping from resistance to support. We can chop down here for a couple of days or longer.
Sidenote: I don't really buy this argument that it was because a power outage in China affecting the hash rate, unless the miners somehow coordinated to have their own power cut so they could time selling the market and rotate their bitcoin stores out of bitcoin into something else with more upside. It just so happened that the outage happened at the crux of a rising wedge after the pi cylce crossed. Who really believes the news these days anyway? /endsidenote

BITCOIN BIG RALLY IS COMING SOONBITCOIN PRICE IS GOOD ON CHART AND INVERTED HEAD & SHOULDER PATTERN BREAKOUT, AND PRICE SUSTAINABLE ABOVE THE BREAKOUT.

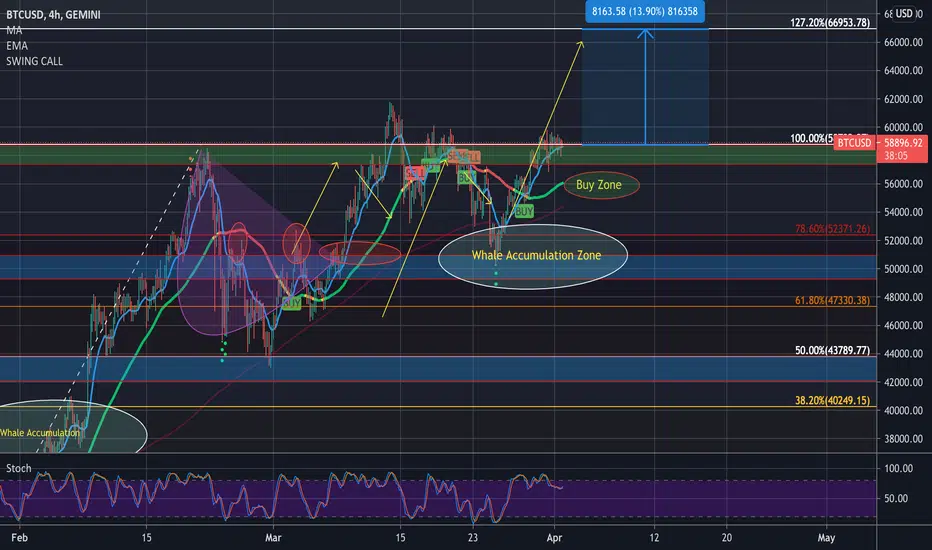
Bitcoin New ATH Target @ $66,953 6% Gain Bitcoin Update 13/04/21 Next Target @ $66,953 6% Gain to New ATH in April.
I've loved charting BTC last Month, analysis has been quite spot on just waiting on our new ATH now @$66,953 13% Gain from current price level. Bitcoin has found key support around $58k price level. It looks like the Bitcoin Bulls are back in the market after the 13 EMA crossed up above the 50 SMA on the 10th April signalling a strong Buy for BTC; since then we have seen an increase of 8% from $58,190 to $63,090. Worst case scenario from here in the short-term could see the price test the 50SMA ($58k), and breaking below this level would see another test of the 200SMA ($57k) before the anticipated move to the upside and our target of $66.953 at the 127.20% Fibonacci level. See previous analysis below. Happy trading :)
Update 29/03/21 Bitcoin next Target @ $66,953 21% Gain
Nice bounce from the whale accumulation zone at the 78.60% Fibonacci Level. Looks like the BTC Bulls are back in the market.
See previous analysis below.
BTC Monthly Outlook Update (23/03/2021) Approaching Whale Accumulation Zone at the 78.60% Fibonacci level @ $52,371. Interesting next few days from here as a bounce from the 200 SMA at the whale accumulation zone could finally see us break through the key resistance at the current ATH level from 14/03/21 @ $61,690. April is set to be a very interesting and pivotal month for the cryptocurrency space. See previous analysis and monthly outlook below. Happy Trading :) #whaleaccumulationzone
Update 21/03/21: Yesterday the Bulls failed to push the price higher and we had a small retracement down from $59.5k to $55.6 where we found some support of the current price level (-7%). From here the worst case scenario would find us in a key whale accumulation zone @ 78.60% Fibonacci level $52,371. However this scenario is unlikely to play out and as expected from the previous outlook before, we expect the Bulls to come back in the market, pushing as further to higher highs as we have been consolidating around this key price range between $54.5K to the current ATH @ $61.8k. If we fail to break past the previous ATH , the bearish scenario may see a test of the 200 SMA around the 78.60% Fibonacci level, otherwise the Bullish scenario is still in play. Note that from this current trend from 28th January we have only tested the 200 SMA once and a bounce from this level may signal a much stronger bullish move towards our price target $77,335 @ the 161.80% Fibonacci extension and further $107,340 @ the 261.80% Fibonacci level. So far great performance this month from BTC as March is usually quite a bearish month looking back at the past. April looks ready for us to really fly, testing the 161.80% Fibonacci extension , but note this may not be a straight forward push but all the fundamentals are pointing towards the $70K as our next significant area of interest for the Bulls, currently a 16% gain from the current price level would see BTC reach $66,953 127.20% Fib extension. See previous analysis from 1st March 2021 below. Happy Trading :) $BTC #HODL
*Update 20/03/21
BTC Monthly Outlook Update from 1st March 2021; 13 EMA crossing up 50 SMA showing strong bullish sentiment as we are about to enter the last week of the month, expect the bulls to come back and to push the price higher. Currently the 127.20% Fibonacci Target ($66,953) has not been tested yet, but we expect some big movement in price over the next few days and further going into the last week of the month (Yes, it has been March Madness), 13% Gain from the current price level @ $59,390 to $66,953 127.20% Fib extension. Our next target after this is $77,335 @ the 161.80% Fibonacci extension . From our analysis at the beginning of the month It looks like scenario 2 has been in play, see below previous analysis from 2nd March 2021.
In addition to previous price analysis, the Cryptocurrency 'Super Cycle' is in play as we are just at the brink of global adoption. 2017/18 was the hype era, we cannot continue to set targets based on the price movements during the cycle mainly fuelled by hyper and euphoria, it is now 4 years later and real development has been happening behind the scenes, a lot of people cannot quite comprehend the growth and the different cycle that we are now in as Moore's Law of exponential growth can only give us a hint at the growth that is about to be experienced over the next 4 year cycle. An increased influx of capital injection into this now trillion dollar market will only continue, as Defi takes its hold on current Global financial infrastructure, and yes history repeats itself, We call this the 'Roaring 20s' just like before at the end of WW1, the pandemic has only accelerated the current adoption rate of blockchain technology. As some are already aware, the best time to grow a million dollar portfolio was from 2009 to 2019 just after the housing market crash. The second best time in our lifetime is Now! from 2021 to 2029 after the pandemic market crash. We are still very much Bullish for BTC to reach our EOY Target of $356,000, See below key fundamentals which support our bullish sentiment.
*(March 02, 2021 Update)
BTC is currently consolidating at 61.80 Fibonacci Level. BTC outlook for the month ahead is still very much bullish . Although the sellers have been in control of the market since soaring to a new ATH on 21/02/21, BTC took a sharp retracement as expected at these new level of resistance as well as a new ATHof$58,792 on the Gemini Exchange. As from historic highs we see a lot of profit taking occurring after 3 weeks of setting new constant highs from the previous low of the last push wave which saw BTC setting a high of $42K and then sharply retracing down to $28,787 where we found the previous resistance and also the beginning of the last phase which saw one of the greatest run of Bitcoin in history, reaching the current ATH of $58,792.
With the current push phase now over we find ourselves asking how low can we go from here and when do we expect to break past a new ATH . This outlook is based on 2 possible scenarios which could both play out. We have seen the 50% Fibonacci retracement level respected on the last 2 Push phases which both set new ATHs, the first being $42K and latter, the recent high of $58K. As we have seen a strong retracement over the past 7 days back down to the 50% Fibonacci, it may be time for the BTC Bulls to regain control of the market as the current fundamentals point to the 50%-38.2% Fibonacci level of key resistance as well as a point of accumulation for the BTC whales, more importantly the $39,000 mark when looking left at the previous key resistance before the parabolic move to the $58k ATH .
With this in mind, from the current levels we could see the price of BTC sink further before the much expected move which could see BTC testing the previous High of $58k and further pushing to the 127.20% Fibonacci extension level setting a new ATH @ $66,953.
Scenario 2 would see the current push towards the ATH continue but may face some resistance, and further consolidation expected around $46k-$49k as they are the key Whale Supports towards the upside, so a further retracement could be in play, possibly testing the 50% Fibonacci level, as well as the 50 SMA , with a bounce confirming an explosive move to the upside which could see BTC easily smash past the 127.20% Fib extension level setting new fresh Highs between $67,000-$78,400+ by mid to late March. Use the buy zone indicated to map out your position as a possible 52% gain is achievable from the Buy zone. Stochastics showing an extremely oversold market condition. Happy Trading :) *
Key Supporting Fundamentals for BTC:
Strong Interest of Institutional Players
A survey of institutional investors and wealth managers who already engage with bitcoin reveals that 85 per cent plan to increase their investment in the cryptocurrency over the next two years.
The survey, which was commissioned by Nickel Digital Asset Management (Nickel), a regulated investment manager connecting traditional finance with the digital assets market, also reveals that between now and 2023, 72 per cent expect professional investors in general to invest in bitcoin for the first time or increase their exposure.
Current Economic Instability
The policy of the US Federal Reserve and the economic instability that has arisen as a result of the unprecedented emission of new dollars may further play a role in the growth of Bitcoin price...10% of the $380 billion stimulus money could be going directly into cryptocurrencies and Bitcoin .
Digital Gold
Crypto currencies certainly look as if they’re here to stay. It makes a lot of sense to have them in an increasingly digitised world. While bitcoin has a strong tendency to polarise opinion, it has now gained acceptance among some of the world’s largest financial institutions and payments companies. MasterCard, for instance, has said it will begin supporting crypto currencies on its network later this year. PayPal already allows eligible users to buy, sell and hold bitcoin in the US and expects to roll out its service in other territories soon.
The Case For Global Adoption and New Reserve Currency
Cryptocurrencies promise to help solve problems that are particularly acute in emerging markets (EM). Their governments are often centralized but relatively unreliable, which destabilizes currencies, opens the door to profiteering middlemen, and erodes public trust. Blockchain, the technology behind Bitcoin’s decentralized network, promises to cut out the grasping hands of governments and middlemen, and speed up transactions with more transparency and lower fees. It is offering what many EM customers are desperate for.
The Development and Extensions of Blockchain Technology
Due to the nature of blockchain technology’s ability to benefit all parties involved in different business operations. Since it was introduced in 2009 through the application of Bitcoin , blockchain technology continues to attract not just the financial institutions of the world, but also other fields and industries in insurance, law, entertainment and the Internet of Things ( IOT ) applications. Several scholars and advocates have also strongly suggested the use of the technology in voting systems globally, medical records and vehicle registrations by the state to further increase efficiency, simultaneously eradicating fraud in many areas. This technology does not only aim to improve conventional business operations but can also empower the greater society out of poverty as 1.7 billion adults in the world remain unbanked. The widespread adoption of a cryptocurrency like bitcoin running on the blockchain would mean that anyone with access to the internet can send and receive value from point A to B without the need of a third party.
Although many Banks were very hesitant and in fact spread fear in the markets due to cryptocurrencies being linked to nefarious activities on the dark web. A recent study by Goldman Sachs suggested that the adoption of blockchain technology in facilitating seamless cross border transactions without the worry of fraudulent transactions could save up to $6 billion a year; as the new models currently being developed by the bank would mean inefficient payment and accounting networks would be eradicated.

Bitcoin Update Next Target @ $66,953 13% Gain New ATH in AprilBitcoin Update 02/04/21 Next Target @ $66,953 13% Gain New ATH in April
I've loved charting BTC last Month, analysis has been quite spot on just waiting on our new ATH now @$66,953 13% Gain from current price level. Bitcoin has found key support around $58k price level. It looks like the Bitcoin Bulls are back in the market. Worst case scenario from here in the short-term could see the price test the 50SMA, and breaking below this level would see another test of the 200SMA before the anticipated move to the upside and our target of $66.953 at the 127.20% Fibonacci level. See previous analysis below. Happy trading :)
Update 29/03/21 Bitcoin next Target @ $66,953 21% Gain
Nice bounce from the whale accumulation zone at the 78.60% Fibonacci Level. Looks like the BTC Bulls are back in the market.
See previous analysis below.
BTC Monthly Outlook Update (23/03/2021) Approaching Whale Accumulation Zone at the 78.60% Fibonacci level @ $52,371. Interesting next few days from here as a bounce from the 200 SMA at the whale accumulation zone could finally see us break through the key resistance at the current ATH level from 14/03/21 @ $61,690. April is set to be a very interesting and pivotal month for the cryptocurrency space. See previous analysis and monthly outlook below. Happy Trading :) #whaleaccumulationzone
Update 21/03/21: Yesterday the Bulls failed to push the price higher and we had a small retracement down from $59.5k to $55.6 where we found some support of the current price level (-7%). From here the worst case scenario would find us in a key whale accumulation zone @ 78.60% Fibonacci level $52,371. However this scenario is unlikely to play out and as expected from the previous outlook before, we expect the Bulls to come back in the market, pushing as further to higher highs as we have been consolidating around this key price range between $54.5K to the current ATH @ $61.8k. If we fail to break past the previous ATH , the bearish scenario may see a test of the 200 SMA around the 78.60% Fibonacci level, otherwise the Bullish scenario is still in play. Note that from this current trend from 28th January we have only tested the 200 SMA once and a bounce from this level may signal a much stronger bullish move towards our price target $77,335 @ the 161.80% Fibonacci extension and further $107,340 @ the 261.80% Fibonacci level. So far great performance this month from BTC as March is usually quite a bearish month looking back at the past. April looks ready for us to really fly, testing the 161.80% Fibonacci extension , but note this may not be a straight forward push but all the fundamentals are pointing towards the $70K as our next significant area of interest for the Bulls, currently a 16% gain from the current price level would see BTC reach $66,953 127.20% Fib extension. See previous analysis from 1st March 2021 below. Happy Trading :) $BTC #HODL
*Update 20/03/21
BTC Monthly Outlook Update from 1st March 2021; 13 EMA crossing up 50 SMA showing strong bullish sentiment as we are about to enter the last week of the month, expect the bulls to come back and to push the price higher. Currently the 127.20% Fibonacci Target ($66,953) has not been tested yet, but we expect some big movement in price over the next few days and further going into the last week of the month (Yes, it has been March Madness), 13% Gain from the current price level @ $59,390 to $66,953 127.20% Fib extension. Our next target after this is $77,335 @ the 161.80% Fibonacci extension . From our analysis at the beginning of the month It looks like scenario 2 has been in play, see below previous analysis from 2nd March 2021.
In addition to previous price analysis, the Cryptocurrency 'Super Cycle' is in play as we are just at the brink of global adoption. 2017/18 was the hype era, we cannot continue to set targets based on the price movements during the cycle mainly fuelled by hyper and euphoria, it is now 4 years later and real development has been happening behind the scenes, a lot of people cannot quite comprehend the growth and the different cycle that we are now in as Moore's Law of exponential growth can only give us a hint at the growth that is about to be experienced over the next 4 year cycle. An increased influx of capital injection into this now trillion dollar market will only continue, as Defi takes its hold on current Global financial infrastructure, and yes history repeats itself, We call this the 'Roaring 20s' just like before at the end of WW1, the pandemic has only accelerated the current adoption rate of blockchain technology. As some are already aware, the best time to grow a million dollar portfolio was from 2009 to 2019 just after the housing market crash. The second best time in our lifetime is Now! from 2021 to 2029 after the pandemic market crash. We are still very much Bullish for BTC to reach our EOY Target of $356,000, See below key fundamentals which support our bullish sentiment.
*(March 02, 2021 Update)
BTC is currently consolidating at 61.80 Fibonacci Level. BTC outlook for the month ahead is still very much bullish . Although the sellers have been in control of the market since soaring to a new ATH on 21/02/21, BTC took a sharp retracement as expected at these new level of resistance as well as a new ATHof$58,792 on the Gemini Exchange. As from historic highs we see a lot of profit taking occurring after 3 weeks of setting new constant highs from the previous low of the last push wave which saw BTC setting a high of $42K and then sharply retracing down to $28,787 where we found the previous resistance and also the beginning of the last phase which saw one of the greatest run of Bitcoin in history, reaching the current ATH of $58,792.
With the current push phase now over we find ourselves asking how low can we go from here and when do we expect to break past a new ATH . This outlook is based on 2 possible scenarios which could both play out. We have seen the 50% Fibonacci retracement level respected on the last 2 Push phases which both set new ATHs, the first being $42K and latter, the recent high of $58K. As we have seen a strong retracement over the past 7 days back down to the 50% Fibonacci, it may be time for the BTC Bulls to regain control of the market as the current fundamentals point to the 50%-38.2% Fibonacci level of key resistance as well as a point of accumulation for the BTC whales, more importantly the $39,000 mark when looking left at the previous key resistance before the parabolic move to the $58k ATH .
With this in mind, from the current levels we could see the price of BTC sink further before the much expected move which could see BTC testing the previous High of $58k and further pushing to the 127.20% Fibonacci extension level setting a new ATH @ $66,953.
Scenario 2 would see the current push towards the ATH continue but may face some resistance, and further consolidation expected around $46k-$49k as they are the key Whale Supports towards the upside, so a further retracement could be in play, possibly testing the 50% Fibonacci level, as well as the 50 SMA , with a bounce confirming an explosive move to the upside which could see BTC easily smash past the 127.20% Fib extension level setting new fresh Highs between $67,000-$78,400+ by mid to late March. Use the buy zone indicated to map out your position as a possible 52% gain is achievable from the Buy zone. Stochastics showing an extremely oversold market condition. Happy Trading :) *
Key Supporting Fundamentals for BTC:
Strong Interest of Institutional Players
A survey of institutional investors and wealth managers who already engage with bitcoin reveals that 85 per cent plan to increase their investment in the cryptocurrency over the next two years.
The survey, which was commissioned by Nickel Digital Asset Management (Nickel), a regulated investment manager connecting traditional finance with the digital assets market, also reveals that between now and 2023, 72 per cent expect professional investors in general to invest in bitcoin for the first time or increase their exposure.
Current Economic Instability
The policy of the US Federal Reserve and the economic instability that has arisen as a result of the unprecedented emission of new dollars may further play a role in the growth of Bitcoin price...10% of the $380 billion stimulus money could be going directly into cryptocurrencies and Bitcoin .
Digital Gold
Crypto currencies certainly look as if they’re here to stay. It makes a lot of sense to have them in an increasingly digitised world. While bitcoin has a strong tendency to polarise opinion, it has now gained acceptance among some of the world’s largest financial institutions and payments companies. MasterCard, for instance, has said it will begin supporting crypto currencies on its network later this year. PayPal already allows eligible users to buy, sell and hold bitcoin in the US and expects to roll out its service in other territories soon.
The Case For Global Adoption and New Reserve Currency
Cryptocurrencies promise to help solve problems that are particularly acute in emerging markets (EM). Their governments are often centralized but relatively unreliable, which destabilizes currencies, opens the door to profiteering middlemen, and erodes public trust. Blockchain, the technology behind Bitcoin’s decentralized network, promises to cut out the grasping hands of governments and middlemen, and speed up transactions with more transparency and lower fees. It is offering what many EM customers are desperate for.
The Development and Extensions of Blockchain Technology
Due to the nature of blockchain technology’s ability to benefit all parties involved in different business operations. Since it was introduced in 2009 through the application of Bitcoin , blockchain technology continues to attract not just the financial institutions of the world, but also other fields and industries in insurance, law, entertainment and the Internet of Things ( IOT ) applications. Several scholars and advocates have also strongly suggested the use of the technology in voting systems globally, medical records and vehicle registrations by the state to further increase efficiency, simultaneously eradicating fraud in many areas. This technology does not only aim to improve conventional business operations but can also empower the greater society out of poverty as 1.7 billion adults in the world remain unbanked. The widespread adoption of a cryptocurrency like bitcoin running on the blockchain would mean that anyone with access to the internet can send and receive value from point A to B without the need of a third party.
Although many Banks were very hesitant and in fact spread fear in the markets due to cryptocurrencies being linked to nefarious activities on the dark web. A recent study by Goldman Sachs suggested that the adoption of blockchain technology in facilitating seamless cross border transactions without the worry of fraudulent transactions could save up to $6 billion a year; as the new models currently being developed by the bank would mean inefficient payment and accounting networks would be eradicated.
Bitcoin will go past $100k before December 1st 2021 (SURE THING)I will keep you updated.
Follow for daily BTC updates.
I only do Bitcoin, nothing else!!!

BTCUSD 4H-TIMEFRAME ANALYSIS✨BTCUSD 4H-TIMEFRAME ANALYSIS✨
Hello ladies and gentlemen
This is my new idea for Bitcoin BTCUSD
bitcoin Bullish Divergence
I expect the price to move higher...
I hope my idea is clear
Support me by like and share
Stay Safe💯
Good luck💰

BTC PEOPLE MUST BE BLINDso basically you à te traders
You learn that the market structure work in wave
You have a perfect 5 impulse drawing in front of you the bottom of the fourth wave.
So it’s a perfect swing , perfect position trading if you already in ?
Are you all dum and think btc will go to 38k.
The simple principle of wave impulse is that wave 4 never go in wave 1 area. So now will be the perfect timing of the market.
Guys you need to all look at the basics of wave mostly when they are that apparent

Inverse Head and Shoulder Pattern on BTC Hourly?Form the shoulder, break the neckline... Inverse Head and Shoulders - $47900 the target.
Could all turn to the brown stuff pretty quick mind :P

BTCUSDT 30m-TIMEFRAME ANALYSIS✨BTCUSDT 30m-TIMEFRAME ANALYSIS✨
Hello ladies and gentlemen
This is my new idea for Bitcoin BTCUSDT
bitcoin Bullish Divergence
I expect the price to move higher...
I hope my idea is clear
Support me by like and share
Stay Safe💯
Good luck💰

Bitcoin bull post halving schemaReview of schema of th bull after halving 2016 and reproduction on the bull after 2020 halving.

Bitcoin $122,000 - $146,000 This chart is an idea that shows the possibility of a target for the current bitcoin bull market, the green triangle highlights an area with a one-year time window from 21st of February 2021 to 21st of February 2022, this means the bitcoin value might reach this area between that range of time.
Tool: Fibonacci channel
If you find this idea interesting, you might give me a thumbs up, share it with others, or leave a comment.
Happy bitcoin bull market and HODL
Thanks in advance.

Pardon the 15min > Bull flag on BTC New ATHPossibly the first hints of a run to 50K, I've learned not to get too excited and I do think the short sellers will be taking opportunities to scalp the euphoria (I would as well but with very tight stops). This takes time and don't worry about it if we go down again, it happens and cheaper bitcoin allows you to harvest more sats in the meantime. 48377 is new ATH but it did not hold (possible double top scenario), so be cautiously optimistic and we are headed into a weekend where a dump can happen. Hodl unless you know what you are doing and be cautious about your positioning if you are trading this.

BITCOIN forming Inverted H/S at lower TF! Bullish sightElon Musk didn't help Bitcoin much, and the bears made it clear at the Daily close where they planned to send BTC from a few days' time. In the graph, however, they plot a nice Inverted H / S that could cause a pump at lower Time Frames. WSB, Elon, Jack are increasingly promoting Bitcoin and the situation with GME is only conducive to the decentralization of the financial market. I want to see an increase in volumes in the neckline and a spur pump at least to the first target. BEWARE OF BULLTRAP!
