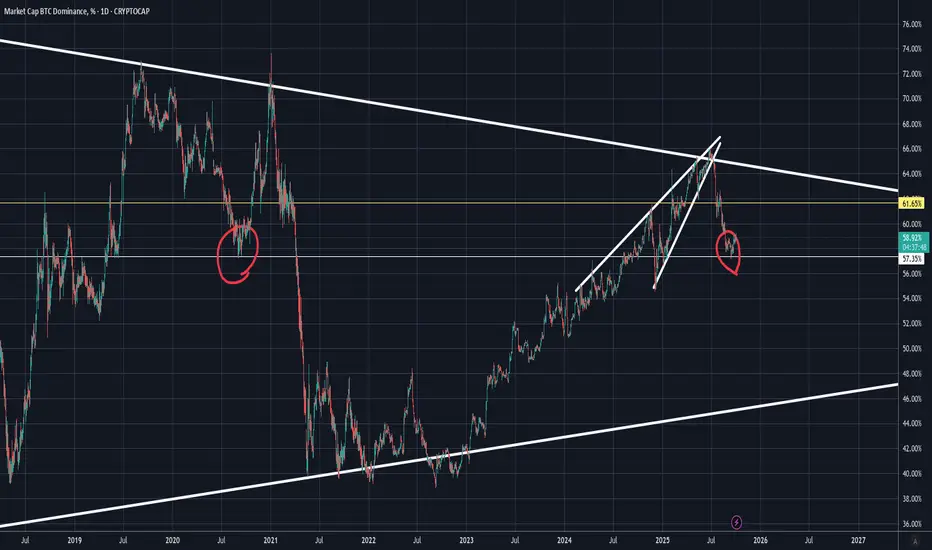
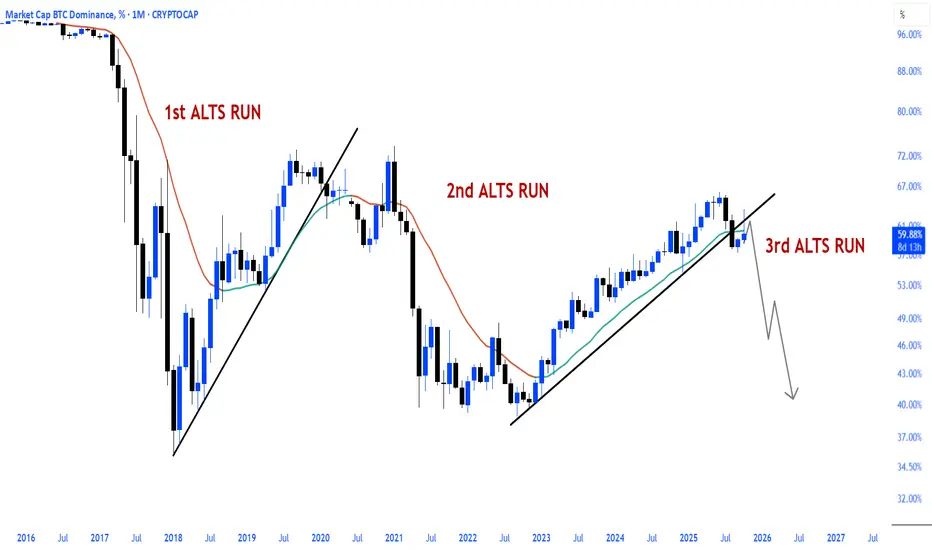
Alt-Coin Season Ahead - BTC.D About to Fall Off A CliffBitcoin dominance under 50MA about to lose 100W MA.
Highly likely we see a STRONG alt-coin season in 2026
Enjoy!
Bitcoindominance

BTC.D is about to dip – time for altcoins to shine?First of all, you should know that BTCDOM is a price index that shows Bitcoin’s market volume performance compared to altcoins. This index indicates how much market money is moving toward Bitcoin relative to other cryptocurrencies and can be useful for traders.
What is the difference between BTCDOM and BTC.D?
BTC.D: The traditional Bitcoin dominance index, showing the ratio of BTC’s market value to the total crypto market value as a percentage.
BTCDOM: A version of dominance available on Binance as a tradable instrument (futures), usually showing Bitcoin dominance relative to the top 20 altcoins (not the entire market).
The BTCDOM symbol has formed a price range, with the top of this range acting as a liquidity pool that was hunted. Now, the price is forming a double top pattern.
The trendlines have also been broken. It is expected to move soon toward the two targets marked on the chart, which could trigger a rally in altcoins.
If a daily candle closes above the invalidation level, this analysis will be invalidated.
If you have a coin or altcoin you want analyzed, first hit the like button and then comment its name so I can review it for you.
This is not a trade setup, as it has no precise stop-loss, stop, or target. I do not publish my trade setups here.

Understanding BTC, Bitcoin Dominance and TOTAL3 Rotations✅Bitcoin Dominance, BTC, Altcoins✅
Today, We're talking about the rotation of cash between Bitcoin and altcoins.
Imagine a pie where each slice represents a different cryptocurrency. The pie here indicates the total cryptocurrency market cap of both Bitcoin and altcoins, which can increase or decrease at any given time. In other words the TOTAL chart.
- If BTC market cap increases but altcoin market cap shrinks (relative), the pie stays the same size.
- If BTC market cap increase and altcoin market cap increases, the pie size increase and so forth.
Total Market Cap and BTC.D
At most of the key moments, we see a clear inverse relationship here. Alts drop harder than BTC, as this clearly shows. But during the cycle, investors hop on and off, injecting money into the ride (buying) and taking it out (selling). This constant movement is what keeps the crypto markets going.
Let's break it down with visuals:
Chart 1: Bitcoin
This rollercoaster represents Bitcoin's price action, and also my view on where we are in the current cycle. (I believe we're in a multimonth correction, followed by the last impulse wave up probably close to XMAS 2025 as usual). You'll need this to know where we are in the cycle right now:
Chart 2: Bitcoin & Bitcoin Dominance
This chart shows Bitcoin's dominance, which is basically its share of the total crypto market capitalization (market cap = total value of all cryptocurrencies). When Bitcoin's dominance goes up (higher on the chart), it means investors are putting more money into Bitcoin, potentially at the expense of altcoins. Conversely, when dominance goes down, it suggests capital is flowing towards altcoins. The difference is clear:
Chart 3: BTC.D vs TOTAL3
In this chart, we overlay the Total 3 Priceline (BLUE) on top of the Bitcoin Dominance chart. TOTAL3 shows us all alts except ETH.
The Bitcoin Rollercoaster and the S&P 500:
When Bitcoin surges (line goes up), it can sometimes lead to increased investor risk appetite. This might entice some investors to move funds from the S&P 500 into riskier assets like Bitcoin, potentially causing a slight dip in the S&P 500. Conversely, when Bitcoin experiences a price drop, investors might flock back to the perceived stability of the stock market, potentially causing a rise in the S&P 500.
So, is there a guaranteed CORRECTION? All the signs are proving this may be the case. By understanding the relationship between Bitcoin, altcoin prices and dominance, you can get a better sense of where the money merry-go-round might be headed.

When Will Altcoin's Pump in 2025/26? BTC Dominance Analysis📊 BTC Dominance Breakdown — When Will Altcoins Start Pumping in 2025 or will it be 2026?
This chart shows BTC Dominance (BTC.D), which tells us how much of the total crypto market value is sitting in Bitcoin versus altcoins.
When BTC.D goes down, it means money is rotating into altcoins → that’s when altcoins pump.
Right now BTC.D is moving inside a clean down-trending channel, meaning the long-term direction already favors altcoins — but the timing depends on one key level.
✔️ The Key Idea
Before altcoins explode, BTC.D typically makes a retracement (a bounce upward) and then rejects from a major resistance line.
In this chart, that critical level is around 60% dominance.
📌 What Happens Next (Simple Version):
BTC.D might bounce back up toward 59–60% (green path on the chart).
This bounce is normal and usually happens before altcoins take over.
If BTC.D gets rejected at 60% and falls:
First target: 57%
Then continuation lower toward 53–55%
💡 Why this matters
A drop from 60% → 55% → 53% is historically the point where:
🔥 Altcoins start outperforming Bitcoin
🔥 Altcoin season begins
🔥 Money rotates heavily into mid-caps and small caps
⏳ So When Will Alts Pump?
If BTC.D follows this pattern, the first big altcoin push should start right after the 60% rejection, likely late December → February range.
The massive altcoin run comes when BTC.D breaks below 57%, which your chart suggests could happen early 2026, kicking off a sustained altseason.

FireHoseReel | USDT Dominance & BTC Dominance Overview😄 Hey! How’s everything? Hope you’re doing great!
🍾 Welcome to FireHoseReel — make sure to follow and enjoy the analysis along the way.
If you ever want a custom chart breakdown, just leave a comment and I’ve got you.
😎 Let’s dive into the analysis of two major crypto dominances: USDT and Bitcoin.
✔️ USDT Dominance Technical Analysis
• On the 4-hour timeframe of USDT dominance, we can see that after repeatedly breaking through multiple resistance levels on the chart, USDT.D has reached a point of heavy overbought conditions. It’s now sitting at a strong resistance zone.
If this resistance breaks, USDT dominance could push even higher, which would bring additional downward pressure on the market, especially on Bitcoin and altcoins, leading to another wave of selling.
• If USDT dominance rejects from this zone and starts moving downward, the nearest support to be tested is around 6.148%. Losing this support would signal the beginning of the first bullish wave in the market, giving us a potential opportunity to start opening long positions once this level breaks down.
• Another key level is the resistance at 6.623%.
If USDT dominance breaks above this level, it could trigger an even stronger bearish wave compared to the previous one, causing a deeper correction across the market.
✔️ BTC Dominance Technical Analysis
• On the 4-hour timeframe of Bitcoin dominance, we can see that after the recent market drop, BTC.D also moved downward and went through a relatively deep correction.
What’s important here is that despite the decline in Bitcoin dominance, altcoins did not experience a heavy correction, and most of them held their levels without major downside movement.
• If Bitcoin dominance loses the 58.80% level, it could extend its correction even further.
However, the key reversal zone for the 4-hour trend lies at 59.31%. A breakout above this level can trigger a solid bullish wave in BTC.D.
• Our confirmation for this bullish wave would be the formation of a higher low above this resistance zone, signaling a potential upward trend continuation.
🛞 Risk Management & Disclaimer
Please remember to always use proper risk management and position sizing. Nothing in this analysis is financial advice. The market can change quickly, so always trade based on your own strategy, research, and risk tolerance. You are fully responsible for your own trades.

Bitcoin Dominance: 1 - 2 - 3 - ... what should we expect ??Sentiment is low.
Fear and Greed Index is at Yearly Low - printing 11 points.
Everybody is calling for Bitcoin to 30'000 USD.....
1 - 2 - 3 - ...
what should we expect to happen next ??

Bitcoin Dominance Breakdown Ahead? Altseason Signals Emerging!Analysis:
BTC Dominance is showing strong signs of weakness.
After a failed breakout and rejection from the upper boundary of the descending channel, dominance is now testing the short-term ascending trendline (orange).
Losing this level (~59%) could trigger a deeper drop toward 57% and possibly 54.5%.
Main scenario (65% probability):
🔻 Breakdown below 59% → bearish continuation → capital rotation into altcoins.
Alternative scenario (25%):
⚖️ Sideways movement between 59–61% before decision.
Bullish invalidation (10%):
🟢 Daily close above 61.5% → short-term BTC strength continuation.
Momentum and structure both favor downside — altcoins may soon take the lead.

Bitcoin Dominance Rejection and Altcoin Pump👋🏻 Hey everyone! Hope you’re doing great! Welcome to SatoshiFrame channel.
✨ Today we’re diving into the 1-Day Bitcoin Dominance analysis. Stay tuned and follow along!
👀 On the daily timeframe, Bitcoin dominance has reached a key resistance zone at 60.73%. If this level breaks, we could see a deeper correction across altcoins. However, a rejection and move downward could trigger a strong rally for altcoins. As Bitcoin’s market weight decreases and capital flows into altcoins, we might be entering an early altseason, presenting potential profit opportunities.
🕯 From a technical perspective, Bitcoin dominance is moving within a well-structured ascending channel. The midline of the channel acts as a solid rejection point. A Fibonacci retracement from the previous downtrend shows a 38% overlap with this midline — a tough level to break. After a strong bearish candle rejection from that area, dominance is now heading lower. If the move continues, we could see a test of the channel’s lower boundary, and a confirmed breakdown would strengthen the altcoin bullish scenario.
💰 Typically, capital rotation in crypto follows this pattern: money flows into Bitcoin, then Ethereum, then the top 10 coins, and finally into smaller altcoins — before converting to USDT and exiting the market. With Bitcoin dominance currently at high levels after a solid Bitcoin season, this could signal the early stages of capital shifting toward altcoins. Traders should watch closely for these shifts to maximize profitability.
❤️ Disclaimer : This analysis is purely based on my personal opinion and I only trade if the stated triggers are activated .
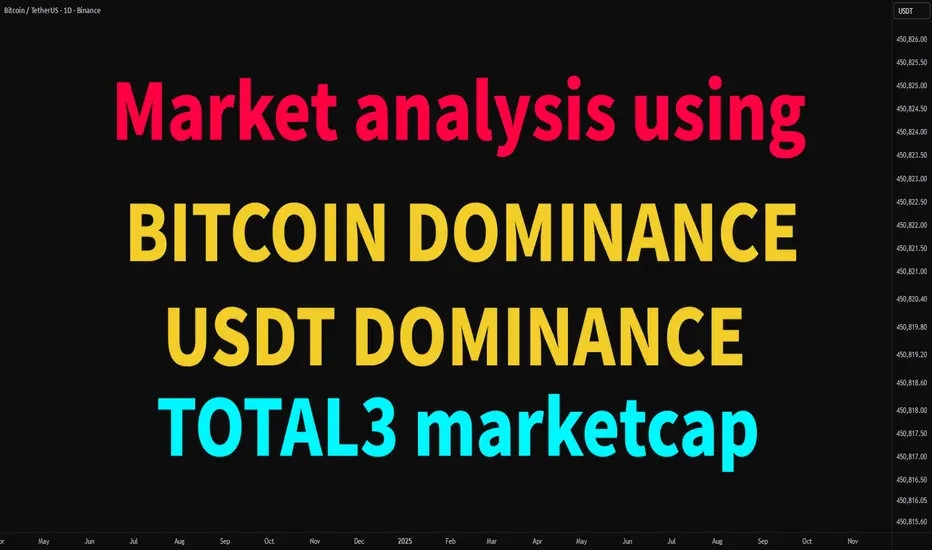
Market analysis using bitcoin dominance & usdt dominance chartsWe aim to conduct an in-depth analysis of the correlations among four key indicators used to interpret the complex dynamics and investor sentiment in the cryptocurrency market — Bitcoin Dominance, USDT Dominance, TOTAL3, and the Coinbase Premium — and to share insights on how these can be effectively utilized in real trading strategies.
By analyzing these four indicators together, traders can identify the overall market trend, gauge the vitality of the altcoin market, and assess institutional participation, which provides a foundation for developing mid- to long-term trading strategies.
First, please click Boost (🚀) so that more people can see this post.
💡Understanding the Key Indicators
Bitcoin Dominance: CRYPTOCAP:BTC.D
The ratio of Bitcoin’s market capitalization to the total cryptocurrency market capitalization.
It represents Bitcoin’s market strength relative to altcoins.
USDT Dominance: CRYPTOCAP:USDT.D
The ratio of Tether (USDT) market capitalization to the total cryptocurrency market capitalization.
It helps identify risk-on/risk-off sentiment among investors and assess the level of market liquidity.
TOTAL3: CRYPTOCAP:TOTAL3
The total market capitalization of all altcoins excluding Bitcoin (BTC) and Ethereum (ETH).
It directly reflects the overall momentum of the altcoin market.
Coinbase Premium Index: TradingView Indicator
An indicator showing the price difference of BTC between Coinbase and other major exchanges (e.g., Binance).
It is used to indirectly gauge institutional buying pressure (positive premium) or selling pressure (negative premium) in the U.S. market.
⚙️Interaction of Indicators and Trading Strategies
These four indicators exhibit specific patterns under different market conditions.
By analyzing them comprehensively, traders can identify medium- and long-term trading opportunities.
Correlation between BTC price and indicators:
BTC price vs BTC.D: Complex correlation.
BTC price vs USDT.D: Mostly inverse correlation (USDT.D rising = market uncertainty and BTC decline)
BTC price vs TOTAL3: Mostly Positive correlation (BTC rise = TOTAL3 rise)
BTC price vs Coinbase Premium: Mostly Positive correlation (sustained positive premium = continued BTC uptrend)
✔️Scenario 1: Bullish Phase📈 (Bitcoin-led Rally)
BTC.D rises: Capital concentrates into Bitcoin
USDT.D falls: Increased risk appetite, cash inflows grow
TOTAL3 moves sideways or slightly upward: Altcoins remain weak or unresponsive
Coinbase Premium rises and stays positive: Institutional buying inflow
Interpretation:
Strong institutional buying of Bitcoin drives the market, with capital shifting from stablecoins into BTC.
Altcoins may lag behind this movement initially.
Strategy:
If the Coinbase Premium remains positive even during minor BTC corrections, it favors building long BTC positions.
When the positive premium persists and BTC breaks key resistance levels, it can be interpreted as a strong buy signal.
During early stages, focus primarily on Bitcoin rather than altcoins.
✔️Scenario 2: Strong Bull Market📈 (Altcoins Join the Rally)
BTC.D declines: Capital rotates from Bitcoin to altcoins
USDT.D declines: Ongoing risk appetite and continuous inflows
TOTAL3 rises: Peak momentum in the altcoin market
Coinbase Premium remains positive: Continuous liquidity inflow
Interpretation:
As Bitcoin stabilizes or trends upward, capital starts flowing aggressively into altcoins.
The rise in TOTAL3 reflects broad-based strength across the altcoin market.
Strategy:
Select fundamentally strong altcoins and build positions gradually.
During this phase, large-cap and small-cap thematic groups may experience rotational pumps — monitoring related narratives is crucial.
✔️Scenario 3: Bearish Market📉
BTC.D rises: Altcoins fall more sharply as BTC declines
USDT.D rises: Strengthened risk aversion and increased cash positions
TOTAL3 declines: Deepening weakness in the altcoin market
Coinbase Premium drops and stays negative: Institutional selling or halted buying
Interpretation:
Heightened market anxiety leads investors to liquidate risk assets and move into stable holdings such as USDT.
Institutional selling pressure pushes the Coinbase Premium negative or maintains it in a downward trend.
Altcoins are likely to experience the greatest losses in this phase.
Strategy:
Reduce crypto exposure or convert positions to stable assets (USDT) for risk management.
During technical rebounds, consider trimming positions or cautiously taking short opportunities (with higher risk).
✔️Scenario 4: Sideways or Correction Phase
BTC.D moves sideways: Range-bound consolidation
USDT.D moves sideways: Persistent risk aversion and lower market volume
TOTAL3 moves sideways: Altcoin market remains flat or slightly weak
Coinbase Premium stable: Fluctuates between positive and negative values
Interpretation:
The market enters a wait-and-see phase with sideways movement or mild correction.
The Coinbase Premium’s neutrality reflects uncertainty in institutional capital flows.
Strategy:
Monitor BTC and TOTAL3 reactions at major support levels before re-entering positions.
It may be prudent to stay on the sidelines until clear institutional accumulation or positive catalysts emerge to restore sentiment.
🎯TradingView Chart Setup and Usage Tips
Multi-Chart Layout: Use TradingView’s multi-chart feature to display BTCUSDT, BTC.D, USDT.D, and TOTAL3 simultaneously for comparative analysis. (Apply Coinbase Premium as an additional indicator.)
Timeframes: For short-term analysis, use 1H, 4H, or 1D; for medium- to long-term, use 1W or 1M charts. Confidence increases when multiple indicators align across the same timeframe.
Trendlines and Support/Resistance: Draw trendlines, support, and resistance on each indicator chart to identify key inflection points. Breakouts on USDT.D or BTC.D often signal major market shifts.
Supplementary Indicators: Combine RSI, MACD, or other technical indicators to detect divergences or overbought/oversold zones for added precision.
⚡Analytical Value and Considerations
Comprehensive Market Insight: Analyzing all four indicators together enhances overall market understanding.
Leading vs Lagging Indicators: Coinbase Premium can serve as a leading signal, while dominance and market cap metrics act as coincident indicators reflecting current conditions.
Probabilistic Nature: These indicators are not predictive tools but should be interpreted within a broader context of market variables.
Risk Management: Always apply stop-loss measures and manage exposure carefully. Be prepared for deviations from expected market behavior.
🌍Conclusion
Bitcoin Dominance, USDT Dominance, TOTAL3, and the Coinbase Premium Index are fundamental components in decoding the complex structure of the cryptocurrency market.
Analyzing them in conjunction enables a deeper understanding of market sentiment, anticipation of upcoming opportunities and risks, and the development of a more intelligent and stable trading strategy.
💬 If you found this analysis insightful, share your thoughts in the comments!
🚀 Don’t forget to hit Boost to support the post!
🔔 Follow to make sure you don’t miss the next market insight!
BTC Dominance Analysis (1D)It seems that wave G is not yet complete because its time frame hasn’t fully played out, and the upward momentum is strong enough that with a little pause, it could move toward higher zones to complete wave G.
A key area has been marked on the chart; if it gets breached, this index could experience a deep drop.
The chart is a bit complex, and for now, this is our view on Bitcoin dominance.
Let’s see what happens.
For risk management, please don't forget stop loss and capital management
When we reach the first target, save some profit and then change the stop to entry
Comment if you have any questions
Thank You

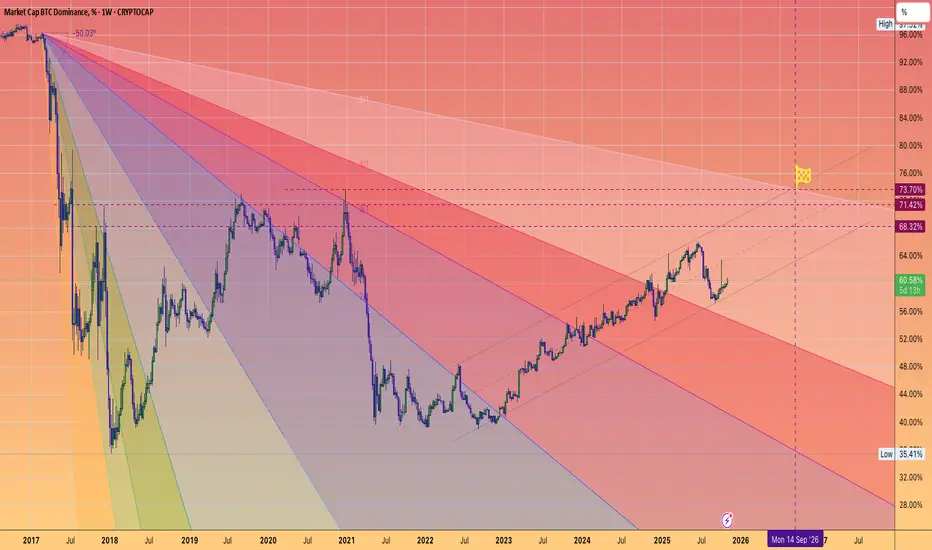
BTC.D May not TOP until next September!Despite alt/BTC pairs looking battered
**Capitulation is likely not complete**
Most Altcoins remain in downtrends v BTC
Timeline:
2025: grind to 63-65%
2026 Final Push to 73%?
Altcoins to seek relief once this finally turns around.
You may be able to start DCA'ing BTC as early as next March in preparation to buy beaten down quality Alts...
focusing on ETH, SOL, and 2's that have usage... not simply clogging up the landscape of empty chains.
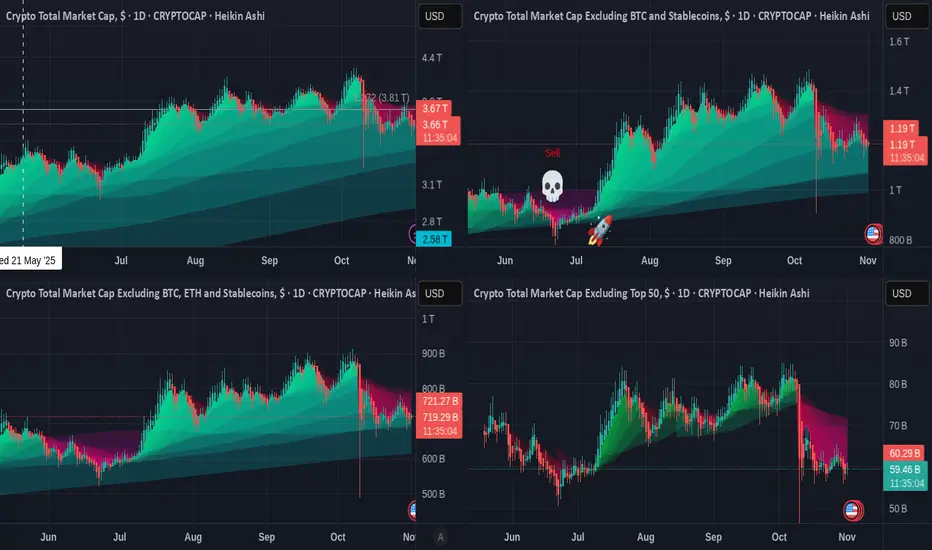
The 4 TOTAL Crypto Charts with Easy to see performance values
These charts use the " RK's 10 ∴ MA Types Ribbons (Fibonacci, Guppy and others) " indicator in TradingView.
It is simply SUPERB and is unparalleled.
So, to business. These are all DAILY charts from around mid MAY 2025
Top Left TOTAL chart - Top Right TOTAL2 (Excluding Bitcoin)
Bottom Left TOTAL3 ( Excluding BTC & Eth ) - OTHERS ( Top 125 coins minus top 10 by Market Cap )
First thing to notice is simply how the TOTAL chart is the Deepest, showing a Bigger Market trading volume. This shows us how it is BITCOIN that holds the market as all the other charts EXCLUDE Bitcoin and are more Shallow by comparison.
We can also see how the TOTAL2 chart ( exc BTC) is the only one with a SELL signal. This is the Fragility of ETH.
Looking to the RED zones on these Charts. This is where Moving Averages Fell, crossing each other as Price dropped.
The TOTAL chart has the smaller red zones, showing more resilience,
And we can see the progressively worsening situation in the ALT market, with OTHERS having a truly terrible time.
There are people out there Still Claiming an ALT Season like we used to know, is on its way.
I am sorry but while it is obviously possible, It seems obvious to me that Times HAVE changed.
The 4 DOMINANCE charts also tell us a story
These are WEEKLY charts :-
Top Left BTC.D - Top right ETH.D
Bottom Left OTHERS.D - bottom Right USDT.D
We all know about Bitcoins utter Dominance this cycle, the main cause of the lack of a sustained ALT season. TOTAL chart, or BITCOIN is the only one that remains above its 100 EMA (blue), 128 EMA ( green) and the 200 EMA ( Yellow)
None of the other charts involve Bitcoin and they are Not as strong.
We See how ETH.D was falling away until recently when it turned higher in late April 2025 but as we see from the main chart, this failed to really make any inroads into Bitcoins status, and is now once again falling away
What is VERY Telling os how the OTHERS.D has been falling away since March 2024.
ALTS have been loosing the battle for over a year now, a sustained growth never appeared.
Quick flash in the Pan rises followed by massive sell offs.
Apart from some coins that have sustained growth, like SOLANA and BNB but this is another story for another post.
What I do find very interesting is how USDT.D is in a diminishing pennant....the use of USDT getting smaller and smaller as "Cashing out" is reduced.
So, where are we in the Market ?
I feel that the ALT Traders will soon begin to loose Faith and may begin the flow of whats left into the ore established ALTS...like SOLANA, BNB and maybe XRP etc. Rotation will begin.
The USa Will continue to push ETH as an alternative for BTC
I think we have a Very strong possibility this "Bull run" will morph into the Normality of Crypto, we may not see the massive sell off we got used to previously.
This will curb the massive profit possibilities and no one wants to see this but Bitcoin has Matured away from the petulant teenager...and is now an Adult.
This is very much my opinion and YES, I do still Hold some ALTS.....
But BITCOIN has ABSOLUTELY CONTROLLED THIS and will continue to do so.
Bitcoin strong, Dominance weak.Bitcoin maintained its strength above the major uptrend and support zone, while BTC Dominance broke below the major uptrend and also received confirmation of a retest of the major resistance and major uptrend for the downside.
For altcoins, this is a trend towards the beginning of a new momentum.

$BTC.D down $BTC up : ALTS run.CRYPTOCAP:BTC.D down CRYPTOCAP:BTC up : ALTS run.
Bitcoin dominance has broken down from its major uptrend and is currently in a retest.
It's important to remember that dominance alone isn't an altseason indicator; the key is for dominance to decline alongside Bitcoin's rise.
When this scenario plays out, a healthy altcoin season, as seen in the past, will resume.
So why did Altseason start in 2017 when BTC was falling?
1. Capital Rotation from Bitcoin to Altcoins
When Bitcoin approached $20,000 at the end of 2017, investors fell into the mindset that "BTC has risen too much, altcoins are cheaper."
Those who realized their profits sold Bitcoin and moved to altcoins.
So money didn't leave the market — it just changed direction within it.
That's why altcoins soared even as BTC fell.
2. New investor influx and FOMO
New investors entering crypto at that time turned to coins like Ethereum, Ripple, IOTA, ADA, and NEO, saying "Bitcoin is expensive."
New money flowed directly into altcoins.
So even as Bitcoin fell, the total market value continued to grow.
3. The historic collapse of dominance
BTC dominance fell from 65% in December 2017 to 35% in January 2018.
This was the sharpest "altcoin rotation" in history.
In short, everyone was "dumping their BTC profits into altcoins."
4. The ICO boom
Thousands of new projects were issuing ERC-20 tokens.
Demand for Ethereum skyrocketed because everyone was participating in ICOs with ETH.
This accelerated the shift from BTC to ETH and ignited the altcoin bull run.
5. Liquidity staying in the market
The stablecoin ecosystem was not yet developed (USDT was limited).
So when investors wanted to take profits, they were fleeing to altcoins instead of cashing out to fiat.
This caused altcoins to shine.
$BTC.D Death Cross Has Occurred! The Signal on ₿itcoin Dominance We've Been Waiting All Cycle For 🔥
20 / 50 WMA Death Cross has officially occurred on CRYPTOCAP:BTC.D
So close to Alt Season I can taste it 😋

Bitcoin Dominance Trend Line Broken The breaking of this trend line suggests further downsides are coming for dominance BTC
Alts will be moving more than BTC as they gain dominance relative to it
Altszn after this massive dump
1day chart

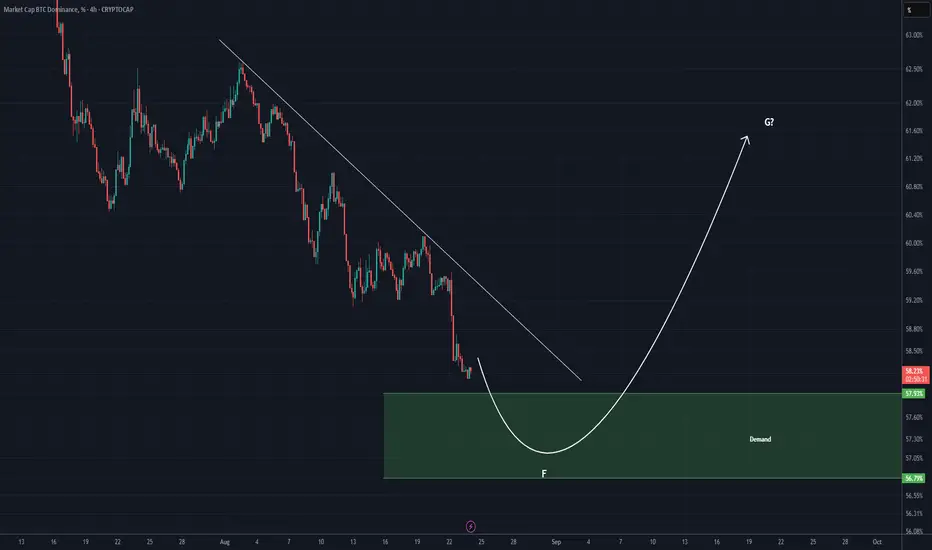
BTC DOMINANCE Update (4H)This analysis is an update of the analysis you see in the "Related publications" section
As expected from the previous analysis, we anticipated a drop in this index, and the drop is currently in progress.
One important point to note is the green zone, which is a strong support area. It is possible that the diametric/symmetrical structure we discussed in earlier analyses is still intact. In that case, wave F of this diametric pattern may complete in the green zone, and candles could then enter wave G | a bullish wave that may trigger a significant correction in altcoins.
For risk management, please don't forget stop loss and capital management
When we reach the first target, save some profit and then change the stop to entry
Comment if you have any questions
Thank You
$BTC.D Head and Shoulders + Death CrossWho remembers when I put out this Head & Shoulders idea for CRYPTOCAP:BTC.D September 2nd? 🤓
On the verge of the 20 / 50 WMA Death Cross ☠️
This SHOULD be the top for ₿itcoin Dominance.
Does not mean that it won't float around here for a few weeks tho 🫶

Is Altseason About to Begin?The market structure suggests we’re currently in wave C of the second corrective wave (2) — and it looks close to completion.
A potential ending diagonal and bullish divergence on momentum indicators signal exhaustion among sellers.
At the same time, Bitcoin dominance is testing a key resistance zone — a level where liquidity often starts rotating into altcoins.
📈 If the current low holds, we could be witnessing the early stages of wave 3 — the impulsive phase where altcoins usually outperform Bitcoin.
🟢 Base scenario: Correction ending → beginning of a new bullish phase
🔴 Alternative scenario: Breakdown of the current low → completion of a W–X–Y structure

Altcoin Fear Rising — But Liquidity Shift Is ComingI know the current pullback on altcoins has greatly increased the fear of a deeper drop, especially since Bitcoin just hit a new all-time high at $126,200 yesterday.
Yet, the Bitcoin Dominance Index (BTCDOM/USDT) shows that the price is getting ready for a major decline.
This suggests that liquidity could soon start flowing into altcoins, potentially starting this week.

DeCode | Crypto Macro OutlookTopic: Macro Crypto Outlook
Context: BTC.D, DXY, Equities, CRYPTOCAP:BTC , News
Article:
Macro Crypto Outlook (Weekly Summary)
Assets: BINANCE:BTCUSDT.P TVC:DXY CRYPTOCAP:BTC.D BINANCE:ETHBTC
In this Weekly Macro Crypto Outlook , we break down the current state of the market and outline our forward-looking thesis for Bitcoin, Ethereum, and Altcoins.
Volatility is high.
Some believe the cycle has topped.
Others expect one final leg before the market turns.
At DeCode, we look past the noise and focus on data, structure, and context.
Let’s decode the charts together and map out what’s ahead for the rest of 2025.
Bitcoin Outlook
Bitcoin is now attempting a breakout on the weekly chart, reclaiming the previous structural Higher High. To confirm this move, we need at least two consecutive candle closes above $119,655. Despite multiple rejections from the recent highs, the market has absorbed that bearish pressure and pushed higher; a strong signal of underlying bullish strength.
If this breakout holds, the next targets lie at the +5 and +6 VWAP standard deviations, sitting around $137,000 and $151,500, which represents a potential +10% to +20% move from current levels. On the daily chart, we’re seeing six consecutive bullish closes, but short-term momentum is starting to fade, specially with a clear 3-Drive pattern that often lead the start of a pullback from Short Sellers.
Entering at all-time highs is rarely optimal, neither profitable so pullbacks are opportunities, not threats.
Key zones to watch on a retracement are:
$118,880
$112,600
$107,450
While a deep correction is unlikely given current momentum, the deeper the pullback, the better the Risk/Reward for those waiting with patience and a plan.
BItcoin Dominance & ETHBTC
Bitcoin Dominance (BTC.D) turned bearish a few weeks ago, but we’re now seeing early signs of a potential pullback. From a weekly perspective, the trend remains to the downside as long as BTC.D stays below 62.62%. However, the recent failed auctions on both the Weekly and Daily timeframes suggest we could see a short-term bounce in dominance.
A rising BTC.D means Bitcoin takes the spotlight and altcoins suffer disproportionately. Until we see clear weakness in BTC.D, it’s wise to keep altcoin exposure controlled.
The 60.85% – 59.57% zone is the key area to watch. If BTC.D starts showing rejection or weakness there, it could open a high-conviction window to rotate into undervalued alts.
ETHBTC remains the primary signal for altcoin strength and the true beginning of altseason. In our view, it hasn’t started yet. Recently, ETHBTC broke out of a multi-year bearish trend on the weekly chart; a significant structural shift.
On the daily chart, ETHBTC is gaining strength from a key Volume Level Zone, while BTC.D creeps higher. This divergence is critical:
If ETHBTC holds while BTC.D rises, we could be setting up for a massive ETHUSDT expansion, followed by strong moves in L1s and L2s.
ETHBTC must hold above 0.03749 to maintain this momentum. As Bitcoin cools off, ETH could lead the next phase of the cycle.
TradFi Correlation
In traditional markets, the U.S. Dollar Index (DXY) is often viewed as a risk-off indicator, when the dollar strengthens, risk assets like crypto, equities, and commodities tend to suffer.
At the moment, the DXY is showing signs of strength on the weekly chart, forming a solid base after multiple rejections from its previous structural lower low. If this structure holds, we could see a move toward 100.54, a key level that aligns with a potential short-term pullback across crypto markets. A break and sustained move above that level would shift the daily DXY structure to bullish, signaling increased demand for dollar safety. Historically, this tends to put downward pressure on risk assets, as investors rotate out of speculative positions.
This price action isn’t happening in a vacuum. Here’s what’s adding fuel to the fire:
📈 U.S. Treasury Yields are rising again as markets price in “higher for longer” rates. This strengthens the dollar and drains liquidity from risk assets.
📊 CPI and employment data are keeping the Fed cautious, which delays any meaningful pivot or rate cuts, even as parts of the economy show signs of slowing.
🧠 Global liquidity conditions are tightening, especially with ongoing geopolitical tensions and lower than expected growth in major economies like China and the EU.
🏦 Institutional capital is cautious; inflows into crypto ETFs have slowed, and hedge funds are increasing USD exposure as a hedge.

BTC.D - Signaling Third Altseason BTCdominance is beginning to break down suggesting BTC has reached a peak or is nearing and movement will be favored for alts.
My target for BTCD is 50% as price along this MA line has seen strong confluence
lets go alts!

Bitcoin Dominance Bouncing as in 2020Bitcoin Dominance has bounced at the same level where it did during the 2020 bull market, right before the 2021 Alt Season.
The yellow line marks my first target.
Another thing worth of mention is the giant triangular pattern currently forming.