GOOD NEWS FOR #ALTS MARKETGood News for #Alts Market! 💥
Take a look at the precision on my last #BTC.D (Bitcoin Dominance) outlook 👇
🔹 Dominance just hit my 57% key support – exactly as predicted! 🔥
🔹 Called the local top around 65% weeks ago – accuracy on point!
What’s next?
📊 If #Bitcoin dominance consolidates above the important 56-57% zone, we could see major liquidities flow into many #alts , especially those building bullish structures on higher timeframes (think: [ NASDAQ:OP , $LQTY , NYSE:SEI , etc…]).
As long as BTC holds its ground without a sharp correction, overall market confidence remains solid and alts have room to outperform! 📈
Another #Alts rally could ignite any day now, on large/Medium Mcap assets, especially if CRYPTOCAP:BTC stays resilient and holds the $110,000–$107,000 supports📈
👉 Stay sharp; the next rotation could be huge.
Which alts are you eyeing the most? Drop your picks below! 👇
Bitcoindominance

Others.d 4H Analysis - key Triggers Ahead👋🏻 Hey everyone! How’s it going? Hope you’re all doing well.
❄️ Welcome to Crypto Winter.
⏰ Today, we’ll be analyzing Others.d and exploring its potential opportunities.
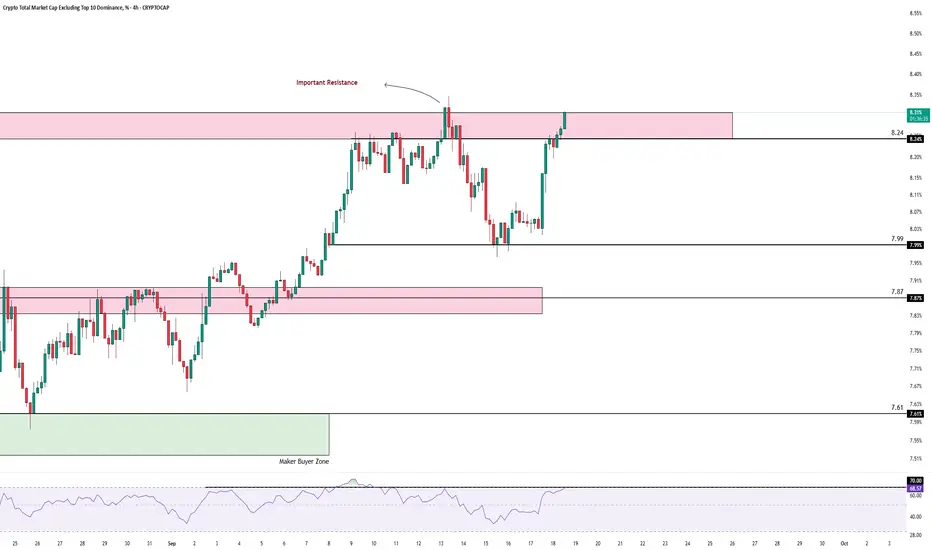
👀 On the 4H timeframe, looking at the Others.D index, we can see that this index moves inversely to Bitcoin dominance (BTC.D) and Tether dominance (USDT.D). It reflects the capital flow into altcoins (excluding BTC and ETH). Currently, it has been consolidating inside a tight box structure. After breaking above the seller’s trigger zone — the top of the box — at 7.87%, it moved upward but got rejected at the 8.3% resistance.
💡 After the rejection, it formed a higher low compared to the previous one, showing respect from buyers. Momentum then picked up quickly, pushing the price back toward the 8.3% resistance with fewer green candles but stronger momentum. We are now retesting this resistance, and a confirmed breakout here could serve as a first small confirmation for a potential altcoin bull run.
🧮 Looking at the RSI oscillator, one critical level stands out: the 70 overbought zone. Considering the recent positive economic data, which fueled capital inflows into equities, this level gains even more weight. It may provide further support for Others.D cap to push higher.
🕯 After breaking out of the box, candle size and volume looked normal, but at the formation of the higher low, buyers strongly respected that level — suddenly the candle size increased sharply, showing FOMO from buyers and fresh capital entering risk assets.
🧠 We now have multiple confirmations for a possible breakout and stabilization above this resistance. If it happens, several altcoins with strong setups should be on the watchlist for entries. A clean breakout could also provide the green light to open long-term futures positions on altcoins, as a stronger rally may follow.
❤️ Disclaimer : This analysis is purely based on my personal opinion and I only trade if the stated triggers are activated .
BTCD Enjoy Short Term Relief In ALTS#BTCD Enjoy Short Term Relief In ALTS
Until BTCD reaches 4280, opening any long position in any altcoin will only be a losing decision.
BTCD is going to test support at 3732, so until then, there will be a short-term pump in altcoins.
*Namaste*

$BTC.D Head and Shoulders Topple to 42%If I were a betting man, this is what the future holds for ₿itcoin Dominance.
A head and shoulders pattern could very well be the eventual topple for CRYPTOCAP:BTC.D as we see it make it's way down to 42% which follows previous cycle's trend.
the RSI shows room for correction back up for one more push.
the 20WMA bearish crossing below the 50WMA will be the nail in the coffin.

Bitcoin Dominance at Channel Resistance –Will Altcoins Take Off?BTC Dominance has been moving inside a clear descending channel, and right now, price is testing the upper boundary (channel resistance).
Here’s what the price action is telling us:
🔸 If dominance rejects this level and fails to break out, we could see a pullback toward the lower channel, which usually signals money rotating into altcoins → potential altseason setup.
🔸 But if BTC.D manages to break and close above the channel, it may confirm a shift in capital back into Bitcoin, putting pressure on altcoins.
📍 This zone is a make-or-break level, and the reaction here could dictate the short-term market structure for the entire crypto market.

Bitcoin Dominance Continue Dropping, Dec. 2024 Support HoldsThe uptrend ended the 23-June 2025 week. On this date, the index at hand started to decline; Bitcoin Dominance (BTC.D) turned bearish.
Notice how many altcoins bottomed in April, the majority, and yet BTC.D did not peak until June. A delayed effect.
The downtrend is now on and undeniable; the altcoins bull market is now on and undeniable.
The downtrend is unraveling but far from being done. Bearish momentum is building up but we have not seen the true potential of the altcoins market. As Bitcoin Dominance moves down, the altcoins market moves up.
In July BTC.D took a pause, two green weeks. It closed green and the third week we saw the resumption of the bearish move and trend.
In August, late August, now, BTC.D is taking another pause, about to close one week green. This should not be taken as the end of the altcoins bull market, not at all. The market is only becoming stronger to produce even higher, bigger and better growth.
The low from November-December 2024 (54.56%) is still intact as support. Cryptocurrency market prices are going much higher this time around; the cycle will be much longer, this support is sure to break based on TA, with the index moving much lower.
Back in late 2024 the bullish wave for the altcoins lasted exactly 1 month. After this major rise, we had a decline lasting many months.
Things are different now. BTC.D has been going down for weeks, 10 weeks but the index is still trading pretty high and that's my main point. There is still plenty of room for this index to drop.
Sell when prices are up. Bearish potential develops after a major uptrend; out of a top. This top is present here and from here down-we go. The index again, of course; Crypto is going up.
Namaste.
Bitcoin Dominance Continues To Drop (Bullish Crypto)While Bitcoin Dominance (BTC.D) continues to drop, the altcoins continue to consolidate, to recover. Not all of them are up and to be honest, most of them are down, and this is good news.
Even after all this time and all we've seen and waited, still, there are many opportunities available; meaning, it is still early in this bull market bullish cycle and wave. There is still time to buy at low prices. But...
There is a "but." Many pairs are no longer great to buy. Some examples are the obvious ETHUSDT, BTCUSDT and those trading high up. Don't get me wrong, these pairs can be traded all of the time, over and over, again and again, but, the best prices possible are no more and this will increase the complexity of our new entries and how much money we can make. Risk also becomes higher. No worries though, when one door closes, seven hundred new doors open. Opportunities are endless in this market.
Bitcoin Dominance Index bearish bias remains intact, in fact, it continues to strengthen. This means that Bitcoin will continue to grow and the altcoins as well. Truly, this is all we need. We already have more than enough signals, but one more can't hurt.
Bring the bullish storm. Crypto will change your life for the better, if not now, in the future.
Thank you for reading.
Namaste.

Bullish Now, Bitcoin & The Altcoins · 2025 Bull Market ContinuesThe altcoins market cannot be bearish at the same time that Bitcoin Dominance (BTC.D) is bearish. When Bitcoin Dominance is bearish the altcoins market is bullish. When the altcoins market is bullish Bitcoin is already growing or set to grow.
Here we have the daily chart for Bitcoin Dominance. Here we have a full break of support. The bearish bias only continues to strengthen and is supported by really high volume. As Bitcoin Dominance moves lower, the altcoins move higher.
You can see a huge rounded top pattern as well as a very strong decline started late June. Notice that the strongest decline before this June was November 2024. November 2024 was when the entire altcoins market produced a strong advance. This was the first signal and also the bottom for many altcoins (ALTS vs BTC pairs). Things are changing.
The dynamics we are about to experience between Bitcoin and the altcoins market is something not seen ever before. The market evolved for years, is evolving and continues to evolve and this evolution will be reflected in market price action and the charts. The charts will be different and how the altcoins behave in relation to Bitcoin and each other. The market will continue to become harder to read, predict and understand. It is just natural. We human becomes more mentally complex as we become older, it is the same system.
A bearish bias on this index confirms the continuation of the bullish wave for the altcoins. This is all you need to know. You need to know that Bitcoin and the altcoins market will continue to grow. Not months into the future, not years into the future, short-term. We are going up now.
Thank you for reading.
Namaste.

Bitcoin Dominance Elliott Wave Update: Wave ⑤ Near CompletionBTC Dominance has been unfolding in a clear 5-wave impulsive decline. Right now, price action is moving within the last leg — wave ⑤ — and has reached the 57.9% zone, which aligns with multiple confluences:
• ✅ 0.618 Fibonacci extension of wave (3)
• ✅ Bottom of the descending channel
• ✅ Strong psychological & structural support zone
This confluence suggests that wave ⑤ could be approaching its final stage of completion.
📌 Implication for Altcoins:
A local bottom in BTC dominance often translates into increased selling pressure on altcoins, as money flows back toward Bitcoin.
🎯 Key Levels to Watch:
• 57.9% → potential termination zone for wave ⑤
• 56.6% → full 1.0 extension of wave (3), deeper bearish scenario
⚠️ Invalidation:
If dominance breaks convincingly below 56.6%, the bearish extension continues, giving altcoins more room to breathe.
👉 For now, caution is advised on altcoins as BTC dominance nears completion of wave ⑤. Expect volatility and potential liquidity grabs.

Bitcoin Dominance (BTCDOM) Headed Toward MA200 @2277Here we have Bitcoin Dominance (BTCDOM) but this time through the perpetual futures contract on Binance, weekly timeframe.
The bearish bias is fully confirmed—already a developing phenomena—it has been happening for months.
A little more than two months ago, on the 16-June week, BTCDOM peaked and started dropping. The break of the uptrend was confirmed with four consecutive weeks BTCDOM closing red. The action went below our short-term moving averages and also below a strong Fib. retracement level.
The last two weeks closed red. This is the third week and while it is green, most of the space won has been lost. The current candle is a bearish hammer, a continuation of the previous two and of the broader bearish move.
While BTCDOM was rising for years volume was dropping for years. This volume divergence supports the structure breakdown we are seeing now. The next support is found around MA200, black line on the chart. This indicator has a reading of 2277. MA200 falls between 0.618 and 0.786 Fib retracement.
As Bitcoin Dominance moves down (BTCDOM), Bitcoin (BTCUSD) and the altcoins (TOTAL) grow.
Namaste.

ETHBTC vs BTC.DEthereum / Bitcoin 📈 Bitcoin Dominance 📉
CRYPTOCAP:ETH / CRYPTOCAP:BTC vs. CRYPTOCAP:BTC.D

CRYPTO: BTC.D (1W)Currently, we are at a crucial point where the price is playing at the trendline. Once we see a breakout + retest, this is our time to shine! We can see BTC.D hitting targets from 47.06% to 43.68% On the other hand, if the price bounces on the trendline, it may reach to 69% to 73.59%.
I am leaning towards the breakout + retest as of the moment since it is showing clear signs that we are going to see a bull run in the coming months.

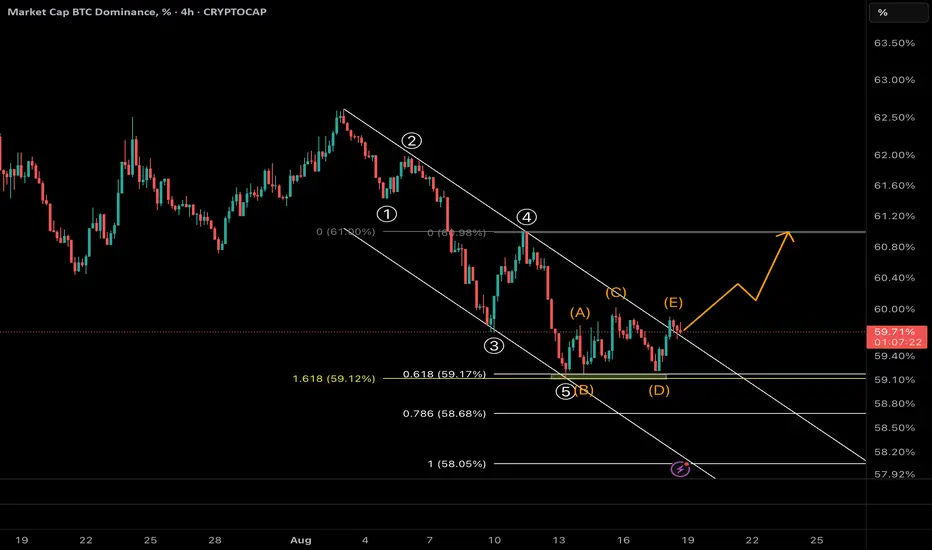
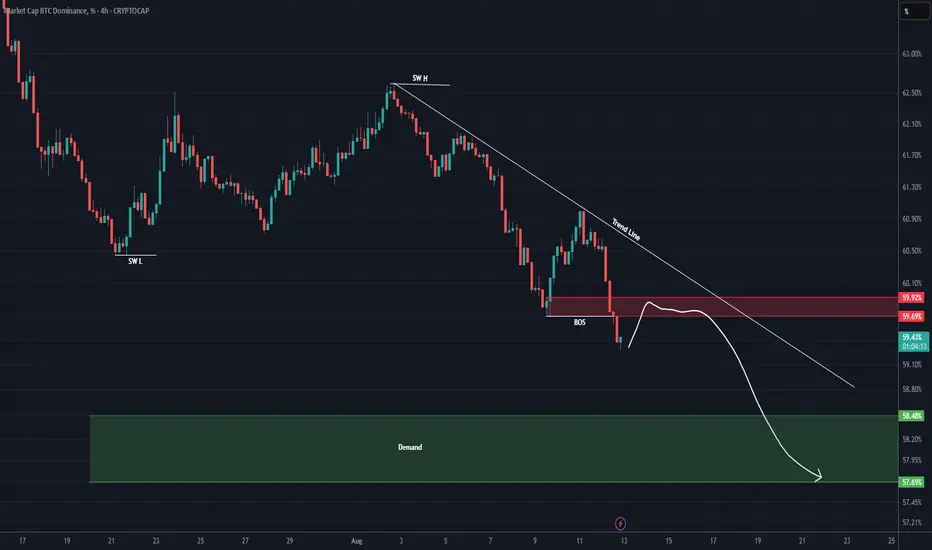
Bitcoin Dominance Breaks Out: Altcoins in Danger?🔎 BTC Dominance (BTC.D) – 4H Analysis
• The 5-wave decline has completed right at the 1.618 Fibonacci extension (59.1%), confirming a potential bottom.
• A contracting triangle (A–B–C–D–E) has formed and just broke to the upside, coinciding with the breakout of the descending channel.
⸻
📈 Main Scenario
• With this breakout, BTC dominance is entering a new bullish phase.
• Next targets:
• 60.8% – 61.0% (key Fibonacci resistance + channel top)
• If broken, possible extension to 61.4% – 62.0%
⸻
⚠️ Implications for Altcoins
• Rising BTC dominance usually means capital is rotating into Bitcoin → leading to heavy sell-offs in altcoins.
• Alt traders should be cautious: this move can trigger a broad correction across the altcoin market.
⸻
📉 Alternative Scenario
• If BTC.D falls back below 59.3%, the breakout may turn into a fakeout, and a retest of lower levels could follow.
⸻
✅ Conclusion:
The breakout above the descending channel is a strong signal of trend reversal. As long as BTC.D stays above 59.3%, the path toward 61%+ is favored. This could mark the beginning of a tough phase for altcoins.
Bitcoin Dominance Below 60% & Below SupportBTCD just lost the 0.236 Fib. retracement support, the next level to be tested immediately is 55.64 followed by 52.44 followed by 49.23. All these are high probability targets.
The week closes today and is red. The chart drawings, patterns and signals are bearish; bearish confirmed, pointing lower and support additional bearish action. Everything points down for this index and the volume is just too strong. The downtrend is on.
The drop is about to intensify next week. Last week was the continuation and this week the confirmation. Now we will experience the meat of the current move. This is when bearish momentum intensifies.
Thinking of the inverse relation between Bitcoin Dominance Index (BTC.D) and Bitcoin (BTCUSD) and the altcoins, this means that the 2025 bull market is about to speed up. We are about to see a massive influx of capital into the market and a large amount of bullish momentum.
Remember, Bitcoin will also grow.
Bitcoin and the altcoins market is going up.
Ethereum will continue growing.
Be prepared, no more red.
(As Bitcoin Dominance goes down, Crypto goes up.)
Namaste.
BTC DOMINANCE New Analysis (4H)Bitcoin dominance is in a bearish trend. After a pullback to the red-marked area, it is expected to drop further, potentially reaching the green-marked zone.
This means that in lower timeframes, money in the crypto market can still flow from Bitcoin dominance into altcoins.
Let’s see how this plays out.
For risk management, please don't forget stop loss and capital management
When we reach the first target, save some profit and then change the stop to entry
Comment if you have any questions
Thank You
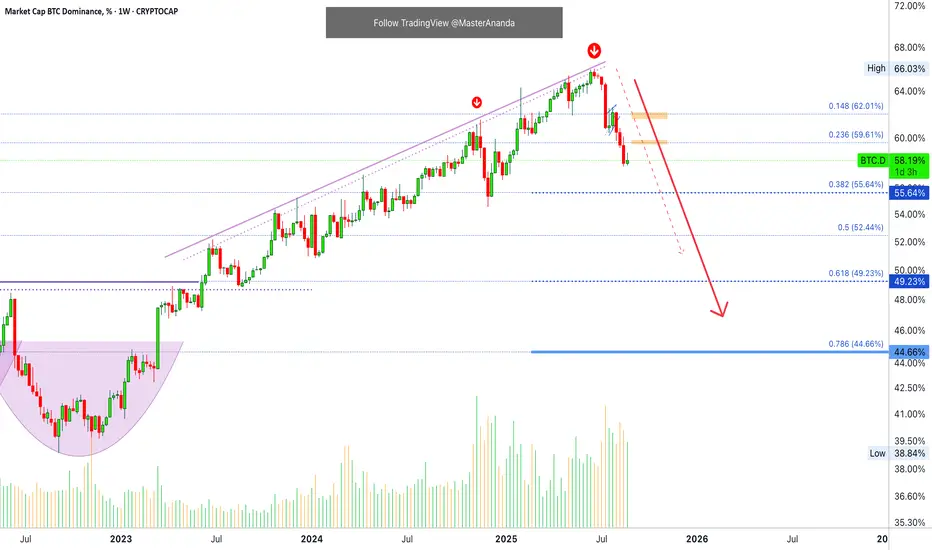
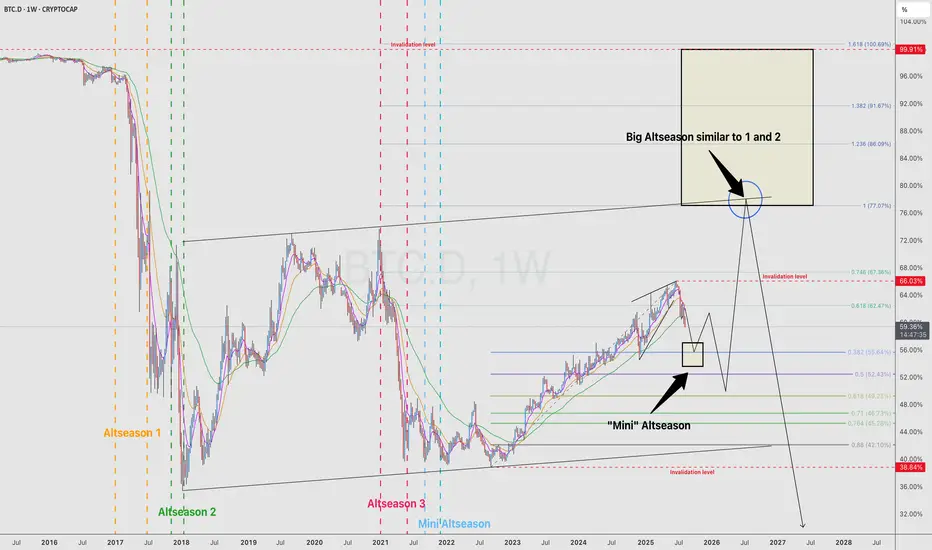
BTC.D, expected roadmap!Hi fellow traders,
On this chart I’m analyzing the Bitcoin Dominance (BTC.D) on the weekly timeframe using Elliott Wave principles.
Looking at the structure, I expect a major corrective phase to unfold in the coming years. Historically, we have seen two big Altseasons (1 and 2), followed by smaller rallies. My projection suggests we could first experience a “Mini-Altseason” when BTC.D enters the lower golden box, before heading higher again.
This move up could then create the conditions for a much larger Altseason, similar in magnitude to the previous major ones, once BTC.D reaches the higher golden box zone.
Mini Altseason: Potential short-term relief for alts as dominance corrects lower into the first golden box.
Big Altseason: A larger, more powerful move, expected after BTC.D completes a strong retracement into the upper golden box region.
The invalidation levels are clearly marked, and as long as the structure remains intact, I expect BTC.D to respect these Fibonacci-based zones and follow this corrective path.
This analysis indicates that while we may see a temporary bounce in BTC.D the long-term outlook still favors another significant Altseason ahead.
Good luck and trade safe!
Bitcoin Dominance and DXY pattern correlation!Is the bitcoin dominance correlated to the DXY?
So far... I think so. Chart pattern wise anyway.
So, according to the DXY, if the Dominance follows this pattern we should be in the biggest altseason to date. But it could be the last one for a while as there could be a 90% to 95% flush out of alts coming.
This would crush all altcoin belief and get rid of all the shit coins. Lets be honest at this point it's needed to flush out all this garbage, it's too much.
Then knew cycle would start over and follow with a massive altseason bigger than anything ever. Don't get excited just yet, it not happen until 2033 or later.
Also according to this chart, dominace can go a bit higher to 72% before it starts to fall. lets see
That's all I have here, I just wanted to put it out here. If you want more analysis on this I have put out a comprehensive video on my tictik and youtube page.
Remember, this is not financial advice.
Kind regards,
Demetrios

BTC DOMINANCE UPDATE- So, all elements are annotated throughout the graphic, like always.
- Timeline.
- Older Top Dom (2021) (red doted line).
- New Top Dom (2025) (red line).
- Some supports ( Orange Line ).
- Some Bottoms ( Green Lines ).
- Most important in chart : Fibonnacci Retracements.
- After this chart, I’ll drop links to my older BTC dominance posts.
- Not much to say, just look at the chart :
- In 2021, BTC.D formed a double top because Bitcoin spiked twice and hit two all-time highs.
- That doesn’t mean BTC.D will behave the same way in 2025. I don't expect another double top, but who knows.
- We could see a retracement down to the 45–47% range. That would likely signal the start of a new bear market.
- For now, i don’t see the end of the bull run yet. I’m mostly waiting for a strong BTC push in price, a fast dip in BTC Dominance, and the kickoff of Altseason.
— it’s going to be wild and fast! Just my personal opinion.
Stay Safe !
Happy Tr4Ding !

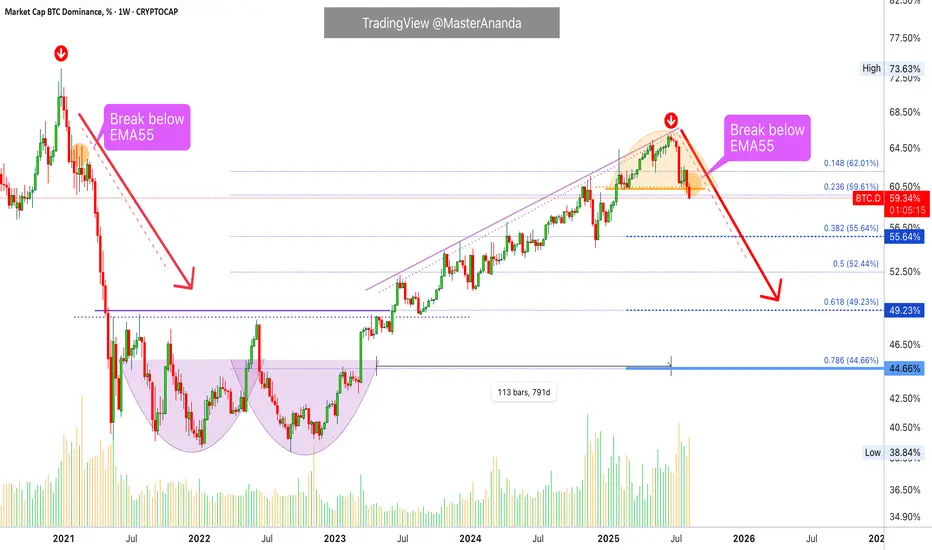
Bitcoin Dominance · Bitcoin Hits $1,000,000, ETH $200K Bitcoin Dominance is displaying the lowest reading in 8 months, since January 2025.
Bitcoin Dominance is in the worst condition possible in 4 full years. The Bitcoin Dominance Index chart predicts a major bullish cycle across Crypto; Bitcoin and the altcoins market.
Good evening my fellow Cryptocurrency trader, I hope you are having a wonderful day.
This week we have a bearish continuation on BTC.D, which also works as bearish confirmation which reinforces the bearish continuation. The altcoins are already going up, it has been happening for months.
The market has been rising for months; Bitcoin has been rising for years but this isn't all. Seeing BTC.D here we know the bigger portion of the current trend is still to unravel.
The rounded top, a bearish reversal signal, is complete and the neckline, the main pattern support, has been broken. Trading volume continues to be high and the bearish bias strong.
There is more. It is the first time Bitcoin Dominance breaks below EMA55 weekly since June 2022. Coming from a high point, this event happened January 2021, the start of the previous bull market. The same signal again now means the start of the current bull market.
It is already happening, it is already confirmed.
It was the same back in 2021. In January/February 2021 it was already happening and it was already confirmed that Crypto was having a major bull market. Bitcoin was already trading near its previous all-time high. Market conditions are the same. Bitcoin is about to grow 20%. While Bitcoin grows this much, the altcoins will grow between 300 and 600%. Then Bitcoin will take a pause and the altcoins will continue to grow. Ether is likely to go beyond 10K.
Crypto is going up. This is the best possible ever. Your life can forever change.
Take a minute to think.
Stop for a moment. Engage your mind and visualize... What type of results can you produce?
What would you do if you knew with a high level of certainty that Crypto is going up? How would you take advantage of this information? What type of actions are you taking now to maximize profits in this bullish wave?
It is not about being bearish or bullish, it is about adapting to what is happening. Crypto is going up; Are you in or are you out?
Namaste.

Bitcoin Dominance Hits Channel Floor – Altcoin Storm Incoming?Bitcoin dominance has been sliding within a well-structured descending channel since early August. Now, it’s touching the channel’s lower boundary — a level that has previously sparked strong reversals.
A bounce from here could ignite a short-term uptrend in BTC dominance, targeting the channel’s midline and possibly its upper boundary.
If this happens, capital is likely to rotate back into Bitcoin, applying pressure on altcoins and triggering a corrective phase in the broader altcoin market.
Key Takeaway: Watch for bullish price action at the channel’s floor. A confirmed breakout in dominance could mark the start of an “altcoin cooldown” phase.

Bitcoin Dominance · Downtrend Continues (Bullish Bitcoin)The uptrend ended 27-July 2025 with the highest reading on BTC.D since January 2021. Back in January 2021 BTC.D was also bearish, dropping, and this bearish period in this index matched the strongest bullish action ever, the 2021 bull market.
Now, the bearish phase on BTC.D is intensifying. I am bullish on Bitcoin and the altcoins market.
Bitcoin Dominance being bearish does not mean Bitcoin is bearish, it means the altcoins are rising. When the altcoins are rising, Bitcoin is already high and will continue rising.
Two days closed green on BTC.D and today back red. A few days green, many days red. A new low each time, lower low. A lower high shows up each time... This is only the start.
A reading of 60% is nothing to be proud of if you are a bear. The truth is that Bitcoin Dominance being at 60% simply means that the altcoins market has still plenty of room for growth. For example, Ethereum can hit $11,111 and Bitcoin $200,000+. Targets need to be updated because we will have an extraordinary bull market.
» Many pairs have been growing for months, since April.
» Other pairs have been sideways for months, since April.
» While still others continued lower.
Soon, the entire market will move in one rhythm, one flow. And this flow is an up-wave. Rising prices for the long haul. The best scenario possible if you love Crypto. The strongest bullish cycle since 2021. Possibly the strongest ever.
Prepare for higher prices.
» Bitcoin Dominance (BTC.D) is going down.
» Bitcoin and the altcoins are going up.
Namaste.

BTC.D , Bitcoin Dominance Ready to RiseAfter a descending wedge pattern, Bitcoin Dominance has shown the first signs of an upward move. A CHoCH (Change of Character) has formed on the 4-hour timeframe, signaling a potential trend reversal.
We are now awaiting a retest of the broken resistance level before continuation of the bullish trend. However, the price might skip the retest and proceed directly higher.
Stay tuned for confirmation and manage your positions accordingly.

BTCD Bear Market Confirmed · Altcoins Bull Market ConfirmedThis is a rising wedge pattern and it broke for the first time after 792 days. We are looking at Bitcoin Dominance (BTC.D) on the monthly timeframe, super long-term.
A classic long-term double-bottom in 2022 launched a massive uptrend. This uptrend developed within a perfect rising wedge. Last month BTC.D broke this pattern with a full red candle and the highest volume since November 2024.
To add some perspective, the highest volume months were last month (red) and November 2024 (red). The highest volume before these two only happened during the climax of the 2021 bull market, so you can have an idea how strong the volume is this time around.
Since Bitcoin Dominance has an inverse relation with the growth in prices of the Cryptocurrency an Altcoins market, when Bitcoin Dominance was ultra bearish and crashing down, 2021, the Cryptocurrency market was ultra bullish and moving up. Seeing this major long-term signal, the highest bearish volume month to break a 792 days long uptrend, reveals the start of another major crash on this index. The major crash on this index is the confirmation of the late 2025 altcoins bull market.
Bitcoin and the altcoins market will continue growing on all terms.
Thanks a lot for your continued support.
If you agree, leave a comment.
Namaste.
