Bitcoin Drops as Trade War & Geopolitical Risks EscalateBitcoin( BINANCE:BTCUSDT ), as I expected in the previous idea , has moved as anticipated and reached its first target (full target).
Currently, after a fake breakout above the resistance zone($94,970-$92,910), Bitcoin has fallen back below it, and this decline has come with strong momentum.
The reasons behind Bitcoin’s recent drop include concerns about a trade war between the U.S. and Europe, particularly threats from Trump imposing new tariffs on Europe over Greenland. Another factor is the potential escalation of tensions in the Middle East, which can make investors more cautious about high-risk assets.
Additionally, the recent global market declines, including the drop in indices like the S&P 500 index( FX:SPX500 ), which I had predicted , have also contributed to the bearish sentiment.
Furthermore, delays in the passing of the CLARITY Act in the U.S. and Coinbase’s withdrawal of support have added a negative sentiment to the crypto market.
From an Elliott Wave perspective, it seems that Bitcoin is currently completing wave 4, and we should expect a potential move toward the support lines. There is also a possibility that wave 5 may be truncated due to the strong momentum of wave 3.
I expect Bitcoin to decline from the Potential Reversal Zone(PRZ) and move toward the support lines.
Cumulative Long Liquidation Leverage: $91,720-$91,200
Cumulative Long Liquidation Leverage: $89,920-$88,760
Cumulative Short Liquidation Leverage: $96,340,125-$96,020
Cumulative Short Liquidation Leverage: $94,360-$93,300
First Target: Support lines
Second Target: $91,833
Third Target: Potential Reversal Zone(PRZ)
Stop Loss(SL): $94,433(Worst)
CME gap: $88,720-$88,120
What’s your view on Bitcoin?
💡 Please respect each other's opinions and express agreement or disagreement politely.
📌Bitcoin Analysis (BTCUSDT), 1-hour time frame.
🛑 Always set a Stop Loss(SL) for every position you open.
✅ This is just my idea; I’d love to see your thoughts too!
🔥 If you find it helpful, please BOOST this post and share it with your friends.
Bitcoinidea

Bitcoin - This chart is not bullish yet!🎲Bitcoin ( CRYPTO:BTCUSD ) still remains beairsh:
🔎Analysis summary:
Bitcoin remains in an underlying bullish market. But looking at all the recent retests of resistance, it becomes quite likely that this is not the end of the bearmarket yet. Bitcoin will most likely create another move of -35% first in the next couple of weeks.
📝Levels to watch:
$65,000
SwingTraderPhil
SwingTrading.Simplified. | Investing.Simplified. | #LONGTERMVISION

BITCOIN: As Expected Price Is Dropping, Waiting To Come at 60K?Dear Traders,
As anticipated, the price is reversing from $98,000 and may experience a significant drop towards $60,000. The $60,000 area remains strong and attracts swing buyers. Our recommendation is to wait for the price to break through this trading range pattern. A strong breakthrough would indicate a clear price pattern.
If you like our idea, please like and comment for more.
Team SetupsFX_

BTC/USDT Analysis. Sellers Remain in Control
Hello everyone! This is CryptoRobotics trader-analyst, and here is the daily market update.
Today, the scenario outlined in yesterday’s weekly analysis has started to unfold. After testing the mirrored resistance zone at $93,200–$94,400, buyers failed to maintain control. Selling pressure intensified, leading to a decline and a full fill of the buyer zone at $92,000–$90,400 (accumulated volumes).
Although a reaction was observed from this area, the current volume distribution suggests continued downside potential, with a likely retest of the key technical level at $90,160.
If the current local low holds, an intraday corrective move toward the newly formed sell zone at $92,600–$93,500 (volume anomalies) is possible. Until a clear reversal setup appears, we continue to expect renewed selling pressure from this area.
Buy Zones
$92,000–$90,400 — accumulated volumes
$88,400–$87,000 — accumulated volumes
$86,000–$84,800 — anomalous activity
$84,000–$82,000 — strong volume anomalies
Sell Zones
$92,600–$93,500 — volume anomalies
$96,000–$97,500 — selling pressure
$101,000–$104,000 — accumulated volumes
This publication is not financial advice.

BTC/USDT Long Signal (Spot or Futures)Entry Zone: Buy on rejection/confirmation of support around $90,000 – $90,500 (ideally near the lower gray zone ~$90,074 or wick rejection + bullish candle close above it).
Trigger: Look for price rejection here (e.g., hammer/doji/wick rejection from lows, volume spike on bounce, or reclaim of the blue trendline/support line). If it breaks down hard below ~$90,000 with conviction, avoid or wait for lower retest.
Stop Loss: Below major support invalidation ~$89,500 – $89,800 (to account for wicks, place ~1-2% below the zone).
Take Profit Targets: TP1: $92,199 – $92,500 (first resistance, partial profit ~50%)
TP2: $92,713 – $93,000 (next gray resistance area)
TP3: $94,000 – $94,967 (higher target if momentum builds, blue arrow projection area)
Stretch: $96,000+ if breakout continues (previous highs).
Risk/Reward: Aim for 1:2+ (e.g., ~1% risk for 2-4%+ reward on initial targets).
Timeframe: 4h confirmation preferred, watch for daily close above support to strengthen the case.
Invalidation: Strong close below $89,800–$90,000 shifts bias bearish (potential lower test toward $88k or beyond).
This aligns with the major horizontal support zone visible on your chart (gray box from mid-December/early Jan), recent pullback respecting it, and the overall bullish structure with higher lows.Use proper position sizing, watch for volume/news (e.g., macro events), and monitor for fakeouts.Not financial advice — Trading crypto is highly volatile and risky. This is just an interpretation of the shared chart for educational/discussion purposes. Do your own research (DYOR), manage risk, and never trade with money you can't afford to lose. Past performance isn't indicative of future results. #Bitcoin #BTC #CryptoTrading #BTCUSD #TradingView #Crypto #BitcoinSupport #LongBTC #NotFinancialAdvice

Bitcoin is looking primed for a full recovery. Loving this setup on Bitcoin. There are strong similarities between the SPX and Bitcoin. As Bitcoin has matured, it trades more and more like the traditional stock market—or even like gold—as opposed to a penny stock like in its early days. I see a full recovery coming, very similar to the crash and recovery that happened on the SPX in 2025.
As always, stay profitable.
– Dalin Anderson

BTC Critical Zone: Reclaim $90k or Liquidation Cascade to $86k?Bitcoin is currently testing a pivotal region after losing the local ascending parallel channel and the 1-month support trendline. The recent drop to $89,800 has shifted the immediate market structure to bearish, leaving bulls in a precarious position.
Technical Analysis & Market Context We are currently sitting at a "make or break" decision point. The market has lost over 6% during off-hours, creating an imbalance that often leads to a volatility squeeze.
The Bearish Case: If BTC fails to reclaim the $90,000 psychological level, we risk a "Long Squeeze." Liquidation heatmaps suggest a dense cluster of long stops between $88k and $86k. A rejection here could trigger a cascade of sell orders, flushing price down to fill these lower levels.
The Bullish Reclamation: However, an immediate retest of the breakdown level is likely. There is a significant Short Liquidation cluster between $93,366 - $94,600. Smart money may push price back up to grab this liquidity before deciding on the next major trend.
Trade Setup (Long Scalp/Reversal) We are looking for a reclaim of support to catch the move toward the upper liquidity cluster.
Entry: $90,000 (Wait for a 15m/1H candle close above this level to confirm strength)
First Target: $92,600 (Local resistance)
Second Target: $94,400 (Upper liquidity grab)
Stop Loss: $89,200 (Invalidation if we accept back into the lower range)
Key Driver: Watch the 4H volume. A low-volume rise to $90k suggests a "dead cat bounce" and likely rejection, while a high-volume reclaim validates the targets above.
Disclaimer: This analysis is for educational purposes only and does not constitute financial advice. Please manage your risk carefully.
More details about market analysis
x.com/BitcoinDailyTrd/status/2013586802309767424

Bitcoin has reached the 98,000 levelBitcoin has reached the 98,000 level, which we identified in our previous analysis as a key resistance zone. The price has now bounced off this level, and we are at a critical decision point. Based on the Elliott Wave structure, Bitcoin could be forming an ABC correction pattern after completing its impulsive move higher.
There are now two possible scenarios from this level. In the first scenario, Bitcoin could continue its downtrend from here and move towards the lower support zones around 53,000-60,000, completing the C wave of the correction. In the second scenario, Bitcoin might test the 111,000 level one more time as a B wave correction before continuing the downtrend towards the C wave target.
The current price action at 98,000 is crucial because it was a level we specifically identified in our previous analysis. The fact that Bitcoin has reacted to this level confirms the validity of the analysis. We need to watch carefully whether the price breaks down from here or attempts another move higher to test 111,000. Proper risk management is essential at this decision point.

BTC Macro Roadmap: The $110k Institutional Supply ZoneAnalysis: I am currently monitoring the $109k–$116k region as a primary Point of Interest (POI). This zone represents a high-confluence cluster:
Daily Order Block: A clear area of institutional distribution.
Price Imbalance: A Daily Fair Value Gap (FVG) that needs to be filled.
Volume POC: My Anchored Volume Profile shows the heaviest trading volume (Blue POC line) sitting right at $110k.
The Strategy: I am looking to play the current bullish momentum up into this zone (monitoring the 4hr structure). However, upon arrival at $110k, I am shifting to a bearish bias.
Trigger: I will wait for a Lower Timeframe (15-30min) Break of Structure (BOS) to confirm the reversal from said zone above (109-116k)
Target: A rejection here could lead to a deep retracement back toward the $85k–$88k (CYL) support zone.
Disclaimer: Not financial advice (NFA). For educational purposes only. Crypto trading involves significant risk; always manage your risk and wait for confirmation. DYOR.

BTC BullishBTCUSD is cooling off after a sharp push into the $97,800–$98,000 area, where a short-term double top and a 1H market structure shift flipped momentum bearish. Even so, the bigger picture still leans constructive: 4H and 1D structure remains in an uptrend, and this pullback looks more like digestion than a trend break—so long as key support holds.
The immediate line in the sand is $95,020. Bulls want to see price defend this area and then close back above $96,650 to neutralize the 1H weakness. If that reclaim sticks, the next objectives are $97,500 first, then a higher retest toward $99,500 as the trend attempts to reassert itself.
If $95,020 fails and we get a 60 close < $95,000, the squeeze risks releasing lower, opening $94,000 as the next waypoint and potentially $92,500 if selling accelerates.

Building a Bitcoin MONSTER Trade | Here's My Trade Plan We’re continuing our BTC Bitcoin Monster Trade 🚀📈, building on existing positions and getting ready for Bitcoin’s next potential move 🔍💰.
In this video, we break down the Monster Trade strategy, exploring its benefits and how it could be a life-changing opportunity when you catch a higher time frame trend reversal with an extended target 🧠⚡.
We cover price action, market structure, and the multiple trade strategy, plus risk management techniques and the rules of engagement for opening your next position 🛡️📊.
Not financial advice.

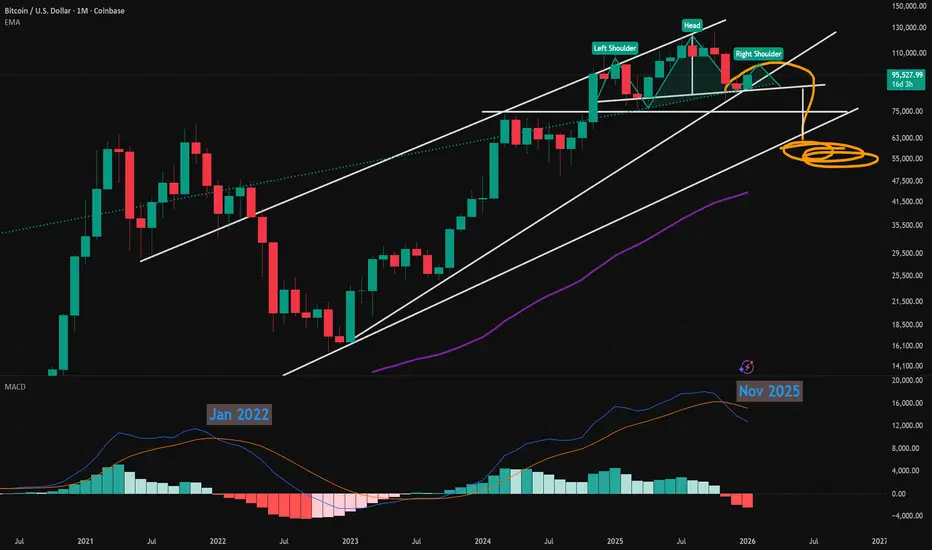
Bitcoin Macro Head & Shoulders - Right Shoulder Then DropIn similar fashion to the 2021 H&S that preceded the BEAR Market...
Bitcoin is now forming the Right Shoulder of a new Head & Shoulders pattern as we can see in this Monthly chart.
Also in this chart down below, the monthly MACD has crossed over and into Bearish territory, just like we used to confirm the last market cycle cop in January 2021.
On the daily chart, Bitcoin has been forming a Bear Flag pattern, so this recent push up to test the $98k - $100k range, is likely the final push, before heading lower.
Using any 'order block detector' you can also see heavy seller pressure (limit orders) there.
So the most likely near-term scenario is for Bitcoin to hang around this zone, while select altcoins rally a bit, then drop down into the Bear Flag channel, and ultimely fail.
The measured move for the Bear Flag is right at $74k-$75k, which is a likely strong support.
Or we could see a deeper drop, based on the measured move from the H&S pattern which is pointing to around $62k which many others are calling for.
Remembering past Bull markets, Bitcoin has retraced 50% which would be $62k from the recent ATH of $126k.
Today also, Coinbase withdrew from the Clarity Act, signalling that may not be signed in 2026.
War Fears, Economic Fears, Credit Fears, Currency Devaluation, and Liquidity issues all point to a recessionary deflationary period before markets likely recover later this year.
ATH is still possible by Q3 / Q4 once regulatory clarity, liquidity, and QE start in earnest.
Should be an interesting year!
BTC/USDT is at a decisive level.The price is trading around the 95.7k–98.4k resistance zone, which will likely determine the next major move.
Next scenarios:
If CRYPTOCAP:BTC breaks and holds above 98.5k on the daily close, continuation is likely toward 104.9k, followed by 115.2k. Momentum structure favours continuation if this level flips to support.
If BTC gets rejected from 98k–99k, expect a pullback toward 92k, with deeper support around 89k before any further upside attempt.
The market is transitioning from recovery to expansion. The next daily close will set the direction.
Invalidation: Break below $90.3k.
DYOR, NFA

Is Our Bitcoin Monster Trade Really Shaping Up? So Far So Good.In the last two videos, we’ve been tracking this potential monster trade 👀📈.
In this video, we take it to the next stage 🔍.
So far, everything is looking solid ✅ — we’re securing profits 💰, however the next level is a bit more delicate ⚠️ as price is now trading into a key resistance zone. A deeper pullback is definitely possible from here.
Either way, here’s a full breakdown of the charts and my current analysis 📊🧠.

BTC/USDT Analysis. Will Resistance Be Broken?
Hello everyone! CryptoRobotics analyst here — this is the daily market analysis.
Yesterday, Bitcoin buyers finally managed to break through the selling zone, which triggered an impulse move toward the upper boundary of the global range and the $94,800 level. Price is currently attempting to consolidate above this area.
At the moment, buyers are holding Bitcoin above $95,000 — this level formed strong initiative (pushing) volumes during the breakout, indicating buyer control.
We expect further upside either from current levels or after a corrective retest of the volume anomaly zone at $94,400–$93,200.
A firm breakdown and consolidation below this zone would invalidate the long scenario and return price back into the range.
Buy Zones
$95,000 — key level
$94,400–$93,200 (volume anomalies)
$88,400–$87,000 (accumulated volumes)
$86,000–$84,800 (abnormal activity)
$84,000–$82,000 (strong volume anomalies)
Sell Zones
$101,000–$104,000 (accumulated volumes)
This publication is not financial advice.

BTCUSD I Potential Accumulation BreakoutWelcome back! Let me know your thoughts in the comments!
** BTCUSD Analysis - Listen to video!
We recommend that you keep this on your watch list and enter when the entry criteria of your strategy is met.
Please support this idea with a LIKE and COMMENT if you find it useful and Click "Follow" on our profile if you'd like these trade ideas delivered straight to your email in the future.
Thanks for your continued support!

Bitcoin Aligns With Bullish Trend Metrics — What’s Next?🚀 BTC/USD — Bitcoin vs Tether | Bullish Profit Pathway (Day/Swing) 📈
Asset: BTCUSD — Bitcoin vs Tether (Realtime live price feed) 📊
✅ Bullish Setup Confirmed
Bullish trend confirmed with Hull Moving Average breakout — structure shift on higher timeframes. Momentum signals showing accumulation near support zones. 🟢
🎯 Trading Plan — Entry (Layer Strategy)
Thief strategy: A layered limit entry style method (multi-limit entries):
✅ Layer 1: ~93,000
✅ Layer 2: ~94,000
✅ Layer 3: ~95,000
➡️ Add additional layers as per your risk profile and real-time order flow.
Why layering? Better average price, less slippage, more control over drawdowns.
📌 Target & Notes
🔹 Primary Target: ~99,000 — key resistance & overbought trap zone 🛑
🔹 Monitor reaction at overhead supply / previous swing highs.
🔹 Lock partial profits into reaction zones — don’t be greedy, protect capital.
🔹 Important: You choose your own TP & RR (risk/reward) depending on your play style.
🛑 Stop Loss
💥 Thief SL Zone: ~92,000
➡️ This is a structural invalidation level for this bullish scenario.
✅ Adjust based on your risk tolerance — your risk, your money.
🔗 Pairs to Watch & Correlations 🔎
📌 ETH/USD (Ethereum) — often correlated with BTC swings — if ETH breaks key structure, BTC bias can extend.
📌 BTC/USDT & BTC/EUR — cross-pairs reveal strength vs USD/dollar index behaviour.
📌 S&P 500 / NASDAQ Indexes — crypto sentiment often mirrors risk asset flows.
📊 Technical Levels / Key Zones
✔ Support Range: 90,000–92,500 — critical accumulation band. 📉
✔ Resistance — watch reactions near 99,000+ and breakout extension zones.
✔ EMAs / MACD / RSI — confirm entry and momentum continuation. 📈
📊 Fundamental & Macro Factors — Real-Time News (London Time)
📰 Inflation & CPI Impact: BTC rallied through ~$92k after U.S. CPI inflation held lower, sparking renewed Fed rate-cut expectations — supportive for risk assets like Bitcoin.
📰 Safe-Haven Demand: Softer US inflation + geopolitical tensions are boosting Bitcoin demand near $95k.
📰 Institutional Demand: ETF inflows & broader institutional traction continue to underpin structural support.
📌 Upcoming Watchlist:
👉 FOMC / Fed rate announcements — major macro driver.
👉 U.S. CPI / PPI releases.
👉 Dollar Index (DXY) movement — inversely influences BTC sentiment.
👉 ETF flow reports & regulatory headlines.
📌 Risk Management Reminder
⚠️ This idea is educational — do your own analysis (DYOR). Manage position sizing and risk per your plan.
📌 Discipline > Emotion. Keep a trading journal.
🙌 Happy trading Thief OG’s — let the charts speak. 💎

BTC: Looking for one last leg down toward 78k?The General Outlook It looks like Bitcoin might be in the final stages of this corrective move. Before we see a real reversal, the market likely needs to complete the structure with one more push lower.
There are two main ways this could play out. We might see a direct, sharp drop where support levels break relatively quickly. Alternatively, it could turn into a "diagonal" style move—this would be choppier and slower, with lots of overlapping bounces, but the destination would likely be the same.
The Key Level The bears seem to be in control as long as the price stays below the recent high of $94,800. If we get a sustained break above that level, this immediate bearish setup is probably invalid.
First Target: Watch for a reaction around $85,500.
Second Target: A sweep of the lows near $80,300.
Final Target: The move could potentially finish somewhere in the $76,000 – $78,000 zone.
Just my thoughts on the chart

Is The BTC Bitcoin MONSTER Trade Setting Up? My Trade Plan.🔥 Is Bitcoin’s Next Big Move Starting Right Now?
Another close look at Bitcoin today 👀📊 — and we’re seeing the move we discussed in yesterday’s video starting to play out.
After yesterday’s aggressive volatility ⚡, price has now delivered the break of structure we were watching for. On the 30-minute chart, the market is printing a clear higher high and higher low sequence 📈 — a constructive sign for bullish continuation.
Price is also holding above the Point of Control and value area on the volume profile 🧠📉, which adds further strength to the current structure.
If we stay patient and continue to build positions strategically, as outlined in recent videos, this setup has the potential to develop into something much larger 🚀. Especially if Bitcoin transitions into a higher-timeframe bullish trend — potentially even a broader trend reversal.
That said, it’s still early days ⏳. We don’t assume — we wait for confirmation.
What I’m watching next is a clean break above the previous highs, followed by strong support on the retest 🔁. A successful break and hold above that level would open the door for another high-quality Buy opportunity ✅📈.
Let’s see how price behaves from here.
⚠️ Not financial advice. Always manage risk.

BTCUSD – Bullish Setup (Daily)
BITSTAMP:BTCUSD is showing early bullish reversal confluences after a prolonged downtrend.
Bullish confluences:
Price bounced from the lower volatility band / demand zone
Higher low formed, breaking short-term bearish structure
Price reclaiming the mid-band / dynamic resistance (trend MA)
Bullish reaction from Fib retracement support
Volatility compression → expansion likely to the upside
As long as price holds above the 90,000–90,500 support, bullish continuation is favored.
🎯 Fibonacci Upside Targets:
Target 1 (38.2%): ~95,300
Target 2 (61.8%): ~98,400
Target 3 (100%): ~103,400
A clean break and hold above the 61.8% Fib would significantly increase probability of a full retrace toward the 100% level.
Invalidation:
Daily close below ~88,800 invalidates the bullish setup.

Quick Bitcoin Update- 4 hour chart shows PA is STUCK
Bulls once again rejected off that Long Term line
Maybe the Bulls allowed this till we get the USa inflation figures later today
The 4 hour MACD shows plenty of room to move higher
Same story on the 4 hour RSI
And despite a this short term Bullish possibilities, I do remind you, we may only be repeating what happened in 2021 after the Nov ATH, where we Went down, had a push higher, just before dropping lower.
That may not happen again, we simply do not know BUT it is a Very good idea to be ready for all occasions
This weekly Bitcoin chart is a simple version of that
There are so many more similarities... but here, see how the 50 SMA ( RED) began turning down after the ATH as PA crossed it.....The same has happened again.
But, this time, PA is nearer the 100 SMA ( BLUE ) and using t as support.
So, we still wait for PA to move higher, just be ready incase it does not remain higher......

BTC/USD: The Breakout & Critical RetestBitcoin (BTC) has successfully broken out of a key descending triangle structure on the Daily timeframe and is currently in the "Retest Phase." After weeks of compression, the price is holding above the upper trendline, testing previous resistance as new support. A successful defense of this zone would serve as strong technical confirmation for the next leg up.
Why this setup is on our radar:
Bullish Confirmation: The market has invalidated the bearish bias typically associated with descending triangles. By breaking to the upside and holding, the structure has shifted from "Correction" to potential "Continuation."
The Retest Mechanics: We are currently observing a classic "Break and Retest" scenario. This is often the highest probability entry point, as it allows traders to join the trend with a clearly defined invalidation level, rather than chasing the initial impulse.
Market Structure: As noted, the macro structure remains constructive as long as the price maintains stability above the triangle's baseline support.
Technical Levels & Plan:
Buy Zone: The current retest region (90,000 - 92,000) offers an optimal entry for trend continuation.
Invalidation Level: The bullish thesis depends on holding the structure. A breakdown followed by a retest of the triangle’s horizontal support (below ~84,500) would signal a "Fakeout" and the start of a deeper corrective leg.
Structural Resistance (Targets): Short Term: 96,000 - 102,000 (Recent Lower Highs) Mid Term: 112,000 - 120,000 (Major Supply Zones)
Macro / Moonbag: If the retest holds, we look towards a re-challenge of the ATH (128,000+) and price discovery beyond.
Risological Note: The "Retest" is the moment of truth. We do not front-run the market here; we wait for candle closures to confirm that the roof has indeed become the floor.
Disclaimer: This analysis is for educational purposes only. Crypto assets are highly volatile. This is not financial advice.

BTC short term resistance $92,246 (Binance 4H), support 91,060 Bitcoin short term resistance is at $92,246 on Binance according to 4H Supertrend indicator.
BTC tried to get through yesterday twice, but failed both times.
If Bitcoin falls through $91,060, it will flash a bearish signal on the 1H chart.
Parabolic SAR: sell
EMA Cross 15/50: buy
Supertrend: sell
Stoch RSI: sell
MACD: buy
