BTC/USDT Wealth Map – Trend Confirmed, Targets in Sight!🚀 BTC/USDT: The Great Crypto Heist! 🤑 Swing/Day Trade Wealth Map
Asset: BTC/USDT (Bitcoin vs. Tether) Vibe: Bullish breakout with a cheeky "thief" twist! 😎Strategy: Swing/Day Trade with a layered limit order approach to steal profits from the market! 💰
📊 Market Analysis: The Heist Setup
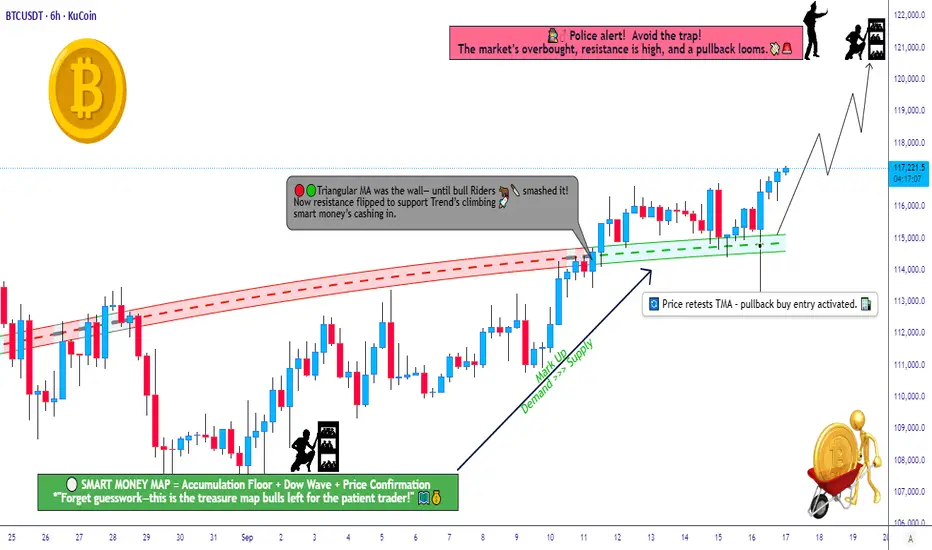
🐂 Bullish Trend Alert: Bitcoin’s charging out of the accumulation zone like a runaway train! 🚂
📈 Triangular Moving Average (TMA) Breakout: Price smashed through the TMA, confirming a reaccumulation phase. Candles retested the TMA dynamic line, screaming TREND CONFIRMED — bulls are in control! 💪
🕵️♂️ Thief Strategy: We’re using a layered limit order approach (aka the "Thief Layering Tactic") to sneak into the market at multiple price levels. This maximizes entries while keeping it slick and stylish!
🗺️ The Heist Plan
🎯 Entry: Pick your spots like a master thief!
🔹 Use layered buy limit orders at:
💸 $115,000
💸 $115,500
💸 $116,000
💸 $116,500
💸 $117,000
🔍 Pro Tip: Feel free to add more layers based on your risk appetite and market conditions! Stack those entries like a pro. 😎
🌟 Alternative: If you’re feeling bold, enter at any price level post-breakout — just keep an eye on momentum!
🛡️ Stop Loss (SL): Set your Thief SL at $114,000 after the breakout for protection.
🔹 Dear Ladies & Gentlemen (Thief OGs), this SL is a suggestion! Adjust it based on your strategy and risk tolerance. Don’t let the market cops catch you off-guard! 🚨
🎯 Take Profit (TP): Watch out for the police barricade (aka strong resistance) at $121,000. This zone may act as an overbought trap, so grab your profits and escape before the market locks you in! 🏃♂️
🔹 Note: Thief OGs, this TP is a guideline. Set your own targets based on your risk-reward preference. Steal the profits and vanish! 💸
🧠 Key Notes for Thief OGs
⚠️ Risk Management: I’m not your financial advisor, so don’t just follow my SL or TP blindly. Tailor your plan to your own risk tolerance and make those profits yours!
🕵️♂️ Thief Mindset: The market’s a game of cat and mouse. Stay sharp, adapt, and don’t get greedy — escape with your loot before the traps spring!
🔗 Related Pairs to Watch
Keep an eye on these correlated assets for extra context:
🔹 BINANCE:ETHUSDT : Ethereum often moves in tandem with Bitcoin. A bullish BTC breakout could spark ETH’s own rally. Watch for similar TMA breakouts or retests!
🔹 BINANCE:BNBUSDT : Binance Coin tends to follow BTC’s lead in bullish markets. Check for momentum alignment.
🔹 BINANCE:XRPUSDT : Ripple can show correlated strength, especially if BTC pushes past resistance. Look for breakouts above key levels.
🌟 Correlation Tip: These pairs often mirror BTC’s price action in bullish trends, but always confirm with your own analysis to avoid market traps! 🕸️
✨ Final Words
This is your chance to pull off the ultimate crypto heist with BTC/USDT! Stay disciplined, manage your risk, and let’s make those profits disappear into your wallet! 😜
✨ If you find value in my analysis, a 👍 and 🚀 boost is much appreciated — it helps me share more setups with the community!
#BTCUSDT #CryptoTrading #SwingTrading #DayTrading #ThiefStrategy #BullishBreakout #TradingView
Bitcoinmarkets
Bitcoin & DXY $ PA since 2008 shows BTC PA in ATH Zone - Why ?
Really easy one this.
There is only ONE Bitcoin ATH that happened when DXY PA was NOT on or below the Lower trend line that DXY PA has been in since 2008
And that was on the way lower but turned higher after the BTC ATH.
When I begain with Bitcoin in 2013, I was told, There is a correlation between DXY and BTC...."They go in opposite directions"
On smaller, this can appear to be False but looking at this Monthly chart, it Very clearly shows it is true.
The Day counts above are the days from when DXY first touches the upper trend line to the last week that PA touches the Lower trend line before rising higher again.
You can see that, apart from the 2nd ATH in 2021, there are 2 ATH for Bitcoin in the 2nd half of this day count.
The Green Box shows us the potential Zone for the next 2 BTC ATH. We have already reached a New ATH this "Cycle" but we have NO idea if a Higher ATH is Due or not.....We have to wait and see but the expectation is currently that we will.
The Vertical orange Dotted lines are previous USA election dates and I can see no real connection to these and DXY PA. Some are high, others are Low....However, the Next election is just after t his Bitcoin ATH Zone and so we may see some influences.
Something I also find interesting is how Bitcoin PA is rising in a similar way to how the DXY $ has since its Drash in 2008
The Monthly BTC chart
DXY since 2008 Monthly
You can clearly see the controlled rise and fall of PA within a channel,
This cycles Weekly Bitcoin chart is the first time we have seen that type of PA in a weekly cycle.
This is Bitcoin since Jan 2023 Weekly
So, we may have opposing PA action but we also have a similar style within a channel
Things to take note of.
We may have reached the BTC ATH zone already and we may not go higher, though the potential does exist to move further and, my opinion, is we will.
But it would be incredibly Nieve to assume it will go higher with out having some precautions in place.
Everyone talks about UPtober.
We have had RED Octobers - October 2012 was red and in the Middle f a Bull run
So Caution while we surf the crest of this Wave...
Just something I thought I would share.

QRL is Riding the Quantum Wave
ECDSA encryption, used by most blockchains such as BITSTAMP:BTCUSD and COINBASE:ETHUSD , will be broken by quantum computers within the next few years. This means that most blockchains will eventually need to upgrade to post-quantum security. That will be an enormous and complex task.
Quantum Resistant Ledger ( MEXC:QRLUSDT ), launched in 2018, was built for quantum resistance from its very first block. A truly visionary double audited project ahead of its time, it remains one of the few genuinely quantum-secure cryptocurrencies.
Lately, quantum computing news seems to be raising awareness and driving QRL’s price higher. Today’s volatility was the highest since it was listed on MEXC. A BitMart listing is expected soon, and the team has been working for years on a major upgrade that will make QRL similar to Ethereum but quantum-resistant.
The community is extremely active on the official QRL Discord, where highly skilled professionals answer every question patiently. Marketing efforts are also ramping up as the community spreads awareness and encourages everyone to do their own research.
Personally, I see asymmetric potential here, a bit like Bitcoin in its early days. No one can say how high the valuation could go, but it is clear that there is a growing need for this kind of asset. At the TOKEN2049 event in Singapore, Charles Edwards suggested that Bitcoin and Ethereum holders should hedge their risk by allocating 5%, 10%, or whatever they feel comfortable with, to quantum-secure assets. QRL seems like a strong candidate for that role.

Bitcoin - The path remains clearly bullish!💰Bitcoin ( CRYPTO:BTCUSD ) remains bullish either way:
🔎Analysis summary:
For the past 1.000 days, Bitcoin has simply been heading higher. Considering that the previous bullruns lasted about 800 days, Bitcoin is ready for a correction. But market structure tells us, that Bitcoin remains bullish, even if we see a short term correction in the near future.
📝Levels to watch:
$50.000, $1.000.000
SwingTraderPhil
SwingTrading.Simplified. | Investing.Simplified. | #LONGTERMVISION

BMNR Technical Outlook: A Textbook PlayStructure and Pattern Recognition
BMNR has developed a constructive base while holding its broader uptrend structure. The chart highlights the potential formation of a double bottom reversal, a classical pattern that often signals the exhaustion of selling pressure and a shift toward accumulation. The neckline aligns closely with recent liquidity zones (LQ), providing a clear reference point for confirmation.
Key Levels and Setups
Price is currently consolidating around the $50–$52 range, supported by the trendline from early August. Above, the immediate target lies at the $57–$60 liquidity zone, followed by a higher expansion opportunity toward $65–$67. If momentum persists, the upper extension into $71+ remains in play. A break and sustained close below the ascending trendline, however, would invalidate the structure and shift focus back to the mid-$40s.
Volume Profile and Momentum
The volume profile confirms heavy participation around the $50 area, creating a strong base of support. As price reclaims the 200 EMA and breaks above local resistance, order flow is likely to accelerate toward higher supply zones. This aligns with the thesis that any breakout above neckline resistance could trigger a measured move targeting the mid-$60s.
Outlook and Scenarios
Bullish Case: A confirmed breakout above the $57–$60 zone validates the double bottom structure, opening the path toward $65–$67 and potentially $71.
Bearish Case: Failure to hold the $50 trendline support exposes BMNR to a deeper retracement, with downside risk into the low-to-mid $40s.
Conclusion
BMNR sits at a technical crossroads. While downside risk remains if $50 fails, the pattern structure and volume dynamics favor continuation higher if resistance breaks. Traders should monitor the neckline breakout as the defining signal for near-term direction.

Bitcoin Swing Trade Setup – Institutional Inflows Fuel Bulls🎭 BTC/USD – Money Heist Plan 🚀 (Swing + Scalping Strategy)
📊 BTC/USD Real-Time Market Data
Current Price: $111,156.01
24h Change: +$2,117.61 (+1.94%)
Day’s Range: $108,540.93 – $111,180.45
52-Week Range: $49,538.00 – $123,640.00
😰 Fear & Greed Index
Score: 49/100 → Neutral 😊
Trend: Shifted from “Fear” to “Neutral” in the last 24 hours.
🧠 Investor Sentiment Outlook
Retail Traders: Cautious (63% worry about crypto safety).
Institutional Traders: Bullish (💵 $3.7B net inflows in August).
🌍 Fundamental & Macro Score
Policy Uncertainty: High (U.S. tariffs, Fed policy shifts).
Fed Rate Cut Probability: High (expected September cut).
Key Event: Non-Farm Payrolls (Sept 5; forecast 45K jobs).
Gold Rally: $3,508/oz (+30% YTD, strong hedging demand).
🐂 Market Outlook
Short-Term: Neutral → Slightly Bearish (September volatility ahead).
Long-Term: Bullish (Institutional inflows + macro liquidity).
Bull/Bear Score: 55% Bullish vs 45% Bearish.
🎯 Thief’s Trading Plan (Layered Entry Strategy)
I’m setting up multiple limit orders (“Thief Layers”) instead of going all-in — this spreads risk, builds better entries, and keeps flexibility.
Entry (Layered Buys):
$109,000 → $109,500 → $110,000 → $110,500
(Add more layers as per your own strategy)
Stop Loss (Thief SL):
$107,500 (Adjust for your own risk appetite)
Target Zone (Profit Extraction):
$116,000 (Checkpoint before major resistance zone)
💡 Key Takeaways
BTC rebounded +1.94% but faces headwinds from whale profit-taking & policy risks.
Neutral sentiment (49/100) reflects a balanced investor mood.
Friday’s NFP jobs data could shape Fed rate expectations → big volatility catalyst.
🔍 Related Pairs to Watch
BITSTAMP:ETHUSD | COINBASE:SOLUSD | BITSTAMP:XRPUSD | BINANCE:BTCUSDT | CRYPTOCAP:BTC.D
#BTCUSD #Bitcoin #CryptoTrading #SwingTrade #Scalping #TradingStrategy #LayeredEntries #CryptoCommunity
✨ “If you find value in my analysis, a 👍 and 🚀 boost is much appreciated — it helps me share more setups with the community!”

Why we should be using BTCXAUt GOLD pair and NOT BTCUSDT
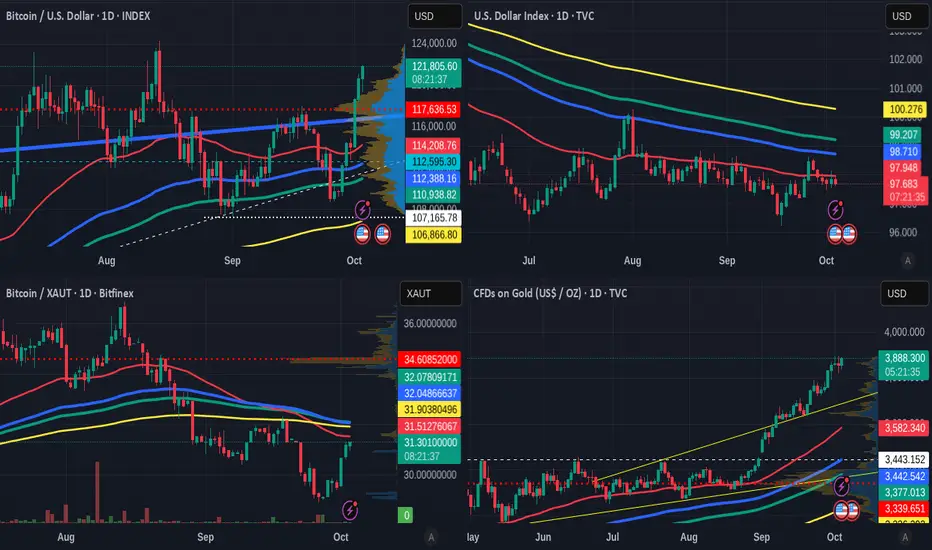
These charts are DAILY chart
Top Left BTCUSDT Index - Top right DXY US $ Index
Bottome Left BTCXAUt Bitcoin GOLD - Bottom right GOLD USD
Easy to see how the USD is currently running FLAT after Months of devaluation (top left)
So while BTCUSD has risen, More $ per Bitcoin, the REAL Value of each $ is less than it was in 2023, when this bull run began taking shape.
If we look at the BTCXAUt chart, we can see how in the same time period, BTC has Lost to Gold since June but has begun to regain,
Infact, if we look at the BTCXAUt Weekly chatrt, you can see how BTC has walked all over GOLD.
More than that, just look at that pennant.
But Why is GOLD better pair than $?
Look at the Weekly GOLD chart
This is the same scale as the chart above.
GOTH HAVE RISEN IN VALUE SUBSTANTIALLY>
This is a WIN WIN situation
The DXY ni the same period
Ranging with Deeper Drops each time.
Trading is 90% more profitable with BTC GOLD pair
Even if you do not trade and you want to take profit, Sell your Bitcoin to GOLD and your profit continues to Rise !!
If you Trade the swings higer andlower on each asset, there is a risk but the Gains are REAL
Just saying, NOT Advice
Have a Nice weekend
BITCOIN Risky Short!
HI,Traders !
#BITCOIN grew up fast
But then hit a horizontal
Resistance level of 117678.7
From where we are already
Seeing a nice pullback
And we will be expecting
A further local move down !
Comment and subscribe to help us grow !

Is Bitcoin about to outperform Gold ? The potential Does exist
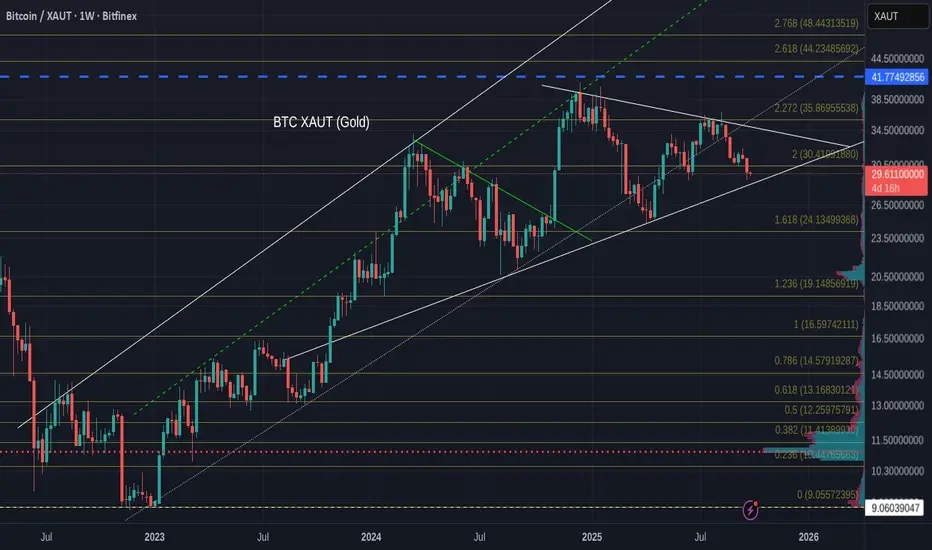
As we can see on this weekly Bitcoin XAUT Gold chart, BTC Ranges, pushes, ranges, pushes.
And the BTC PA is now on the line of support ir has strongly bounced off previously.
PA is also beginning to get Squeezed in the Pennant. The Apex is next year but I expect PA to break out of this this year.
It will be interesting to see what happens here this month and I do have Hopes that BTC will begin to outperform gold, certainly while PA pushes up off support and heads towards the upper trend line.
This idea is backed up with the weekly GOLD Chart below.
As we can see, Gold is up on the upper trendline and has hit the 2.768 Fib extension, Both of which are likely to be resistance.
We can also see how Oversold the Gold Weekly MACD is
There is a Strong likelihood that Gold will need to cool off, though we need to understand that MACRO events do control this, so a Drop is not guaranteed.
But I will be watching this CLOSE as The BTCXAUT pair is a much better Pair to watch than the BTCUSD.
Yjr reason being, while the $ looses Value, gains in the BTCUSD pair are Not as good as it may appear. Because you may gain in the number of $ you can get but each $ is worth less.
GOLD meanwhile, is rising in Value or not loosing as much when it ranges. Itis a STORE of Value and is internationally recognised and is politcay neutral.
Why is Bitcoin under a LOT of pressure to move higher right now
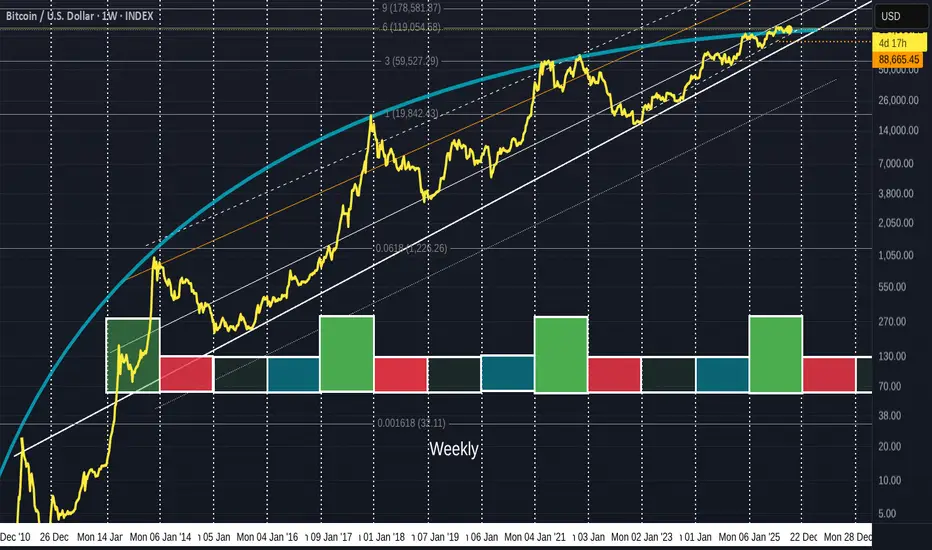
That Blue line is a calculated Arc, that is, in fact, a part of a Fibonacci Spiral.
As you can see, it has rejected EVERY Bitcoin ATH - Every one.
And right now, PA is getting Squeezed by it and the line of long term support just below.
We have till year end to break and hold above this Blue Arc.
Here is a Zoomed version of the same chart.
PA is currently Just above that Line,,but only just.
It has been rejected a number of times since Q4 2024.
We need to break above and hold.
It is as simple as that, otherwise, PA will be dragged down.
As you probably realise, This is the end of this Series of Bitcoin cycles.
Once above the Spiral, we leave a series of patterns Bitcoin has been in since it was created in 2008
Exciting days ahead
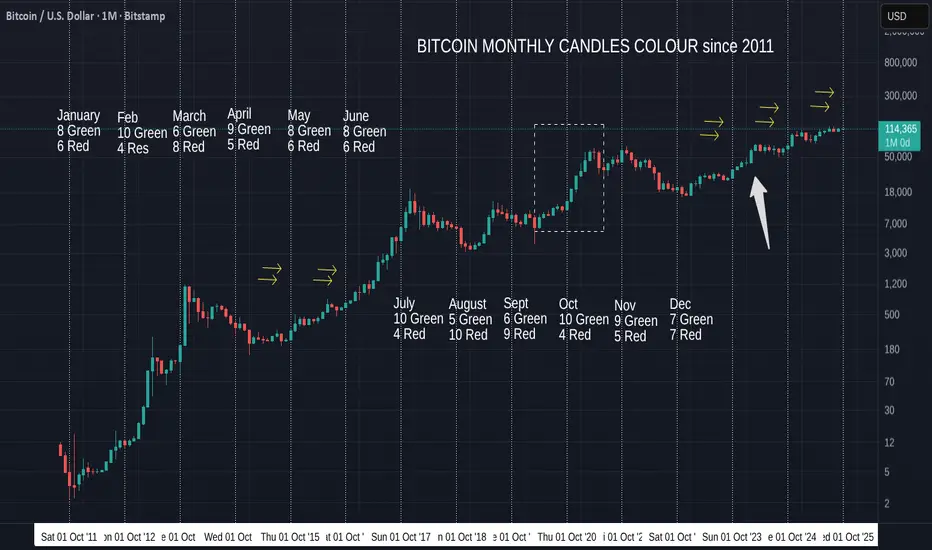
Bitcoin Monthly Candle Close colour & Patterns since 2011Septemer Closes GREEN
Where you see 2 Arrows is where we had a Green September after Red August Closes, as we have just had again.
All had Green Octobers Following.
Note those double arrows on the left are in the 2016 build up to 2017 ATH and the ones on the right are in the Current cycle.
Past October closes are 10 Green to 4 Red, so the Odds are we will see another Green October close, though it may not be a large candle.
InFacr, there are a few charts that point towards a Red start till around Second week, 12th - 15th October.
This of course can change but it maybe worth understanding that we may get a bloody month start.
However, given where we are in this Bitcoin cycle, assuming this one will continue as others have, we do not have a year plue left to reach ATH as the 2016 set of arrows would imply.
So my eye is now drawn to the Dashed box that leads up to the 2021 ATH in March 2021.
To many extents, that PA is very similar to that in 2023 (arrow) and if that is to be repeated, we could see a large recovery this month.
One thing that reslly needs to be mentioned is also how small the candles are now.
The pressure is on Bitcoin right now.
Of the 4 Red Octobers, only 1 was in a Bull run.
This months Candle Close Will certainly let us know where we are in a cycle.
That is IF we are still in a Cycle.
As mentioned in a number of posts now, the idea that Bitcoin will Drop away after the next ATH is possibly flawed.
But we have to wait and see what happens.
We can certainly look forward to a positive number of monthsd ahead for Bitcoin and this should take PA above a Long temm line of resistance that has rejected EVERY ATH since Bitcon started.( please refer to previous posts to learn more )
Happy October everyone and do not Panic if we do Dip further to start with
#BTCD On the blue box, close all your longs.#BTCD On the blue box, close all your longs...
After 3755, I will close all my long positions. BTCD will suddenly rise, which will cause a market crash. Those in profit on longs should book their profits, and those in loss should save themselves from bigger losses. #ETH can go down near 2900, so you can imagine what will happen to the rest of the alts.
We’ll keep checking the remaining updates.
!! Jai Baba Ki !!

BTC where are going from here?See the analysis I have made with BTC still some lows to be had however if we break that high then possible run up to the 120's makes sense
Stay cautious
Kris/Mindbloome Exchange

Bitcoin Reward – Bullish Thieves or Bearish Bandits?🚨💰 BTC/USD "Bitcoin vs U.S. Dollar" Crypto Market Grand Heist Plan 🎭🚨
🕵️♂️ Dear Thief OG’s, Money Makers & Market Bandits 💎💰
It’s time to lock & load the Bitcoin Heist Plan with both sides of the robbery open (Bullish & Bearish)! ⚡
🔑 Entry Zones (Where the Robbery Begins)
📉 Bearish Bandits: Any price level! Rob the upside liquidity & run it down!
📈 Bullish Thieves: Pullback entry 108,000.0 and above – sneak in with style & power.
🛑 Stop Loss (Escape Route)
🔒 For Bullish: Thief SL @ 105,000.0 🚨
⚠️ Reminder, OG’s: Adjust your SL with your own strategy & risk plan. Don’t get caught by the market police 👮♂️💥.
🎯 Target (The Loot Bag)
🏆 Bullish Robbery Target: 124,000.0 💸
🏴☠️ Bearish Robbery Targets:
1️⃣ 110,000.0
2️⃣ 104,000.0
📜 Thief’s Market Note
This isn’t just a trade, it’s a crypto robbery blueprint – choose your side, Bullish or Bearish, and execute like a true Thief Trader. Always plan your entries in layers, stack the loot, and manage your risk like a pro bandit. ⚡💼
🔥💥 If you love the heist style, Boost this idea 💥🔥
Every boost adds fuel to the Thief Trading Crew 🚀💎.
Stay alert, stay sharp, and remember… the market is the biggest bank, and we are here to rob it! 🤑🎭💰

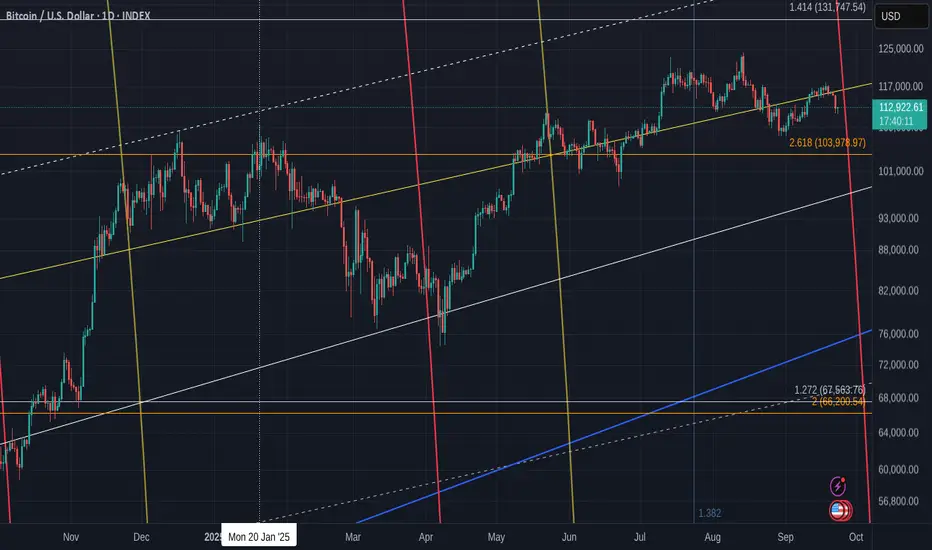
Bitcoin Daily - Near by lines of support and possible targets
Some short term Bearish and Bullish odeas.
That red "line" near current PA is a 236 Fib circle and, as you will know if you been reading my posts, These Often provide Downside.
As a result, I am looking to see a price near or slightly below 100K before a turn around.
That would bring us to the 2.236 Fib Extension line.
Should that fail, 96K is the next line that should hold
The Daily MACD also supports a further drop
MACD just turned Bearish above neutral line. It may find support on the Neutral line for a shorter term bounce.
The RSI may support the idea of a push back
We can see that the RSI has stopped dropping and so this may indicate a reversal is about to play out.
We have to watch and wait.
This time next week is the last day of September.
The Month Candle needs to close GREEN to keep Bullish sentiment. It is currently Still Green.
A Red Close and things would certainly appear to be a little more Bearish.
October is a predominantly more Bullish month normaly.
This next week should see a bounce if we are in a bullish run still.
However, as mentioned above, there is still room on that green Candle for a Dip Lower.
Or we may close Green, The Dip and then push higher.
So many options.
Bitcoin Price Prediction: Will BTC Hit $119K Next?Bitcoin Price Prediction: Will BTC Hit $119K Next?
Bitcoin’s journey has been nothing less than a roller coaster, marked by dramatic rises and sharp falls. As of late, the cryptocurrency has seen fluctuations influenced heavily by broader economic signals, particularly the policy decisions from the United States Federal Reserve. The latest buzz in the crypto community revolves around whether Bitcoin can breach a new milestone of $119,000. This speculation is fueled by recent shifts in the market and macroeconomic policies that could either propel or hinder this ascent.
Current Market Overview
Key Resistance and the $118K Threshold
Bitcoin currently faces a significant resistance level at $118,000. This figure is not just a random high point; it represents a critical psychological and technical barrier. A break above this level could signal a strong bullish momentum, potentially setting the stage for reaching new heights. The resistance has formed due to various factors including profit-taking, historical resistance levels, and speculative trading behaviors.
The Role of the US Federal Reserve
The Federal Reserve's policies, particularly interest rate cuts, have a profound impact on investment in risk assets like cryptocurrencies. Lower interest rates generally decrease the yield on safer investments like bonds, making higher-risk investments more attractive. The anticipation around the Fed's decisions can lead to increased volatility in the Bitcoin market.
Liquidity and Market Sentiment
The liquidity in the Bitcoin market, evidenced by the influx of both buy and sell orders, plays a crucial role in its price movements. High liquidity leads to less price manipulation and more stability, whereas low liquidity can lead to higher volatility. Currently, the market is witnessing substantial liquidity, indicating active participation from both retail and institutional investors.
Factors Influencing Bitcoin's Price Trajectory
Institutional Adoption
One of the primary drivers behind Bitcoin’s potential rise to $119K is the increasing adoption by institutional investors. As more firms enter the market, their substantial buying power can significantly push the price upwards. This adoption also adds legitimacy to Bitcoin, encouraging more cautious investors to dip their toes in the crypto waters.
Technological Advances
Improvements in blockchain technology and the introduction of new features can also influence Bitcoin's price. For instance, enhancements in scalability and security can make Bitcoin more attractive to both investors and users.
Regulatory Environment
Regulations play a pivotal role in shaping the cryptocurrency landscape. Positive regulatory developments, or lack of negative ones, could boost investor confidence and push the price of Bitcoin higher.
Economic Indicators and Market Sentiments
Inflation and the Dollar Index
Inflation levels and the strength of the dollar also influence Bitcoin’s value. Typically, Bitcoin has been seen as a hedge against inflation. A weaker dollar often makes Bitcoin more attractive to international buyers, potentially pushing its price up.
Sentiment Analysis
Market sentiment, driven by news and social media, significantly impacts Bitcoin’s price. Positive news can lead to fear of missing out (FOMO), driving the price up, while negative news can trigger panic selling.
Technical Analysis and Future Predictions
Chart Patterns and Indicators
From a technical standpoint, Bitcoin has shown resilience by bouncing back from several corrections. The formation of a bullish flag pattern, combined with strong support levels being tested and held, suggests upward momentum.
Predictive Models
Various predictive models based on historical price data, market cycles, and external economic factors suggest a bullish outlook for Bitcoin. These models often incorporate elements like stock-to-flow ratios which have been historically accurate in predicting Bitcoin’s long-term price movements.
Expert Opinions
Many industry experts and analysts have weighed in on Bitcoin’s potential to hit $119K. While opinions vary, the prevailing sentiment is cautiously optimistic, contingent on market conditions and macroeconomic factors remaining favorable.
Conclusion
The question of whether Bitcoin will reach $119K is complex and laden with variables. Key factors include Federal Reserve policies, market liquidity, institutional investment, and broader economic indicators. While the short-term journey may be volatile, the long-term outlook for Bitcoin remains bullish, with many paths potentially leading to new all-time highs. As always in the crypto world, only time will tell, but the signs are promising for those betting on Bitcoin’s success.

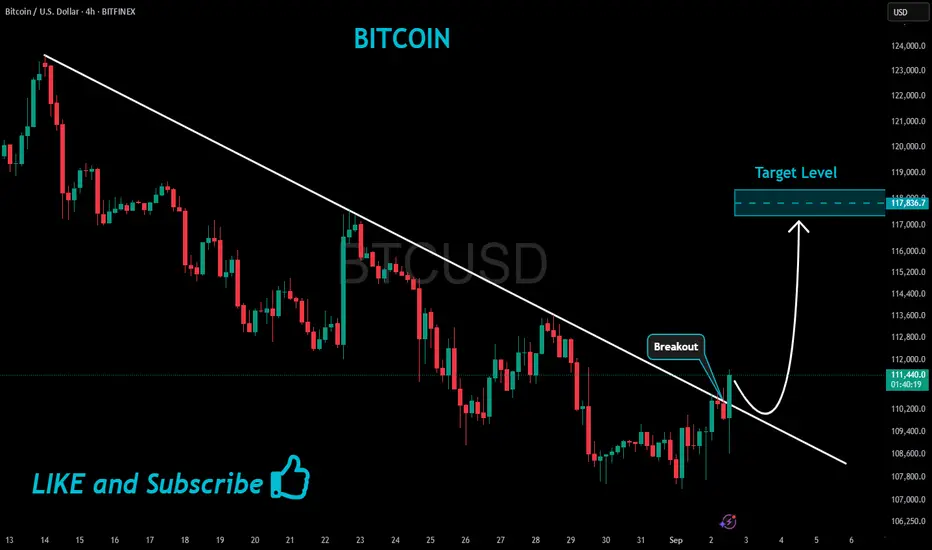
BITCOIN Bullish Breakout!
HI,Traders !
#BITCOIN made a bullish
Breakout of the falling resistance
And the breakout is confirmed
So we are bullish biased
And we will be expecting
A further bullish move up !
Comment and subscribe to help us grow !
I am still waiting for the downside. LMACD on the monthly chart is starting to print the red candles suggesting the changing in momentum. Just wait for Aug-Sep 2026 and start scooping again for the long run.

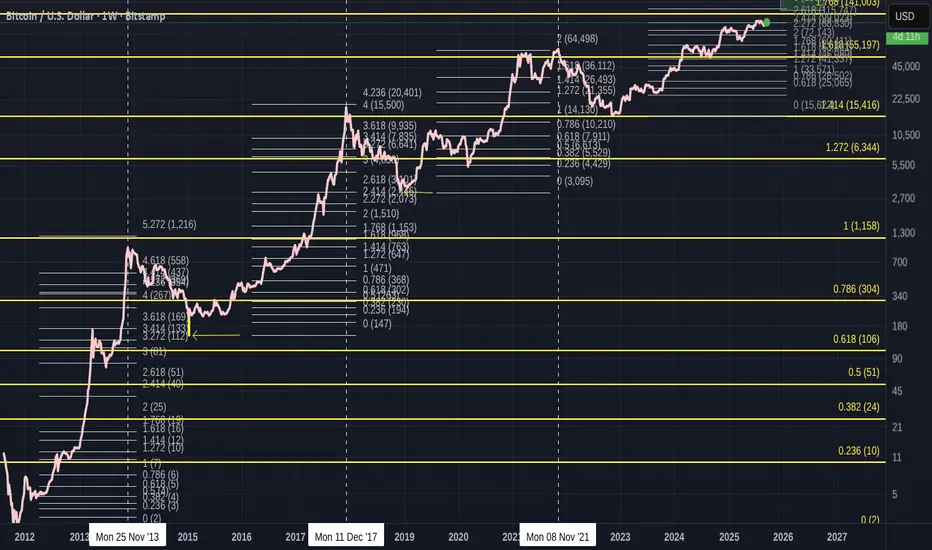
Bitcoin Global / Local Fib Levels point to the TOP area to watch
Each Low to ATH has a "Local" Fib extension Set
And the Yellow Fib extension is from the 2011 Low to the 2013 ATH and I use this as a "Global" Fib as that was, in reality, the first ever Low to ATH before a sustained draw back.
Please Note that as Candles would not show very clearly at this scale, I have used a Line. This has some inaccuracy as to true candle Ends. As a result, it looks like some Fibs are misplaced but I assure you, each are placed accurately, using candles and then the Line is used.
The Fibs are accuratly placed.
Local Fib extension ATH Fib number
2013 November - 5.272
2017 December - 4.236
2021 November - 2
2025 Current just above 2.618
Global Fib extension ATH number
NOTE- See on chart how ATH is just above this Fib level, except for Fib 1.
2013 November - 1
2017 December- 1.414
2021 November - 1.618
2025 Current Fib just below 1,758 - if we follow trend, I expect ATH to be using this 1.768 line, the next in sequence of Fib numbers.
Local Fib charts
2011 low to 2013 ATH
2015 low to 2017 ATH
2019 low to 2021 ATH
2023 low to current position
To me, there are a number of things to see here.
More than anything, what is plain to see is how Bitcoin has used the Global Fib numbers like stepping Stones. Currently just below the 1.768, which is the next in sequence. ( Yellow lines )
All but the First ATH were recorded just above the Global Fib lines ( the First was on the line ) and I have little doubt we will do this again.
And if we look at the pattern of the Local Fib lines, we can see that we missed the 3.236 line in 2021
We went from 5 to 4 to 2. ( ignoring the 236 bit for now.)
We missed 3
See how the first 2 Local Fibs dropped by nearly one complete Fib number, from 5.272 to 4.236
By the time we headed towards the 2021 ATH, the market accelerated hugely, mostly due to the idea of Get Rich quick and no tax rules..GREED WAS UPMOST.
Even at the time, I considered this cycle Abnormal. Many charts show why, and I will not expand further here.
The Local Fib level for that run was distorted by the swift recovery from the low in 2019.
While this was not a bad thing, it changed the cycle dynamics.
This cycle, currently, we have returned to a more sensible approach and we appear to be heading to the 3 local Fib zone, maybe as we should have done in 2021.
This also happens to be just above the 1.768 Global Fib line, The next expected Global ATH line.
So, we are currently approaching that 1.7668 Global Fib line and we can expect the ATH to be above this, if we follow the previous 2 ATH.
And if we go above that Global line the same as we have in the last 2 previous cycles, we find the Local 3 Fib extension.
IF we were to follow previous, this could be expected ro be the 3.236, at around 190K
I think this is doubtful and maybe the 3 itself is more realistic at 155K
So, there you have it.
Bitcoin and its Fibs have a pattern, it get broken and it looks like it is trying to regain that pattern.
And this is all done by Humans trading........
Astounding.
and that 2 Global Fin line in 2029 ? Will we get there ?
Given the introductions of ETF and Corprate Long term holders....Will we see a bear market before we rech that 2 Global Fib ?
So many questions...
One real answer is BUY BITCOIN AND HOLD ON TO IT
Bitcoin - It is bullish either way!💎Bitcoin ( CRYPTO:BTCUSD ) still remains bullish:
🔎Analysis summary:
Yes, over the past couple of days we have been seeing a quite negative correction on Bitcoin. However, looking at the higher timeframe, Bitcoin remains totally bullish. So even if Bitcoin continues with the recent correction, it would ultimately result in a bullish all time high break and retest.
📝Levels to watch:
$60.000
SwingTraderPhil
SwingTrading.Simplified. | Investing.Simplified. | #LONGTERMVISION

What I see...I assume an upward to around 119K and then down to get stable around 111K before breakout. How do you see the chart?

BTC Breaks out ! Classic breakout .
Let's see if we this breakout holds up or not.
We will watch this one closely....

BTCUSDT - What next ?? We can see a retest of 111k7 level, but bitcoin was not successful in closing above it.
111K7 continues to remain as our area of interest for now. Closing above which we will change bias.
For now bitcoin is still bearish....
Happy Trading!!!
