Bitcoin Top Is In — 35 Months Symmetry, Final Bottom TargetThey won't believe me even If I told them...
I’m going to state this plainly and accept that most people will dismiss it.
Bitcoin has already printed its cycle top.
Not because of vibes, not because of fear — but because the cycle math is complete.
The Core Thesis (Simple, Replicable, Unemotional)
The previous bear market bottom → bull market top duration this cycle is 35 months
That is identical to the last cycle
When cycles rhyme this precisely, it is not coincidence — it is structure
The market has already done what it historically does.
Time is the tell. Not price.
What Comes Next (The Downtrend Phase)
From here, Bitcoin enters its true bear market descent, not a “healthy pullback.”
My expectations:
Continued downside into Q4
Final capitulation window:
October (12 months) from the top
or December (14 months) from the top
I am specifically watching October 16th–26th as the most likely window for Bitcoin’s actual bottom.
That is where fear, disbelief, and exhaustion peak — not where hope lives.
Price Targets (No Sugarcoating)
$44k–$48k is a realistic and structurally sound bottom zone
Some argue Bitcoin will not break below $66k due to:
U.S. presidential election cycle effects
perceived structural support
That outcome is possible.
But my base case remains:
A deeper flush that convinces the majority that “Bitcoin is broken again.”
That is how every real bottom forms.
What Happens After the Bottom
Once the October/December bottom is in:
Bitcoin begins a parabolic recovery
Followed by exponential growth through 2027
New all-time highs projected:
Late 2027
or Early 2028
This is not bearish long-term.
This is cycle realism.
The Hard Truth (Why This Will Be Ignored)
Even if this thesis is 80–90% correct, most people will reject it.
Not because it’s wrong — but because:
Humans distrust information that comes too cleanly
They assume there must be a gimmick
They believe “nothing in life is free”
They fear being fooled more than they desire being early
I could give tomorrow’s winning lottery numbers to millions of people —
and I doubt most would even try to run them.
They’d ask:
“How could you possibly know that?”
And then do nothing.
That is human nature.
Final Note
This post is not asking for belief.
It’s documenting a cycle call — ahead of time.
If this plays out, it won’t feel impressive in hindsight.
It will feel obvious.
That’s how markets work.
Not financial advice. Just a timestamped thesis.
Bitcoinpattern

BITCOIN BLUES - PROFIT Bitcoin performance has gone as expected and is near our target of 95k , however can close 50-70% of the trade or trial stop stay tuned for more opportunities and news

BTC - Do you See... What I see?Charting a decades worth of trades isn't easy. But when in doubt, you must zoom out. Do you see what I see? BTC price has fallen completely out of order. 80k is immanent maybe even 60k. Once the first red line breaks... there be a big earthquake that will scare and shake out most doubters and traders that want to save face. BITSTAMP:BTCUSD Is here to stay, but we might see a while until recovery.

Historical Bitcoin ATH drawdown to Fib retrace and % decline
Bitcoin ATH drawdown to Fib retrace and % decline
2011 to 0.236 retrace = =92.41%
2013 to 0.236 retrace = -78.27%
2017 to 0.382 retrace = -82.20%
2021 to 0.5 retrace = -76.40%
Also note how PA bounces off the 50 Week SMA ( Red ) after every ATH except for in 2011. I have only included the 2011 High as it also reached down the the 0.236 after ATH.
But it Must be remembered that the 2011 High is NOT in any channels. It did however, become the support and origin of the current Lower line of Long Term support.
Every other ATH had a draw down to the 50 week SMA, a bounce higher and then fell through the SMA. (2017 is slightly different but this is still valid )
The 2021 Bounce led to a new ATH for the first time.
Currently from Current 2025 ATH, we have still not reached the 0.236 on the current draw Down but we have fallen through the 50 week SMA for the first time this Cycle.
This is VERY different from previous Cycles. You will also note how PA has previously bounced off the 50 SMA 3 times this cycle already, on or very near a Fib line..
Again, Very different behaviour.
However, as you can see from the main chart, we have used Every single Fib line on the way up. It was fairly similar in the lead up to the 2017 ATH.
To me, this validates these Fib lines.
But What I want to look at is how the 2021 PA went to an ATH, retraced back to its own 0.236 line, on the 50 Week SMA ( Red), bounced to a New ATH and then Draw down, a small bounce and fell through the 50 SMA.
That second draw down did not reach the 236 > it bounced up till it collided with the 50 week SMA and then went into a full on Bear.
All that happened between the 0 and the 0.236 Fib Retrace lines, untill it fell through .
To many extents, Bitcoin PA is repeating this.
We hit a new ATH in Jan 2025, retreated to the current 0.236 and the 50 Week SMA, bounced to a New ATH in October and have been in retreat since, never yet reaching the 0.236 again.
I am currently looking to see when current PA hits the 50 week SMA.
The 50 week SMA will be Met, at current trajectory around the 100K usdt mark.
Then, if we follow the 2021 pattern, PA will get rejected and we will eventually head to the 44K zone on the 0.5 Fib retrace. Which also happens to be the line that PA bounced off in 2021, its 0.236 fib line.
That is around a -63% retrace. LESS than previous retracements.
That follows the 2021 route.
Current PA is also stil running between the 0 and the 0.236 fib retracement lines. As the 2 ATH's did in 2021. We do seem to be following a simialr Technical pattern.
Look back though the other ATH and see how the 236 was used.
BUT if we look back to the previous Fib retrace lines..We seem to be going to the next Fib retracement level sown after each ATH, before a meaningful bounce.
2013 to 0.236 retrace
2017 to 0.382 retrace
2021 to 0.5 retrace
If we follow This, the next for this cycle could be the 0.618, which sits at 34,966 usdt
I do yet think this will Happen and 7here is NO guareantee this will happen but I have found it very interesting how PA is repeating a number of patterns, certainly, currently, the similarity to the 2021 ATH structures.
Another was From October 2021 till June 2025, we had PA running a near perfect copy of the 2013 to 2017 Fracel.
This has now changed and we follow a later route
This Can obviously get Broken completely by Fundamentals....which are Mental right now.
And then, we have the Shouts of "This time is Different. "
YES and NO.
As this post shows, there are many similarities and yet, at the same time, The way PA has reacted and moved this cycle, if it is a cycle, is also unique,,,
And another reason for that, is studied in earlier posts about "The Blur Arc of resistance"
And we may well just keep on going to a New higher ATH in 2026.
While the current draw down has been painful, there is no confirmed Bear market yet
I hope this gets you thinking.....Enjoy....
I would love to hear yur Views

The Hidden Rhythm Behind Bitcoin’s Four-Year CycleSince 2015, Bitcoin has been moving like a heart beat that refuses to tick randomly. If you zoom out far enough, the timeline paints a pattern that repeats with crazy precision — a rhythm of 365 and 1,065 days, echoing across bull and bear cycles.
Here’s the sequence:
• 2017 All-Time High → 2018 All-Time Low:
365 days
• 2018 All-Time Low → 2021 All-Time High:
1,065 days
• 2021 All-Time High → 2022 All-Time Low:
365 days
• 2022 All-Time Low → 2025 All-Time High:
1,065 days
A perfect alternation, almost like Bitcoin inhales for a year… and exhales for three.
This pattern aligns beautifully with the idea of a four-year cycle, but what’s fascinating is its precision. It’s not vague. It’s not approximate. It’s day-count accurate, which makes you wonder:
Is this just market psychology repeating itself?
Or is Bitcoin following a deeper structural rhythm embedded in its halving mechanism?
But here’s where it gets interesting…
This cycle might not stay “perfect” forever.
We’re entering a new era where:
• Countries are adding strategic Bitcoin reserves
• Institutional funds, big company's are stepping in ( Microstrategy, Tesla, etc. )
• ETFs and sovereign buyers are absorbing supply that miners can’t replenish
This pushes Bitcoin closer to becoming a macroeconomic asset, not just a speculative one.
And when the character of an asset changes, its cycles can stretch, twist, or break.
So maybe — just maybe —
even though the 365/1065 rhythm held from 2015 to 2025 like clockwork…
this time the real bull run might arrive later than expected.
A delayed ignition.
A late bloom.
A cycle that still respects the past — but evolves with the future.
Because for the first time in Bitcoin’s history, the buyers are not just retail dreamers or early believers.
They’re nations.
They’re institutions.
They’re multi-decade players.
And assets behave differently when the hands holding them change.

BITCOIN : First Drop Then Shoot Up To $150,000Overview🧠
Bitcoin is in a bearish trend since it reversed from our previous trading zone. We expect the price to continue declining between 60,000 and 70,000. This is a suitable time to consider buying Bitcoin. Once the trade is activated, there are three potential targets: 90,000, 120,000 and 150,000.
Please use appropriate risk management when trading Bitcoin as it is a more volatile asset.
We wish you the best of luck.
Team Setupsfx_❤️🏆

Market analysis using bitcoin dominance & usdt dominance chartsWe aim to conduct an in-depth analysis of the correlations among four key indicators used to interpret the complex dynamics and investor sentiment in the cryptocurrency market — Bitcoin Dominance, USDT Dominance, TOTAL3, and the Coinbase Premium — and to share insights on how these can be effectively utilized in real trading strategies.
By analyzing these four indicators together, traders can identify the overall market trend, gauge the vitality of the altcoin market, and assess institutional participation, which provides a foundation for developing mid- to long-term trading strategies.
First, please click Boost (🚀) so that more people can see this post.
💡Understanding the Key Indicators
Bitcoin Dominance: CRYPTOCAP:BTC.D
The ratio of Bitcoin’s market capitalization to the total cryptocurrency market capitalization.
It represents Bitcoin’s market strength relative to altcoins.
USDT Dominance: CRYPTOCAP:USDT.D
The ratio of Tether (USDT) market capitalization to the total cryptocurrency market capitalization.
It helps identify risk-on/risk-off sentiment among investors and assess the level of market liquidity.
TOTAL3: CRYPTOCAP:TOTAL3
The total market capitalization of all altcoins excluding Bitcoin (BTC) and Ethereum (ETH).
It directly reflects the overall momentum of the altcoin market.
Coinbase Premium Index: TradingView Indicator
An indicator showing the price difference of BTC between Coinbase and other major exchanges (e.g., Binance).
It is used to indirectly gauge institutional buying pressure (positive premium) or selling pressure (negative premium) in the U.S. market.
⚙️Interaction of Indicators and Trading Strategies
These four indicators exhibit specific patterns under different market conditions.
By analyzing them comprehensively, traders can identify medium- and long-term trading opportunities.
Correlation between BTC price and indicators:
BTC price vs BTC.D: Complex correlation.
BTC price vs USDT.D: Mostly inverse correlation (USDT.D rising = market uncertainty and BTC decline)
BTC price vs TOTAL3: Mostly Positive correlation (BTC rise = TOTAL3 rise)
BTC price vs Coinbase Premium: Mostly Positive correlation (sustained positive premium = continued BTC uptrend)
✔️Scenario 1: Bullish Phase📈 (Bitcoin-led Rally)
BTC.D rises: Capital concentrates into Bitcoin
USDT.D falls: Increased risk appetite, cash inflows grow
TOTAL3 moves sideways or slightly upward: Altcoins remain weak or unresponsive
Coinbase Premium rises and stays positive: Institutional buying inflow
Interpretation:
Strong institutional buying of Bitcoin drives the market, with capital shifting from stablecoins into BTC.
Altcoins may lag behind this movement initially.
Strategy:
If the Coinbase Premium remains positive even during minor BTC corrections, it favors building long BTC positions.
When the positive premium persists and BTC breaks key resistance levels, it can be interpreted as a strong buy signal.
During early stages, focus primarily on Bitcoin rather than altcoins.
✔️Scenario 2: Strong Bull Market📈 (Altcoins Join the Rally)
BTC.D declines: Capital rotates from Bitcoin to altcoins
USDT.D declines: Ongoing risk appetite and continuous inflows
TOTAL3 rises: Peak momentum in the altcoin market
Coinbase Premium remains positive: Continuous liquidity inflow
Interpretation:
As Bitcoin stabilizes or trends upward, capital starts flowing aggressively into altcoins.
The rise in TOTAL3 reflects broad-based strength across the altcoin market.
Strategy:
Select fundamentally strong altcoins and build positions gradually.
During this phase, large-cap and small-cap thematic groups may experience rotational pumps — monitoring related narratives is crucial.
✔️Scenario 3: Bearish Market📉
BTC.D rises: Altcoins fall more sharply as BTC declines
USDT.D rises: Strengthened risk aversion and increased cash positions
TOTAL3 declines: Deepening weakness in the altcoin market
Coinbase Premium drops and stays negative: Institutional selling or halted buying
Interpretation:
Heightened market anxiety leads investors to liquidate risk assets and move into stable holdings such as USDT.
Institutional selling pressure pushes the Coinbase Premium negative or maintains it in a downward trend.
Altcoins are likely to experience the greatest losses in this phase.
Strategy:
Reduce crypto exposure or convert positions to stable assets (USDT) for risk management.
During technical rebounds, consider trimming positions or cautiously taking short opportunities (with higher risk).
✔️Scenario 4: Sideways or Correction Phase
BTC.D moves sideways: Range-bound consolidation
USDT.D moves sideways: Persistent risk aversion and lower market volume
TOTAL3 moves sideways: Altcoin market remains flat or slightly weak
Coinbase Premium stable: Fluctuates between positive and negative values
Interpretation:
The market enters a wait-and-see phase with sideways movement or mild correction.
The Coinbase Premium’s neutrality reflects uncertainty in institutional capital flows.
Strategy:
Monitor BTC and TOTAL3 reactions at major support levels before re-entering positions.
It may be prudent to stay on the sidelines until clear institutional accumulation or positive catalysts emerge to restore sentiment.
🎯TradingView Chart Setup and Usage Tips
Multi-Chart Layout: Use TradingView’s multi-chart feature to display BTCUSDT, BTC.D, USDT.D, and TOTAL3 simultaneously for comparative analysis. (Apply Coinbase Premium as an additional indicator.)
Timeframes: For short-term analysis, use 1H, 4H, or 1D; for medium- to long-term, use 1W or 1M charts. Confidence increases when multiple indicators align across the same timeframe.
Trendlines and Support/Resistance: Draw trendlines, support, and resistance on each indicator chart to identify key inflection points. Breakouts on USDT.D or BTC.D often signal major market shifts.
Supplementary Indicators: Combine RSI, MACD, or other technical indicators to detect divergences or overbought/oversold zones for added precision.
⚡Analytical Value and Considerations
Comprehensive Market Insight: Analyzing all four indicators together enhances overall market understanding.
Leading vs Lagging Indicators: Coinbase Premium can serve as a leading signal, while dominance and market cap metrics act as coincident indicators reflecting current conditions.
Probabilistic Nature: These indicators are not predictive tools but should be interpreted within a broader context of market variables.
Risk Management: Always apply stop-loss measures and manage exposure carefully. Be prepared for deviations from expected market behavior.
🌍Conclusion
Bitcoin Dominance, USDT Dominance, TOTAL3, and the Coinbase Premium Index are fundamental components in decoding the complex structure of the cryptocurrency market.
Analyzing them in conjunction enables a deeper understanding of market sentiment, anticipation of upcoming opportunities and risks, and the development of a more intelligent and stable trading strategy.
💬 If you found this analysis insightful, share your thoughts in the comments!
🚀 Don’t forget to hit Boost to support the post!
🔔 Follow to make sure you don’t miss the next market insight!
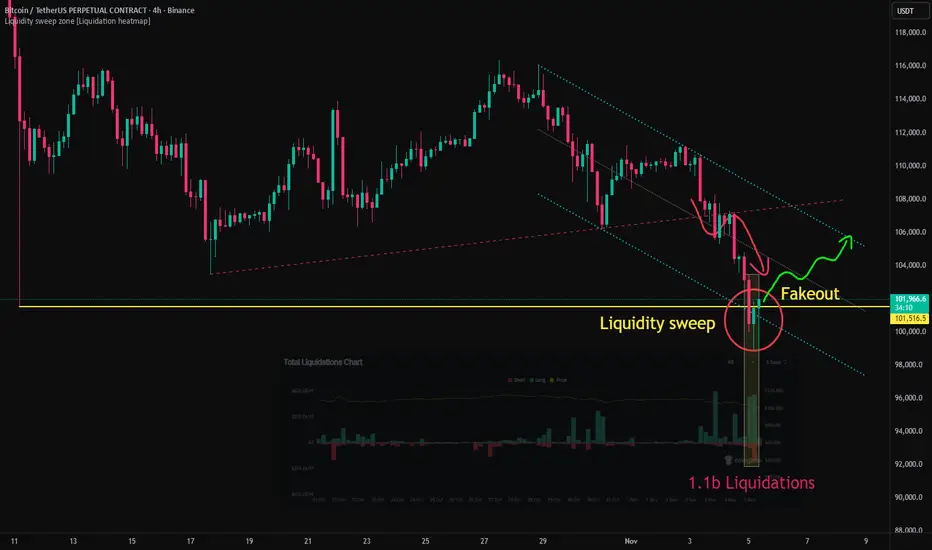
Bitcoin Drops Below 100K, Reversal Signal EmergingAfter breaking below the 107K support level, Bitcoin retested the area and then extended its decline.
As the downtrend intensified, the price broke through 102K, which was the low recorded during the large-scale liquidation event on October 11, and subsequently lost the psychological support level at 100K.
During the eight-hour period of this decline, approximately 1.1 billion USD worth of long positions were liquidated, accompanied by both a liquidity sweep and a fakeout pattern.
The simultaneous occurrence of large-scale liquidations, increased trading volume, a fakeout pattern, and the process of filling the CME gap indicates that multiple short-term reversal signals emerged in this zone.
From a technical standpoint, there is an increasing likelihood of two consecutive bullish candles with long lower wicks forming on the 4-hour chart, while the 12-hour chart also shows a high probability of developing a bullish candle with a long lower shadow.
This suggests a growing possibility of a short-term rebound, with the potential upside target near the upper boundary of the descending parallel channel.
Another quick BITCOIN Daily UPDATE -old chart revisited
I posted this idea on TV at the beginning of October.
Using the W trading idea and / The use of Double Top and / or Double Bottom
We certainly got Bearish side of this idea over that weekend.
And if that support breaks that we currently sit on, then we may well see the lower side of the measured move before we begin to regain confidence.
This could see 88K on a wick down from mid 90K
Sadly, I am avle to also mention that we have printed a mini Head and shoulders and so, a measured move from that could be to around 98K
The Daily MACD
Is in a Descending channel and the lower trendline hits support 2nd week of November
WE do have the possibility of repeating the October PA moves and, as explained in the monthly Candle colout report, this is almost expected now.
Hang in there.
This could well be here to destabilise the market...Get you to run back to FIAT.
December WILL BE DIFFERENT.
But whi knows..NOVEMBER may suddenly turn up and take us all with it....
Just HODL your Bitcoin until we know thongs for Certain.
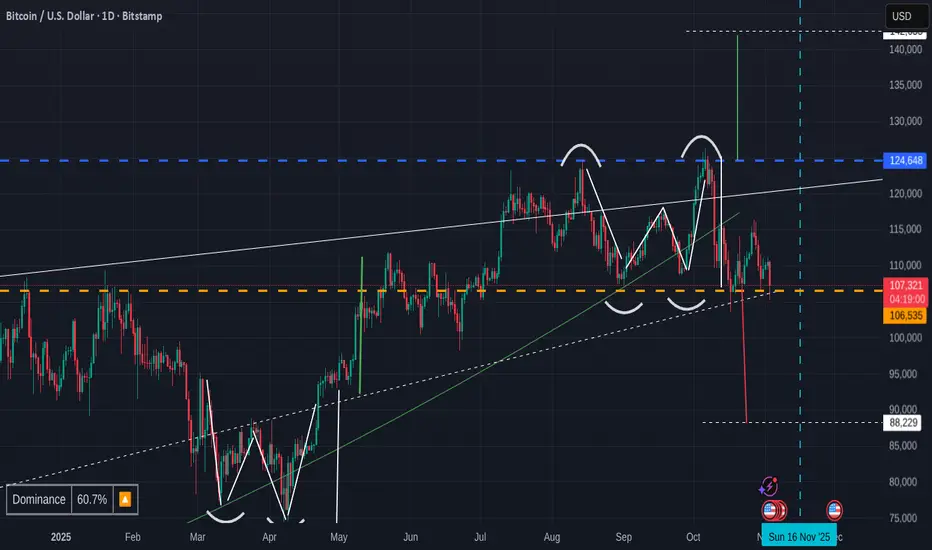
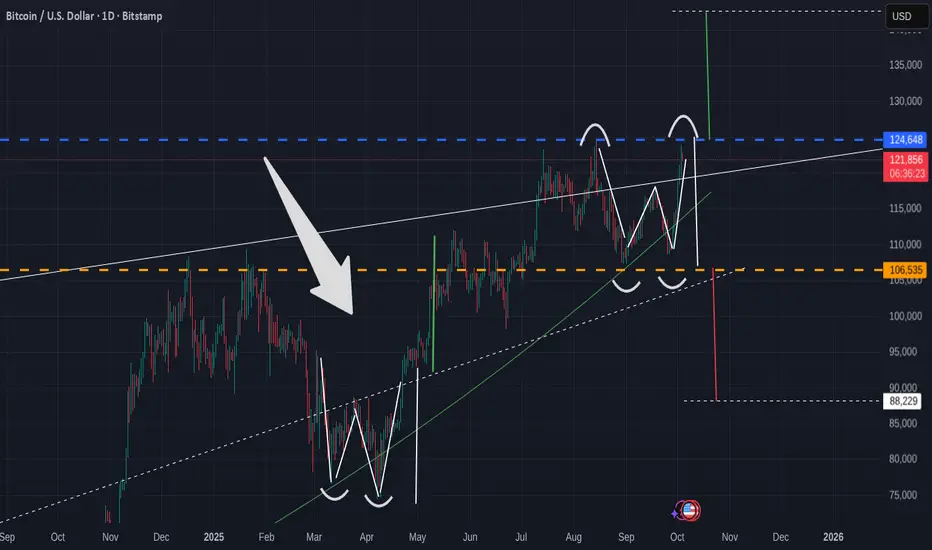
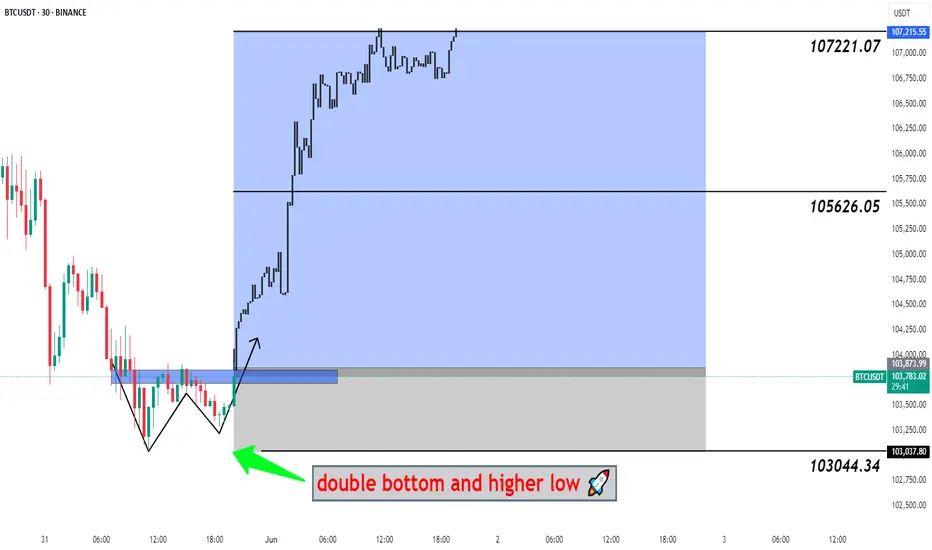
A VERY Bullish sign for Bitcoin but with a possible Warning
A Very simple Bitcoin Daily chart
Obviously, the eye is drwan to the Arrow pointing towards March / April 2025 when Bitcoin PA printed a W patter, or a double bottom.
The Vertical lines show the measured move higher that was executed perfectly.
The question we have right now is, have we just printed another W pattern, with a Measured Move higher to 142K usd
Or Have we just printed a Double TOP with a measured move LOWER to around 88K usd
4 days ago I posted the Monthly Charts and mentioned that we may start October with a Drop, that may last till around 12 - 15 October.
Untill this measured move plays out, I stand by this But I am obviously also open to this not happening.
What ever happens, I have learnt over the years to be ready for BOTH sides of the coin.
I DO have a BUY SPOT order placed for Bitcoin at 92K
IF we get down there,,IF,,,,,It may well be thelast time we get the chance to Buy Bitcoin under 100K
Time will tell
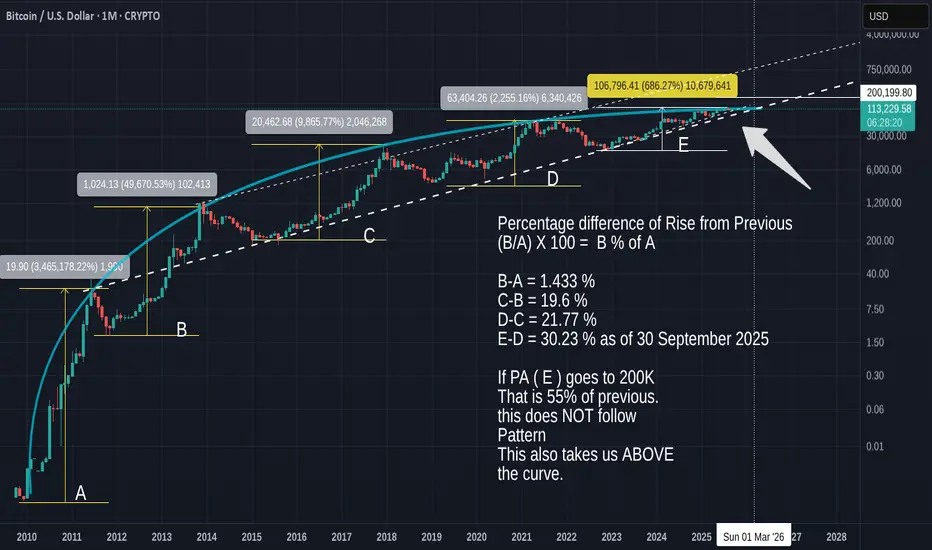
This BTC cycle has a higher % increase in PA than previous cycle
Many people are moaning about how Calm and Lazy Bitcoin is this cycle, all waiting for that mad parabolic push higher to ATH
And it may happen again, though I doubt it.
But as this post shows you, we have had already, a higher % increase over previous cycles
So, what is The % of increase over the previous cycles. Or, How much of the previous increase from Low to ATH was this cycle, in %. The same would be 100%, Half would be 50%
If you refer to the main chart for the letters.
(B/A) X 100 = B % of A
B-A = 1.433 % - The Rose from the Low to the Next ATH was only 1.4% of the previous increase.
C-B = 19.6 %
D-C = 21.77 %
E-D = 30.23 % as of 30 September 2025. A Larger increase that previously.
If PA ( E ) goes to 200K This cycle as many expect, That is 55% of previous increase.
This does NOT follow the last 2 [previous pushes that are in the long term channel of near 20 % on average.
This also takes us ABOVE the curve.
THE CURVE ( Blue) is a part of a Fibonacci spiral that has rejected every ATH since BTC began.
PA needs to rise above this Curve, as you can see, or we get pushed back down.
This Zoomed in Image of the same main monthly chart show this ckearly
PA has been trying to escape this Arc for a Long time now and is struggling a little but with the Strong line of support below, that has NEVER broken, we should be able to cross over and remain above this Arc.
We have till December 2025 before that arc begin to push PA back down in a negative Arc
I have explained in previous posts about this idea but here is the chart
So, the % increase of previous pushes WILL rise further
It has to
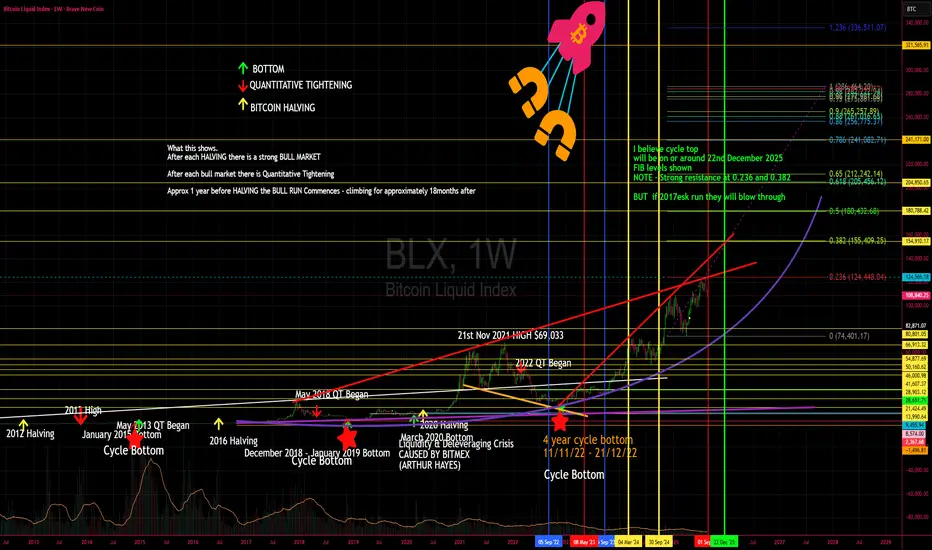
BTC 2017 All Over Again? Is It About to Go Parabolic?Forbes just ran with a headline about a Bitcoin “death spiral.” The wording might be sensational, but the risk they are pointing to is real. It is sitting inside Bitcoin treasuries.
Companies like MicroStrategy (NASDAQ:MSTR) and Nakamoto are being packaged as safe institutional gateways to Bitcoin. The truth is, they are not just buying and holding. They are borrowing, issuing debt, and selling shares to continue buying more BTC. That structure works brilliantly when the price is running higher. When BTC pulls back, the debt remains while the value of the collateral falls. If their share prices sink at the same time, they cannot raise fresh equity. That is when forced selling begins, and the pressure feeds on itself.
This is where the LUNA comparison fits. LUNA collapsed because the system relied on TWAP buying to keep its peg alive. It needed a constant programmed demand. The second confidence cracked that demand disappeared, the mechanism broke, and the whole structure fell into a reflexive death spiral. Bitcoin treasuries carry a similar fragility.
They look strong on the way up because debt and dilution keep the system fed. But if one cracks, others will likely follow, and the forced selling could cascade through the market. It is history repeating in a new form.
The Cycle Overlap
Now layer in the cycles. December 2024 marked the rollover of the 8-year stress cycle in traditional markets. That signal has already triggered. But treasuries are not following that rhythm. They are moving in line with Bitcoin’s 4-year cycle. Every halving is followed by a strong run, a cycle top, and then a correction. That puts the real pressure point into December 2025. If treasuries hit the wall at the same time Bitcoin’s bull cycle peaks, the overlap could accelerate a blow-off followed by a brutal correction.
The 8-Year Stress Cycle (Traditional Markets)
2000 → Dot-com bubble rollover. Fed started cutting rates, but equities crashed hard into 2001–2002.
2008 → Global Financial Crisis. Fed slashed rates aggressively, but markets fell into a full-blown meltdown before recovery. 2009 was the brutal washout before recovery.
2016 → Global growth scare, China devaluation, Fed hiking cycle wobble. Markets pulled back, stress showed, then liquidity stepped in.
2024 → December rollover. The signal of cracks returning: inflation sticky, rate cuts being prepped, credit stress building, and leveraged players under pressure.
The pattern - every 8 years, traditional markets hit a rollover point where stress shows up, liquidity shifts, and the system resets.
The 4-Year Bitcoin Cycle
2013 → Top after 2012 halving, deep correction.
2017 → Top after 2016 halving, brutal correction in 2018.
2021 → Top after 2020 halving, correction in 2022.
2025 → Halving cycle points to a top window in December 2025, with correction risk into 2026.
Where Tether Fits
Tether (CRYPTOCAP:USDT) is not just minting stablecoins. It has become one of the largest buyers of short-dated US Treasuries on the planet, with more than 120 billion US dollars worth on its books.
In calm conditions, that makes sense, they clip yield and backstop redemptions. But if markets crash and liquidity dries up, redemptions spike. To meet them, Tether must raise dollars by selling or repo’ing those T-bills. Normally, that is seamless. In stress, selling can add to liquidity drains at the edges of both the Treasury market and crypto. If redemptions surge at the same time treasuries are being forced to sell BTC, you get a double liquidity squeeze.
The Technical Picture
Look at the Fibonacci structure on the chart. The key levels line up with what could be a wave 3 of 3 in Elliott Wave terms — the most explosive part of any trend. That explains the sharp upside move this year. It is powerful, but it is also the phase where leverage and euphoria get stretched the furthest. If this lines up with treasuries cracking and Tether redemptions spiking, the volatility on both sides will be extreme.
2016–2017 vs 2024–2025
In 2016, traditional markets were rattled by China’s devaluation, an oil price collapse, and Fed policy missteps. Liquidity reset the system. For Bitcoin, that reset coincided with the halving and set up the most explosive run in its history. By 2017, equities were making new ATHs and Bitcoin went parabolic to nearly $20k before the brutal 2018 correction.
Now in 2025 we are seeing the same setup. Stress triggered in December 2024, but liquidity is flowing back. Markets everywhere are hitting new ATHs. Bitcoin has surged and is acting like it is in its 2017 phase right now, the blow-off leg of the 4-year cycle.
That puts the risk squarely into December 2025 for a cycle top followed by a correction.
The Cycle Top Target
I believe the cycle top for Bitcoin will land on or around 22nd December 2025.
The Fibonacci levels line up cleanly with this window:
Strong resistance at 0.236 and 0.382.
Under normal conditions, these zones would cap the move, but if we are truly in a 2017-style run, price can blow straight through them in a parabolic surge before the eventual correction. Fibs left on the chart for reference.
Key points
BTC treasuries are leveraged and debt-loaded.
Many treasuries exist, not just one, so cascades are possible.
December 2024 = 8-year rollover in traditional markets.
December 2025 = 4-year BTC cycle top window.
Tether can flip from stabiliser to amplifier if redemptions rise.
Fibonacci shows a potential wave 3 of 3, explosive but unsustainable.
2025 mirrors 2017: markets at ATHs, Bitcoin in parabolic mode.
Target: 22nd December 2025 as the likely top.
Stop losses and capital protection are critical.
It looks like BTC 2017 all over again.
The parabolic phase may not be finished yet, but the closer we get to December 2025, the sharper the risk of a brutal correction. This is not Bitcoin dying. This is a test of leverage and liquidity. If treasuries and Tether both get squeezed into the cycle top, the correction could be brutal. But as always, it will clear the field for the next 4-year cycle if you survive the next brutal 2026 BEAR Market.
Thanks for Reading, and please let me know your thoughts
<3 Lisa
BTCUSDT - What next ?? We can see a retest of 111k7 level, but bitcoin was not successful in closing above it.
111K7 continues to remain as our area of interest for now. Closing above which we will change bias.
For now bitcoin is still bearish....
Happy Trading!!!

Interesting Fib retrace info could help understand the next bear
Nessy chart initily but I have broken it down here and it will be easy to understand
Also, to make it ckearer to see, I have used a line for the PA..the retracements and % pull backs are accurately placed using the candles....
So, an interesting thing appeared when I was laying with Fib Replacements.
Simply put,
From 2013 ATH to the next Low was a -78.27 % pull back to the 0.236 Fib retracement
From 2013 ATH to the next Low was a -82.20 % pull back to the 0.382 Fib retracement
From 2013 ATH to the next Low was a -76.40 % pull back to the 0,5 Fib retracement
So, after each ATH, PA pulled back to the next step down from previous fib retracement, while pulling back approx the same %
Shuold Bitcoin do the same again, whichh would Scare a Lot of people, we could expect to see a pull back to the 0.768 Fib retracement...and using a near -80 % pull back, we would end up around 24K Low in Nov 2026
Will this happen ?
Who know and I doubt it but until things and patterns change in the way Bitcoin runs its 4 year cycles, then it is a possibility.
But I found it fasinating how yet anoterh sequence occured in the last 3 cycles that Bitcoin has performed.
Nothing else has ever done this.....
So, Lets see if it repeats

Bitcoins has slipped back under Long Term resistance. CAUTION
It is VERY clear to see and some just do not want to see it
That Blue Arc, Arrowed, is an Arc that has rejected EVERY ATH since Bitcoin began rising from its early Low.
And also understand, that arc is not just a random line, It is Calculated and is part of a Fibonacci Spiral.
ANYWAY, as we can see on the chart. PA is heading to a Squeeze with this Arc and a rising line of support below.
This line of support has NEVER failed since PA crossed over it.
So we have a n arc of Resistance that has Never been broken.
We have a line of support that has Never been Broken.
One of these two line Has to break.
The Apex of this Squeeze us Dec this year and, as we all know, PA always react before the Apex.
So, How accurate is the placement of this Arc ?
Lets see the Daily chart
Here we can see that PA has for most of this year, been trying to break over and, in July, succeeded, only to fall back below a week ago.
To many extents this played along Very well with the monthly Candle Colour patterns I been posting.
But the fact remains, we are once again BELOW a HUGE powerful line of resistance that we MUST break above and stay above.
We do have many lines of Support below, Local and some, longer term.
We can close on the 4 hour just to see where we are in a more local time frame.
Here, we can see that 105K is a very possible line of support initially that we need to watch and see what happens. Hopefully, we range above this level and let RSI cool off.
The RSI is always a great gauge to watch here and the daily offers some hope of remaining in this current PA range
It must be said that RSI could still drop lower, though we have room to rise before PA becomes OverBought on the Daily.
But the weekly shows us a longer term CAUTION flag.
While we have not been OverBought on the weekly for a long time, we ARE up high, leaving the potential for a Drop.
But with the Daily in good shape, this could be postponed. In this cycle, previous times we got overbought, PA ranged while RSI dropped.
This could repeatover and over........But PA needs to rise OVER that line of resistance and turn it into Support.
This is NOT a choice//it is a MUST HAPPEN if Bitcoin is to continue its rise higher.
The current Price line of this Blue Arc is around 116K.
What we realy need to understand about this Arc is that once we pass December 2025, that arc begins to DROP.
And if PA is below it still, PA will get dragged down with it, into an ever decreasing price model.
So, there we have it
Simple as that.

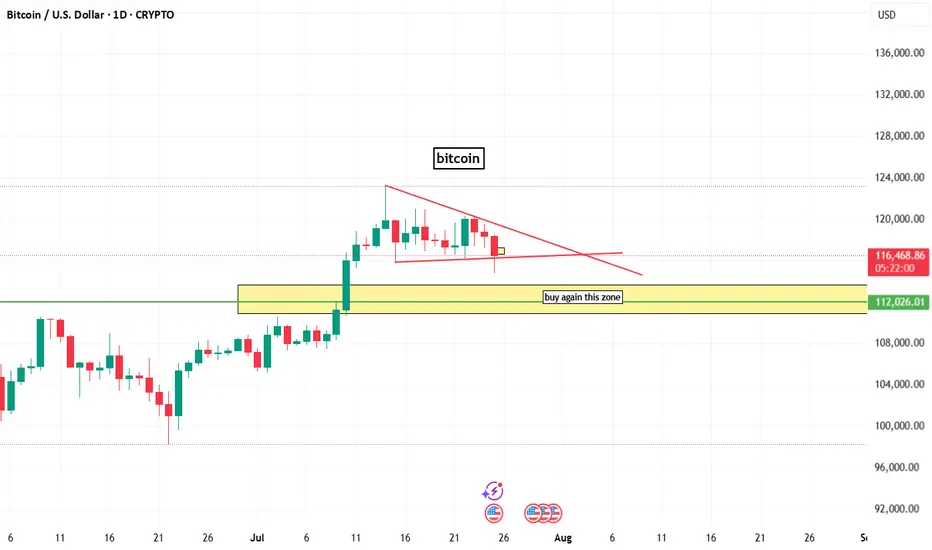
bitcoin chart analysisbitcoin chart analysis on daily time frame
here a buy zone that indicated by box and line.
and on chart bitcoin bullish but lower time frame btc is berrish.
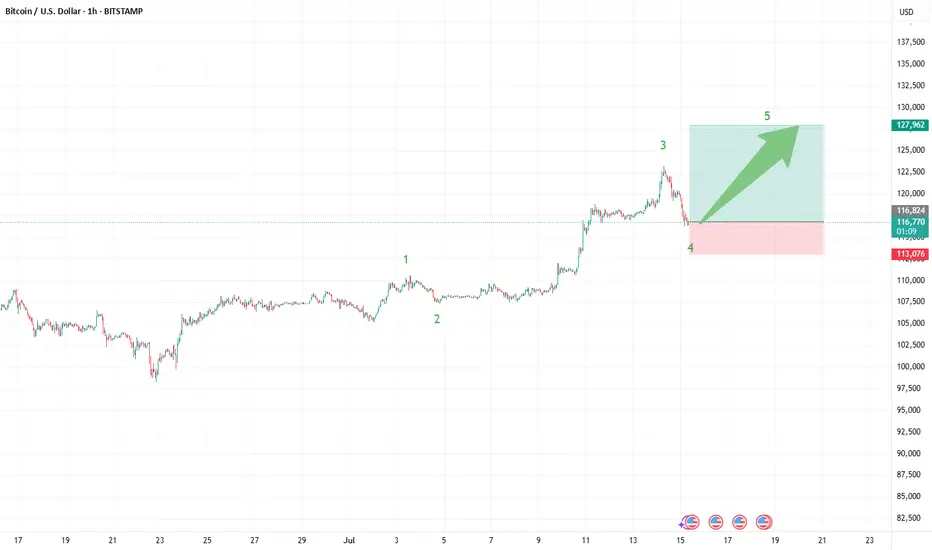
Bitcoin (BTCUSDT): Trade Wave 5—Next Stop $127,000?Bitcoin’s current structure is lining up for a classic Elliott Wave fifth wave scenario, and the setup could offer a high-reward trade as we look for a measured push toward the $127,000 area. Here’s what’s standing out in the recent price action:
What the Current Structure Shows (Primary Scenario)
Wave 4 Correction Complete: After peaking in wave iii near $124,000, BTC pulled back and has potentially completed a wave iv correction. Price respected the Fibonacci retracement zones bouncing near the 38.2% retracement at $117,116.
Preparing for Wave 5: With support confirmed, price action is stabilizing and looks primed for a final motive push—wave 5—to the upside. The target projection for wave 5 is around $127,000, in line with both the 61.8% extension of the previous swing and the common equality projection for wave 5 vs. wave 1 when wave 3 is extended.
Why the Count Is Labeled This Way
The advance from early July kicked off with impulsive movement, subdividing cleanly into smaller waves that align with classic Elliott structure.
Wave iii is the clear standout—steep, extended, and carrying most of the move’s energy, which checks the box for a strong third wave.
The cluster of Fibonacci and previous resistance/support near $127,000 offers strong technical confluence for the next objective.
Trade Setup: Riding Wave 5 to $127,000
Entry Zone: Consider longs on breakouts above the current consolidation, ideally after confirmation of support holding near $117,100–$116,000.
Stop Loss: Place stops just below $113,300 (the 61.8% retracement), or tighter for risk management depending on your position size and timeframe.
Target: $127,000—where wave 5 projects to equal the length of wave 1 and aligns with multiple Fibonacci targets.
What to Watch Next (Confirmation or Invalidation)
Confirmation: An impulsive move above the interim high at $120,000–$121,000 with strong volume would confirm wave 5 is underway and that bulls have regained control.
Invalidation: A break below $110,500 would invalidate this setup and suggest a more complex correction is taking shape.
Final Steps: Monitor for impulsive character in the rally—wave 5s can sometimes truncate, so don’t get complacent at resistance.
Alternate Count
If price fails to hold support and breaks down, BTC could still be in an extended or complex fourth-wave correction—possibly a running flat or triangle—before wave 5 eventually resumes.
Bitcoin Faces Impending Drop to Mid-30,000sAs of July 02, 2025, Bitcoin’s price chart, crafted by "RoadToAMillionClub" on TradingView, paints a concerning picture. Currently hovering at $107,831, the cryptocurrency appears to be teetering at the edge of its upper channel, signaling potential trouble ahead. The recent 0.51% dip may be just the beginning of a more significant decline.
The long-term upward trend, marked by a supportive orange line since 2018, has been a beacon for bulls. However, the green trend line projecting a drop toward the mid-30,000s range, around $37,932, suggests a looming correction. This level, a historical support zone, could become the next battleground as selling pressure mounts.
Market indicators point to overextension, with the price hitting a 4-day and 14-day high of $107,831 before the recent pullback. The speculative fervor that drove Bitcoin to these heights seems to be waning, increasing the likelihood of a bearish turn. Investors should brace for volatility, as the cryptocurrency may struggle to maintain its current altitude, potentially sliding toward the mid-30,000s in the coming months.

#BTCUSDT Big Pump Next Hour - Bitcoin, BTCUSD, BTCUSDT 📉 Double Bottom Pattern Forming – Potential Reversal Setup
The current price structure is showing signs of a Double Bottom – a classic bullish reversal pattern. After an extended downtrend, this pattern suggests that the market may be preparing for a trend reversal from this key demand zone.
🔹 Trade Setup
Entry, Targets, and Stop Loss (SL) are marked on the chart.
Entry: Upon breakout confirmation above the neckline.
Stop Loss: Just below the recent swing low to manage downside risk.
Targets: Calculated using the measured move method from the bottom to the neckline .
🔹 Risk & Money Management (Professional Approach)
To maintain consistent profitability and protect capital, strict risk management is essential. For this setup:
🔸 Position Sizing: Based on a fixed % of total capital (typically 1–2% of account equity per trade).
🔸 Risk-to-Reward Ratio: Minimum of 1:2, ideally higher.
🔸 Stop Loss Discipline: No arbitrary changes after entry. SL only adjusted for breakeven or trailing stops once price moves favorably.
🔸 Trade Management: Secure partial profits at key levels, trail stops as structure forms.
🔸 Capital Allocation: Avoid overexposure. Trade fits within overall portfolio strategy.
💬 Let the setup come to you. React, don’t predict.
🔁 Like, comment, or share your thoughts below!
BINANCE:BTCUSDT BITSTAMP:BTCUSD COINBASE:BTCUSD BINANCE:BTCUSDT.P INDEX:BTCUSD CRYPTOCAP:BTC.D CRYPTO:BTCUSD BYBIT:BTCUSDT.P BINANCE:BTCUSD
BITCOIN - under resistance since 2011-Birth of a new cycle soon
The Chart Clearly explains itself
Since before Bitcoin PA went into its current channel, it was under a Huge Arc that resisted any move higher...strongly, Every single ATH, Every one, even the most recent
This is Easily seen by the Blue Arc
And as you can see, maybe THIS is the real reason why PA is struggling to break higher....It just cannot break over that Arc.
The main chart is Monthly, Lets look at the weekly.
You can clearly see what happened in 2021, rejected twice and again this cycle.
And you can see how, by December This year, 2025, PA will be squeezed very tight.
And PA usually moves before the APEX>
And, if we are going to repeat the previous cycle moves, the 1st year after a New ATH usually sees a decline in price, as can be seen by the red boxes.
But PA needs to break OVER that Arc first. and then remain ABOVE IT.
This would then create a new cycle pattern.
And we need it.
Currently, we can go back to Lows of 88K before we loose support on that lower trendline but from there, we need to break over.
A Strong move in SEPTEMBER / OCTOBER would be Ideal
Just saying

Bitcoin Monthly Candle Colour Close since 2011 - looking forward
May Closed GREEN, and We are currently on a Very small Green candle for the month open.
Last month, in this series of monthly charts posts, I mentioned this..
"On only 2 occasions have we had a GREEN JAN, RED FEB, RED MARCH, GREEN APRIL
And Both of them were on the way to ATH. ( Arrows )
On both those occasions we had a GREEN MAY, though the gains were minimal and one was followed by a Green June and the other by a Red June."
And we just closed May with a minimal GREEN candle.
This is important to understand, This month, we have a 50/50 chance of repeating the Green June candle in this pattern.
Outside of this pattern, The previous MAY closes, 7 Green to 6 Red.
Of the 7 Green, 5 were followed by a Green June
With this, we have a higher % chance of a Green June
Of All previous June Closes, we had 7 Green to 6 Red.
Of those 7 previous Green June Closes, 3 were followed by GREEN July
Of the 6 previous RED Junes, ALL were followed by GREEN July
With this in mind, we maybe in a better position if we did close June with a small RED candle, as we did in the 2020 sequence ( right hand Arrow)
Should we close June RED, I will then expect a fairly level summer period with PA beginning to start moving again around September / October
Bitcoin PA is in an excellent position to move higher now though. It is also in an excellent position to move away from previous cycle patterns and begin creating new one.
We do have to remain vigilant as markets are moving everywhere and Macro conditions could change rapidly
But the one thing that seems to remain static is that it is a VERY GOOD IDEA to Buy Bitcoin and HOLD IT

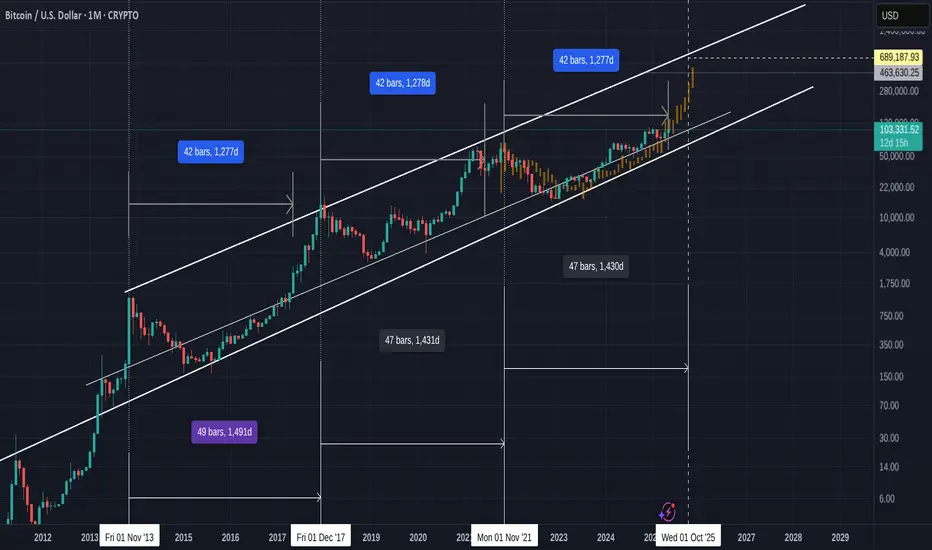
Bitcoin could be SO close to take off - certainly shows Strength
Before we go anywhere with this, we MUST remember that a "TREND LINE " requires a minimum of 3 points of Contact to make it Valid. The more points of contact the better.
All of these Trend lines in this chart are therefore Valid.
But what needs to be questioned is maybe the PA trend between the lines......
And because of the Scale of this, we are using only 2 past Factual data sets and one expected.
So NOT a confirmed Trend
But I shall continue anyway as there are a number of things that make this idea a possibility.
So, on the chart we have the Upper and Lower day counts.
The Lower is number of days between ATH
2013 -> 2017 = 1491 days
2017 -> 2021 = 1431 days
2021 -> 2025 = ...............Expected anytime from October to Dec. This is IF we follow the "pattern"
50 day difference between the 2 sets of Past data
The Upper day count uses just ONE data point from the 2013 -> 2017 cycle. It is from the ATH to when PA made the BIG move to begin the climb to ATH. That was around 1277 days after the 2013 ATH and you can see the candle that rose off that line of support was substantial.
As many of you know, I am firmly in the belief that this run is mimicking the 2013 -> 2017 run in many ways
So, The same day count takes us past the First 2021 ATH, which I have always said was a "False" ATH in that PA was driven High, to early, by leveraged and hopeful gains.
However, if you look at the distance from the end of that day count to when the ATH was reached, it is similar to the 2017 ATH
So if we Project that same day count onto current PA, THIS MONTH is the month for take off.
And again, See the difference between the end of the day count and the projected ATH daye.
Similar to previous occasions.
This is also reflected on the Fractal, that arrives on the upper trend line in November.
One thing that makes me hesitate a little here is the projected ATH Price of Near 700K USD.
I am not sure that is going to happen....And so we wait to see what happens.
But I will watch this and see where we go
I have pointed out in another chart, how Bitcoin PA is under a Very long time Arc of resistance and this could be in play and if so, This chart Will become invalidated.
We Wait to see
Bitcoin is still following 2017 run. Surprising things to see
As many of you know, I have been referring This cycle of Bitcoin to that of the 2013 ->2017 bull run. And while PA has Fallen off and below the Fractal itself, we do still have one Very Major thing to see and it is a Good one.
So, the chart above has an arrow. This is pointing to Sep, Oct, Nov 2024.
See how PA pushed up to the "Neckline" of the Range and got rejected for 2 weeks.
A Red then Green Candles, on or below that "Neckline" and then Off it went.
We are currently just below the "Neckline" of this Range and we are currently printing a Red candle. It is early days but maybe we will repeat the same pattern.
There are reasons that I have explained in an earlier post today, that point towards a possible Red candle this week.
The other thing I want to show you on this subject is the MACD
This is a Daily MACD ( the main chart being Weekly) But while the actual PA of the MACD is different, I want you to see the Histogram. The Histogram shows us the % Difference between the MACD line ( yellow) and its Signal line ( Red)
Have a look at the the similarity the histogram pattern in 2024 ( arrow ) compared to this period Now.
The Large green Climb from a Low, the fall, the new smaller climb, the drop to Red and then a push higher.
OK, so the scale is different but, to me, it shows a similar pattern to the previous end of Ranging period.
We need to see if this pays out. If so, we will see a Red Histogram for a while..
This ties in with the ideas presented above on the PA patterns.
But overall this cycle, we do seem to be repeating patterns in a broad sense, with a larger scale currently. The larger scale of thispossible Red Histogram also plays into the idea mentioned at the end of this post.
So , what is the connection to the 2013 - 2017 Cycle.
Look at the upper trendline that has rejected PA since 2024. This is an OLD line of resistance from before 2017...
Lets look at a zoomed out chart
Look at that Arrow on the Left and that trend line.
It is the SAME LINE - Not only that, it rejected PA twice in late 2016 and 2017, before PA broke through and went on to reach a new ATH
So, Having seen this, I am happy to believe that we ARE Still following that 2013 -> 2017 Cycle pattern.
True, PA has fallen below the Fractel but we do seem to be repeating the Trend line Rejection, Dip, Rejection and........
You can also see how this same trend line, once crossed, is extremely strong support - infact we did not drop back below until July 2022, after another ATH
BUT, as ever, I look to BOTH sides and there is a chance we may see a stiffer rejection, IF we get rejected here again.
Should events dictate a further Drop in PA, we may see PA return to the next trend line below, around 82K. ( remember that Red Histogram pattern I mentioned earlier )
While this would Scare many, it would still play into the pattern we have been seeing.
2024 saw 3 major Rejections off its Neckline.
We have had 2 so far in 2025 and we are there right now, waiting to see what happens, with a RED candle. A Drop back to 82K would also reset the Daily MACD very nicely.
I remain Cautious and Bullish
what ever happens in the short term, I have little doubt about further pushes higher, maybe a LOT higher
