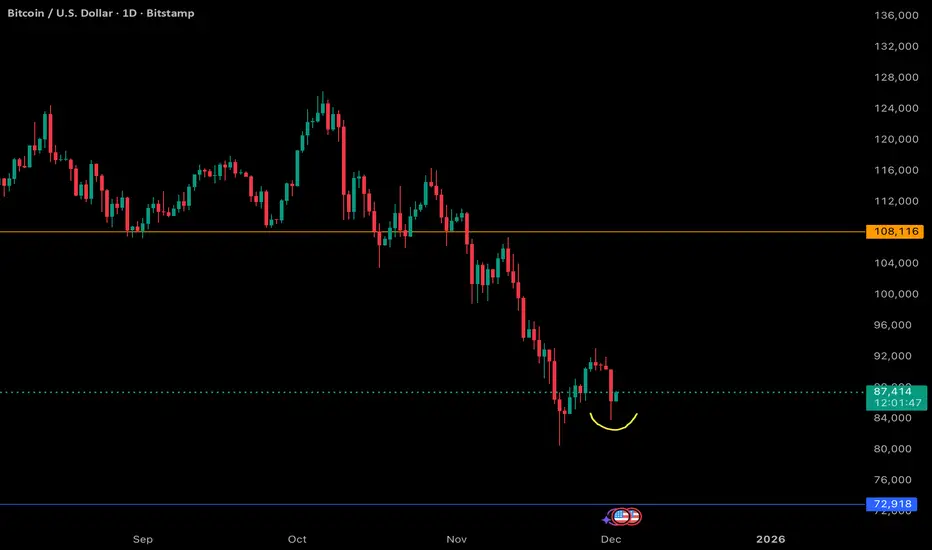
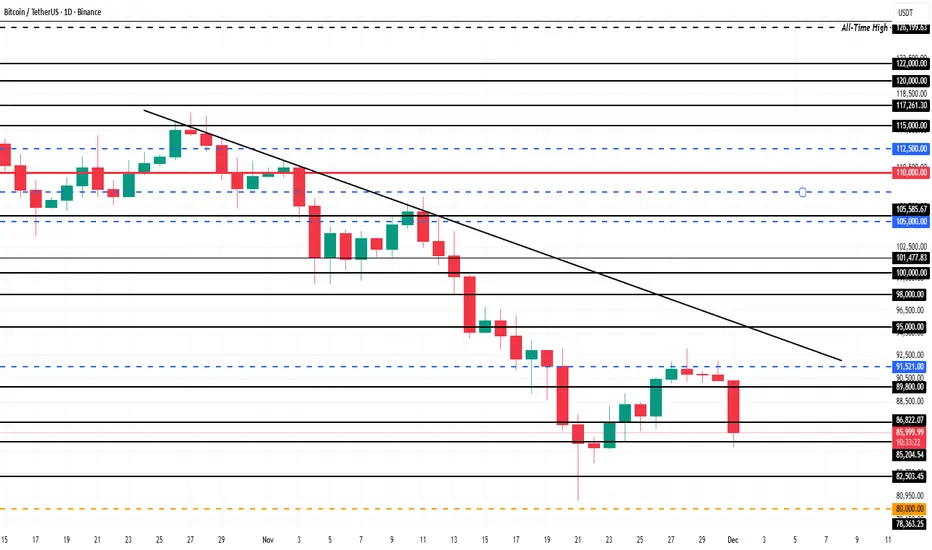
BTC Showing Bullish Structure After the Dump - Dec 2 UpdateBTC’s latest reaction is quietly strong and more bullish than it may look at first glance. After the sharp drop, price immediately found demand and has now put in a clear higher low relative to the recent capitulation wick. That yellow-curved region on the chart highlights a key shift in behavior: sellers pushed hard, but buyers stepped in earlier than before, defending higher levels and preventing a retest of the prior lows.
This is the first meaningful sign of structure forming after weeks of one-sided downside. A higher low is often the earliest signal that the market is transitioning from liquidation-driven selling into accumulation. It shows that bidders are becoming more aggressive, absorbing supply before it can revisit deeper support.
On top of that, BTC is holding above the local support band that previously acted as resistance. Flipping that area into support and then defending it is a strong indication of emerging strength. The current reaction has less volatility, fewer long wicks, and more controlled candles, which typically points to absorption rather than panic.
While the trend hasn’t fully reversed yet, this kind of price behavior is how bottoms and mid-cycle resets form. BTC is starting to build a constructive base, and the market is showing the first bullish structural clue it has printed in a few days.
Bitcoinprice
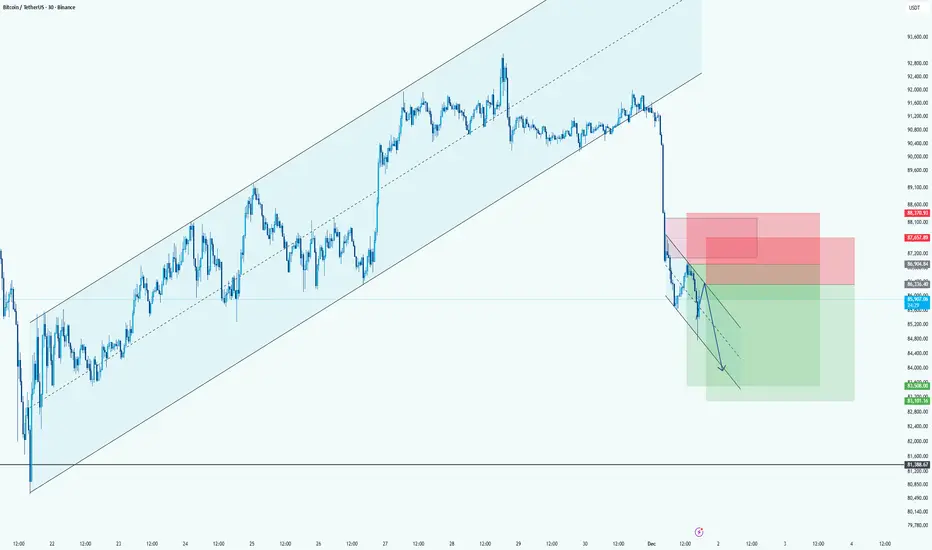
BTC: Bearish Continuation Setup After Major Channel BreakdownHi!
Price broke hard below the long-term ascending channel, confirming a clear shift from bullish to bearish momentum.
After the breakdown, BTC is moving in a small descending correction channel, creating a classic lower-high retracement toward supply.
Direction: Short
Entry Area: 87,200 – 88,300 (two stacked red zones)
Stop-Loss: Above 88,700–89,000 (top of supply)
Target: 83,000 – 84,800 (large green demand area)
Bitcoin - The only 100% probability setup!🔪Bitcoin ( CRYPTO:BTCUSD ) will drop -40% very soon:
🔎Analysis summary:
If we just take a look at previous cycles, Bitcoin is already starting a major -40% correction. If we then also take market structure and price action into account, this becomes a 100% probability setup. The next clear crypto bearmarket is starting right now.
📝Levels to watch:
$100,000
SwingTraderPhil
SwingTrading.Simplified. | Investing.Simplified. | #LONGTERMVISION

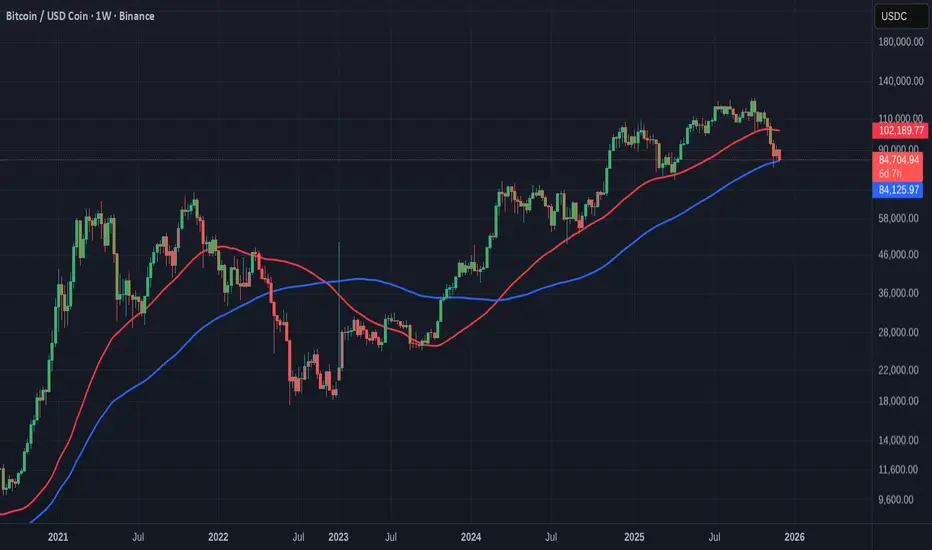
Really Simple Clue to "Is Bitcoin in a BEAR or BULL"
It is as simple as this.
If PA falls below that BLUE 100 WEEK SMA, Bitcoin is in a BEAR
While we remain above it, we have Hope of returning back to a BULL RUN
The RED line is the 50 Week SMA, which was the first warning Shot.......
We will find out this month I hope.........................
How to Build a Consistent Execution Checklist on TradingViewMost trading mistakes don’t come from bad strategy, they come from inconsistent execution.
An execution checklist removes guesswork and replaces it with structure.
When your actions follow a routine, your results stabilize.
TradingView gives you everything you need to build a checklist that stays visible, actionable, and tied directly to your chart.
1. Define Your Core Conditions
Before any trade, the bigger picture must be clear.
Start your checklist by answering three questions:
What is the higher-timeframe direction
Where is price relative to key levels
Is price approaching with strength or weakness
Use TradingView’s drawing tools to mark support, resistance, value zones, and session highs and lows.
Add a simple text note on the chart listing your core conditions so they are always visible.
If the market context fails this first screen, the trade is already invalid.
2. Build Confirmation Criteria
Once structure is confirmed, you move to evidence.
Mark confirmation areas directly on your chart:
Liquidity pools
Fair value zones or imbalances
Previous session highs and lows
Asian range or New York open
If your strategy uses indicators, document exact conditions:
Moving average position and slope
Volume behavior
VWAP location
Volatility expansion or contraction
Define rules that don’t change based on emotion.
Confirmation should prove your bias, not justify your urge to trade.
3. Validate Risk Before Execution
Every setup must survive a risk checkpoint before it’s allowed to go live.
Your checklist must answer:
Where is my invalidation level
How much capital am I risking
Does this violate any daily limits
Is the reward worth the risk
Use TradingView’s long or short position tool to visualize risk directly on the chart.
Save it as a template so your risk process stays uniform across all trades.
No trade is valid if risk isn’t clean.
4. Create a Pre-Execution Routine
A checklist only works if you actually follow it.
Add a short pre-trade process directly to your chart notes using checkboxes or bullet points:
Example execution checklist:
Market phase confirmed
Level identified
Confirmation present
Risk valid
Entry condition active
Walk through this list before clicking buy or sell.
If one item fails, the trade fails.
Over time, this routine removes emotional impulse completely.
5. Review and Refine Weekly
Your checklist isn’t static, it evolves.
Every week ask:
Where did I break my rules
What conditions led to losses
Which confirmations work best
What rules saved me from bad trades
Use TradingView’s trade replay and journaling features to review execution quality, not just profit.
Consistency improves when your system evolves with you.
Final Thought
A checklist doesn’t restrict your trading, it frees you from emotion.
When your process is clear, your confidence increases.
When your confidence increases, discipline follows.
Good traders make decisions.
Great traders execute procedures.
Stay Green!
Bitcoin Daily Heiken Ashi does not lead to short term confidenceBitcoin Daily Chart showing VRVP on the right. The lines mentioned below can offer Resistance, Support.
Horizontal Dashed Yellow - Value Area High VAH currently around 128K usdt
Horizontal Dashed Red - Value area Low VAL currently around 95K usdt
Horizontal Dotted Red line - POC, Point of control currently around 110k usdt
Horizontal Dashed Blue line - Current ATH
The Red diagonal "line " is part of a 236 Fib circle that often provides strong resistance and, on this occasion, has rejected Pa ever since the current ATH.
PA is getting Squeezed between this and that 2.414 Fib Extension, forming a pennant with an apex around 4 Dec.
PA ALWAYS REACTS BEFORE THE APEX so I do expect a sharper move from PA by the end of the 3rd Dec.
The possibility does exist that the Bulls will make a stand and PA, rarely, may just range through this but that would then, at least , take us to the other side of that Fib circle and Offer hope that we Remain above that circle.
But, For me, I am sideing with a Drop lower, maybe to that next Fib Extension at around 78500.
This will scare some people and knowing the direction after that is hard to tell.
As yet, I have not seen many signs of short term recovery But..........
The Daily MACD is VERY OverSold and has the room to recover.
But shorter Term, the 4 hour MACD is still falling BEARISH and has room to drop further
.
So, as mentioned in a number of posts, This month is the KEY to telling where we are...Bull or BEAR.
But I think dynamics have changed and the time ay have arrived were we look at Bitcoin PA in a different Way
We Wait.......
This is Bitcoin

BITCOIN GET READY FOR MASSIVE HIGH PROBABILITY BULL MOVE SOON!!!🚨 BITCOIN HIGH PROBABILITY BUY SETUP 🚨
* Here We Can See Clearly The Next Potential Moves For BTCUSD Coming Hours/Days.
* Keep Your Eyes Close On Your Trading Positions.
* Happy PIP Hunting Traders.
FXKILLA.

Bitcoin Price Falls To $86,000; Will It Shake Out Weak Hands?Bitcoin is trading at $86,005, holding just above the $85,204 support level. The asset remains trapped under a persistent downtrend that has lasted more than a month. This would preventing any sustained recovery attempts.
If market conditions worsen or short-term holder selling accelerates, Bitcoin could break below $85,204. A drop through this support would expose the price to $82,503 and potentially deepen losses as fear rises across the market.
However, if buyers step in and support strengthens, Bitcoin could reclaim upward momentum. A bounce from current levels could send BTC toward $89,800. A decisive move above that resistance would be essential for Bitcoin to retest $90,000 and invalidate the bearish thesis.
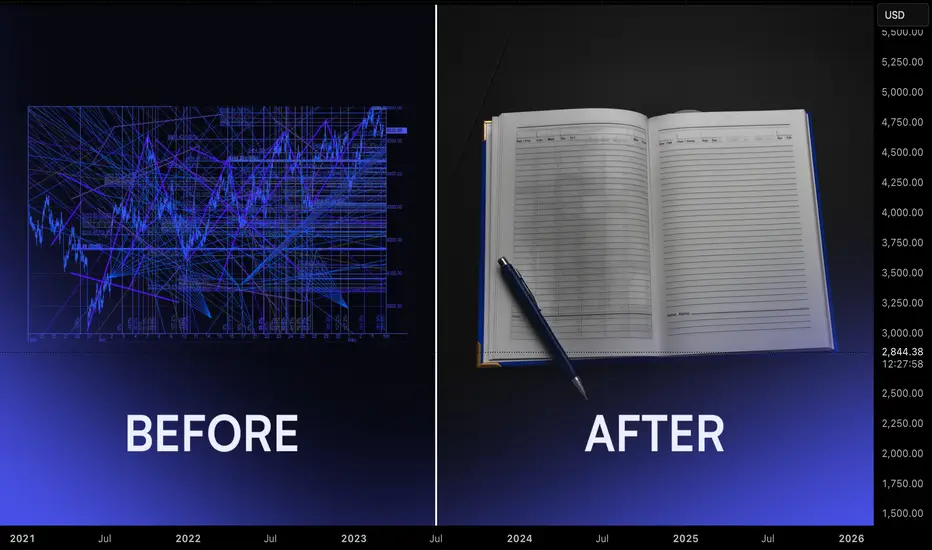
Journaling For Traders: Turning Random Results Into A Feedback Most traders spend years tweaking indicators and strategies while leaving their process undocumented. Without a journal, every trade feels new, every mistake repeats, and progress stays vague. A structured journal turns experience into data. It shows what you do well, what keeps failing, and which behaviours appear before your best and worst decisions.
The first step is simple: record every trade. Log the setup, market structure, entry reason, risk, and emotional state. Write whether you felt rushed, confident, bored, or frustrated. Do not only record wins or big losses. Incomplete data keeps blind spots alive.
The real value appears during weekly review. Set time aside after markets slow down and go through the trades as a batch. Look for recurring situations. You may notice that late-session entries perform poorly, that you increase size after wins, or that you cut trades early when size feels uncomfortable. These patterns are not visible inside a single session. They emerge only over a cluster of trades.
Next, extract insights. Group trades by setup, session, and emotional state. Identify your highest quality combinations. For example, trend continuation trades in London with fixed risk might show a strong performance profile while countertrend entries in low volume hours consistently underperform. This step separates what you think works from what actually delivers.
Finally, adjust strategy. Turn observations into rules. Reduce or remove the behaviours that repeatedly drain capital. Formalise the conditions that define your best trades. Add small process rules rather than full rewrites, then track the impact in the next review cycle. Over time, your playbook becomes evidence based rather than theoretical.
Journaling is not an extra task for perfectionists. It is the operating system behind professional execution. When you continuously record, review, extract, and adjust, your trading process compounds in quality even when individual weeks are difficult.
BTC Dip Resilience: A Healthy Pullback Inside Structure - Dec 1 BTC is dipping again today, but the price action remains orderly and far from bearish breakdown territory. Despite the volatility, BTC continues to hold above the previous cluster of local lows, preserving its higher timeframe structure. More importantly, price is still sitting comfortably within a key support band that has acted as a demand pocket throughout this entire consolidation phase.
The market has not shown any signs of structural damage. Sellers pushed into support, but so far there has been no follow-through or momentum shift that would indicate trend exhaustion. Instead, the reaction looks controlled, with buyers stepping in each time price revisits this region. This kind of behavior usually reflects absorption rather than weakness.
In the bigger picture, this is the type of pullback you expect during a mid-cycle correction: sharp enough to unsettle sentiment, yet technically intact and anchored by strong underlying demand. Until we see a break beneath those prior lows, the path of least resistance remains upward.
Overall, the chart still leans bullish. The current dip is behaving like a constructive reset, not the start of a deeper unwind.

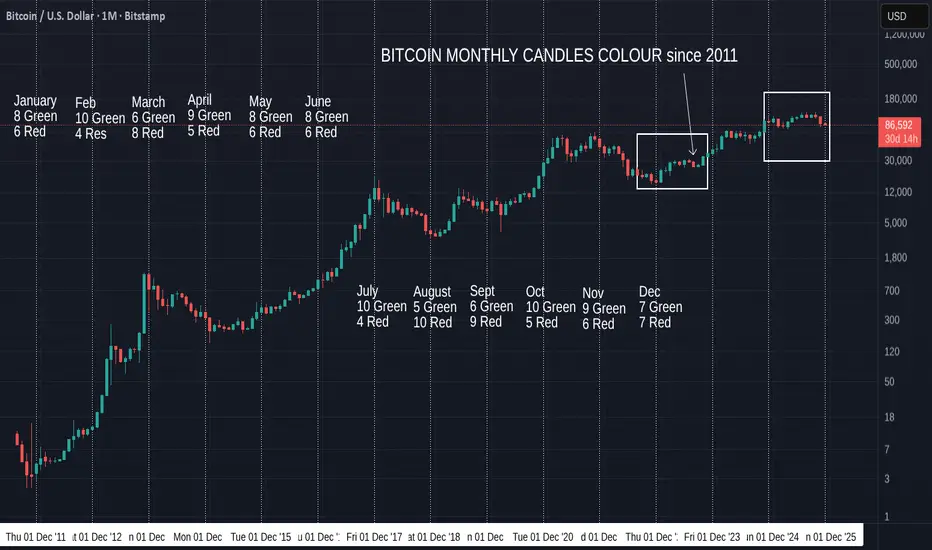
Bitcoin Monthly Candle Close Color since 2011 and patternsNovember closed RED as expected and so we have continued to follow Sequence in the left Box, mentioned in the October post.
The left Box shows the only similar monthly Candle sequence, similar to the one we currently have. If you look closely, it is also a very similar "Curve" shape. Descent to low, rise, flatten out.
The Candle Sequence to see is Red, Green. 2 Red. 4 Green, 1 red, 1 Greeno 1
red
That Sequence was followed by a larger Red Candle, which we have just also done.
The Thin down facing arrow in the left Box, points to the equvilant candle to the one we just closed, thought the month was August and not a November.
The left box starting in September 2022 and the Right Box starts in December 2024.
These Sequences run for 11 Months so Far..
This is the only 2 occasions this sequence has ever happened in Bitcoin history...and they are Both in the same "Bull Run"
And I will just mention that the Left Box was the recovery period after the 2022 Bear market.
A Very positive period.
If we continue this Sequence, we should see a Green Candle in December, though maybe not a large one. Some charts point to a Red start to December, so remain cautious.
We should also remember that a pattern workss untill it Stops...but the longer it runs, the higher the chance of that point being reached.
Just to Recap from the October post of this Series.....
"The Red November in 2011 was the bottom and was the start of Bitcoins 2 year push to ATH.
The Red one in November 2022 marked the Bottom of the Bear, though December was red but a small candle.
Nearly half of the Red Novembers called the Bottom of a Bear, a turning point in market behaviour." (There had been only 5 Red Novembers at the time of writing)
What is also very interesting is how the November 2022 Red candle was approx -27% draw down. (Wicks included) -> the following December in 2022 closed a small Red candle.
The Red November we just closed was also approx -27%
However, To follow the Color sequence, we will expect a Green December.
Of the Previous Red NOVEMBER closes, we have only ever had ONE Green December, way back in 2011,
The Odds do point to a Red December close....but hopefully a small one.
If this happens, the color sequence gets broken but I will look at what happened in early 2023 as a possible follow on. The November, December, January candles for sure....
Looking Forward. Previous December closes.
7 Green to 7 Red - A 50 - 50 mix.
Of the previous 7 Red December Closes, 4 were followed by a Green January, the last one being in December 2022 and was followed by a Lovely Green January, marking the start of the current push higher by Bitcoin from 15K usdt low to over 120K usdt.
That January Candle was over 50% rise.
Only one Red December led us into a Deep Bear market, the others signalled change.....
So, While the odds, technically, point to a Red December close, to follow previous moves and sentiments, this may not be a bad thing.
A Red December would break the sequence we have been talking about, as the next in sequence is a GREEN candle. And so were the next 6 Months.
So, December Close will answer Many questions and is, once again, a pivotal month. The Sentiment for the entire year to follow will be set by this months Candle Close..
We currently have a number of pointers suggesting this is an End to a "Bear"....and this Draw back right now has seen PA fall below a number of Key support levels but interestingly, we have got no where near the "traditional " - 80% Bear draw down.
Very confused signals, hinting at moves in either direction.
We have to wait......as ever.... But I am VERY BULLISH
As it stands, a Red or a Green December has the potential to be Good, providing that, obviously, a BEAR market is not confirmed.
My preference is fr a small Red candle this month........
Analytics: market outlook and forecasts
WHAT HAPPENED?
Last week, we continued the upward movement to the next selling zone. After reaching it, the market moved sideways, forming a pivot point at $ 90,000. We expected a reaction and continued purchases to the next zone, but a less likely and more negative scenario worked out.
Today, at the opening of trading, an active seller increased the pressure, which led to a breakdown of the lower consolidation boundary. The context abruptly changed to a top-down one. The decline stopped in the local buying zone of $88,000-$86,000. At the same time, all volumes from below are absorbed by limit orders, and the reaction of buyers doesn't give grounds to expect a rapid recovery in growth.
WHAT WILL HAPPEN: OR NOT?
The base scenario is a correction to the zone of volume anomalies of $84,000-$82,000. Increased protection can be expected from this area. However, if the selling pressure persists, resistance may already appear at the levels of $86,000-$88,000.
If protection doesn't appear, the week will turn out to be bearish again, and the decline will continue at least to the level of $ 74,500.
Buy Zones
$84,000–$82,000 (volume anomalies)
Sell Zones
$89,800–$90,800 (cluster anomalies, mirror zone)
$94,000–$97,500 (volume zone)
$101,000–$104,000 (accumulated volumes)
$105,800–$106,600 (local resistance)
IMPORTANT DATES
We're following these macroeconomic developments:
• Monday, December 1, 14:45 (UTC) — the publication of the index of business activity in the US manufacturing sector for November;
• Monday, December 1, 15:00 (UTC) — publication of the US manufacturing price index for November;
• Tuesday, December 2, 1:00 a.m. (UTC) — speech by Fed Chairman Jerome Powell;
• Tuesday, December 2, 10:00 a.m. (UTC) — publication of the European Consumer Price Index for November;
• Tuesday, December 2, 15:00 (UTC) — publication of the number of open vacancies in the labor market (JOLTS) USA for September;
• Wednesday, December 3, 13:15 (UTC) — publication of changes in the number of people employed in the US non-agricultural sector in November;
• Wednesday, December 3, 14:45 (UTC) — publication of the index of business activity in the US services sector for November;
• Wednesday, December 3, 15:00 (UTC) — publication of the index of business activity and the index of prices in the non-manufacturing sector of the USA for November;
• Thursday, December 4, 13:30 (UTC) — publication of the number of initial applications for US unemployment benefits for the week;
Friday, December 5, 15:00 (UTC) — publication of the basic price index of US personal consumption expenditures for September.
*This post is not financial recommendation. Make decisions based on your own experience.
#analytics

Wave 4 Trap Complete as Bitcoin Prepares for Final Flush6 Days Ago:
3 Days Ago:
1 December 2025
BTC moved into the expected corrective zone last week but stayed inside the falling channel, showing that wave 4 was only a temporary bounce. Buyers failed to break any key resistance, and momentum kept fading. This kept the broader outlook bearish and hinted that wave 5 was still pending.
BTC has now broken below the short-term rising structure, confirming that wave 4 topped out near the 0.786 retracement. The rejection from that zone triggered a clean shift back into the main downtrend, with price sliding toward the key 86,280 support. As long as BTC holds below the upper channel boundary, the market remains positioned for further downside, with the 1.618 extension around 79,650 emerging as the next probable target for wave 5 completion.
Note:
The rejection from the 0.786–resistance zone shows buyers failed to take control.
Wave B at 86,280 is the immediate pivot level; staying below it keeps downside pressure intact.
The next major target for wave 5 sits near the 1.618 extension around 79,650.

BTC: Bearish Breakdown From ChannelHi!
Bitcoin has broken decisively below the rising channel that has guided price for months, marking a significant shift in market structure. This breakdown aligns with a completed Head & Shoulders pattern, where price failed to hold the right shoulder area and continued lower, confirming bearish momentum.
With the channel support lost and no meaningful bullish reaction on the retest, sellers remain firmly in control. BTC is now heading toward the next major horizontal support around $88,900, which is the key level highlighted in the chart.
Unless buyers reclaim the broken channel support with strong conviction, the path of least resistance remains to the downside.

BTCUSD 1W - My Thoughts Going into Dec 1 2025 Week BTC heads into the first week of December in a clear corrective phase, with price likely to remain choppy as it digests the recent downside move. The mid-80k zone is acting as an interim equilibrium, but the broader structure still favors a deeper liquidity sweep toward the 70k-73k support band before any meaningful trend re-acceleration.
Volatility should remain elevated, and the market is positioned to shake out weak hands during this chop. Structurally, pullbacks into key supports continue to define the higher timeframe trend, while sellers are losing momentum on each leg lower.

BTCUSD (2H) – Elliott Wave Completion + Breakout SetupBITSTAMP:BTCUSD
Bitcoin has completed a clear 5-wave corrective structure, currently consolidating near a demand zone after sweeping liquidity around $87,300.
Price is now attempting to break short-term structure, forming a potential reversal setup. A confirmed breakout above the $89,800–$90,300 resistance zone may trigger a bullish continuation toward the descending trendline and mid-range level.
Key Scenarios
✅ Bullish Case 🚀
Break & hold above $90,300
→ 🎯 Target 1: $95,800
→ 🎯 Target 2: $105,100 (Extended target if trendline breaks)
📌 Entry Zone: $88,500–$90,300
📌 Stop Loss: $83,900
❌ Invalidation:
A strong break below $83,900 confirms bearish continuation toward the lower demand at $80,500.
Levels to Watch
Support: $87,300 / $83,900
Resistance: $90,300 / $95,800 / $105,100
⚠️ This chart is for educational purposes only. Not financial advice.

Historical Bitcoin ATH drawdown to Fib retrace and % decline
Bitcoin ATH drawdown to Fib retrace and % decline
2011 to 0.236 retrace = =92.41%
2013 to 0.236 retrace = -78.27%
2017 to 0.382 retrace = -82.20%
2021 to 0.5 retrace = -76.40%
Also note how PA bounces off the 50 Week SMA ( Red ) after every ATH except for in 2011. I have only included the 2011 High as it also reached down the the 0.236 after ATH.
But it Must be remembered that the 2011 High is NOT in any channels. It did however, become the support and origin of the current Lower line of Long Term support.
Every other ATH had a draw down to the 50 week SMA, a bounce higher and then fell through the SMA. (2017 is slightly different but this is still valid )
The 2021 Bounce led to a new ATH for the first time.
Currently from Current 2025 ATH, we have still not reached the 0.236 on the current draw Down but we have fallen through the 50 week SMA for the first time this Cycle.
This is VERY different from previous Cycles. You will also note how PA has previously bounced off the 50 SMA 3 times this cycle already, on or very near a Fib line..
Again, Very different behaviour.
However, as you can see from the main chart, we have used Every single Fib line on the way up. It was fairly similar in the lead up to the 2017 ATH.
To me, this validates these Fib lines.
But What I want to look at is how the 2021 PA went to an ATH, retraced back to its own 0.236 line, on the 50 Week SMA ( Red), bounced to a New ATH and then Draw down, a small bounce and fell through the 50 SMA.
That second draw down did not reach the 236 > it bounced up till it collided with the 50 week SMA and then went into a full on Bear.
All that happened between the 0 and the 0.236 Fib Retrace lines, untill it fell through .
To many extents, Bitcoin PA is repeating this.
We hit a new ATH in Jan 2025, retreated to the current 0.236 and the 50 Week SMA, bounced to a New ATH in October and have been in retreat since, never yet reaching the 0.236 again.
I am currently looking to see when current PA hits the 50 week SMA.
The 50 week SMA will be Met, at current trajectory around the 100K usdt mark.
Then, if we follow the 2021 pattern, PA will get rejected and we will eventually head to the 44K zone on the 0.5 Fib retrace. Which also happens to be the line that PA bounced off in 2021, its 0.236 fib line.
That is around a -63% retrace. LESS than previous retracements.
That follows the 2021 route.
Current PA is also stil running between the 0 and the 0.236 fib retracement lines. As the 2 ATH's did in 2021. We do seem to be following a simialr Technical pattern.
Look back though the other ATH and see how the 236 was used.
BUT if we look back to the previous Fib retrace lines..We seem to be going to the next Fib retracement level sown after each ATH, before a meaningful bounce.
2013 to 0.236 retrace
2017 to 0.382 retrace
2021 to 0.5 retrace
If we follow This, the next for this cycle could be the 0.618, which sits at 34,966 usdt
I do yet think this will Happen and 7here is NO guareantee this will happen but I have found it very interesting how PA is repeating a number of patterns, certainly, currently, the similarity to the 2021 ATH structures.
Another was From October 2021 till June 2025, we had PA running a near perfect copy of the 2013 to 2017 Fracel.
This has now changed and we follow a later route
This Can obviously get Broken completely by Fundamentals....which are Mental right now.
And then, we have the Shouts of "This time is Different. "
YES and NO.
As this post shows, there are many similarities and yet, at the same time, The way PA has reacted and moved this cycle, if it is a cycle, is also unique,,,
And another reason for that, is studied in earlier posts about "The Blur Arc of resistance"
And we may well just keep on going to a New higher ATH in 2026.
While the current draw down has been painful, there is no confirmed Bear market yet
I hope this gets you thinking.....Enjoy....
I would love to hear yur Views

Bitcoin prediction 2022, BTC Temporary pullback to $36,000 Bitcoin temporary pullback to $36,000 level or beyond if sellers dominate.

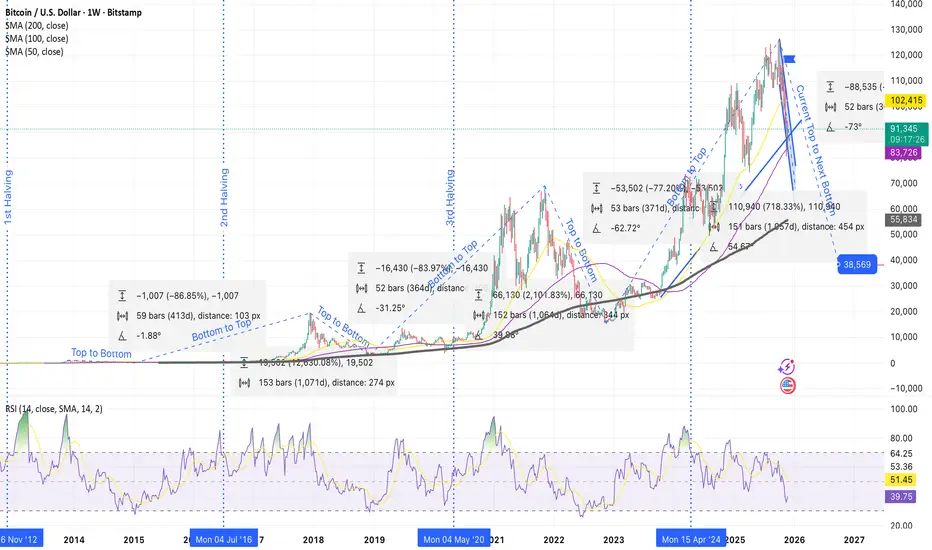
Deep Analysis for Bitcoin – The 4-Year Cycle Repeating Again🔹 1. Historic Bear Market Drops Are Identical
Each cycle produced almost the same percentage crash from top to bottom:
• Cycle 1: –86.85%
• Cycle 2: –83.97%
• Cycle 3: –77.20%
• Current Cycle (Projection): –70% to –75%
Every cycle becomes slightly less volatile, but the pattern is still the same:
The top is always followed by a huge correction.
⸻
🔹 2. The Cycle Durations Are Nearly Perfect Copies
Top → Bottom timing
• Cycle 1: 59 weeks
• Cycle 2: 52 weeks
• Cycle 3: 53 weeks
• Current projection: ~52 weeks
⏳ Every major Bitcoin top takes ~1 year to reach the bottom.
Bottom → Next Top timing
• Cycle 1: ~1070 days
• Cycle 2: ~1057 days
• Cycle 3: ~1057 days
• Current cycle follows the same length exactly.
⸻
🔹 3. Bitcoin Always Bottoms Near the 200-Week SMA
Every cycle bottom touches or slightly dips below the 200-week moving average (black line).
Your projection shows the same thing happening again:
📉 Projected BTC bottom: ~$38,000 – $40,000
Exactly where the 200-week SMA and long-term trendline converge.
⸻
🔹 4. Current Cycle Is Following the Previous One Perfectly
Your chart overlays show:
• The 2025 top mirrors the 2021 top
• The decline angle is almost identical
• RSI is falling the same way it did in every bear market start
• The projected drop of –70% from the 2025 top leads directly to the $38K bottom zone
This is the same structure as:
• 2013 → 2015
• 2017 → 2018
• 2021 → 2022
⸻
🔹 5. What’s Next?
If Bitcoin continues to follow its 4-year cycle:
📉 Bear Market Bottom: ~$38K in 2026
📈 Next Major Bull Run: 2026–2028
🏁 Major Cycle Top: around 2028–2029
⸻
🧠 “Bitcoin has never broken its 4-year cycle. Each top is followed by a –70% bear market, and each bottom leads into the next halving bull run.”
📜 Disclaimer: This is general information only and not financial advice.
The Hidden Rhythm Behind Bitcoin’s Four-Year CycleSince 2015, Bitcoin has been moving like a heart beat that refuses to tick randomly. If you zoom out far enough, the timeline paints a pattern that repeats with crazy precision — a rhythm of 365 and 1,065 days, echoing across bull and bear cycles.
Here’s the sequence:
• 2017 All-Time High → 2018 All-Time Low:
365 days
• 2018 All-Time Low → 2021 All-Time High:
1,065 days
• 2021 All-Time High → 2022 All-Time Low:
365 days
• 2022 All-Time Low → 2025 All-Time High:
1,065 days
A perfect alternation, almost like Bitcoin inhales for a year… and exhales for three.
This pattern aligns beautifully with the idea of a four-year cycle, but what’s fascinating is its precision. It’s not vague. It’s not approximate. It’s day-count accurate, which makes you wonder:
Is this just market psychology repeating itself?
Or is Bitcoin following a deeper structural rhythm embedded in its halving mechanism?
But here’s where it gets interesting…
This cycle might not stay “perfect” forever.
We’re entering a new era where:
• Countries are adding strategic Bitcoin reserves
• Institutional funds, big company's are stepping in ( Microstrategy, Tesla, etc. )
• ETFs and sovereign buyers are absorbing supply that miners can’t replenish
This pushes Bitcoin closer to becoming a macroeconomic asset, not just a speculative one.
And when the character of an asset changes, its cycles can stretch, twist, or break.
So maybe — just maybe —
even though the 365/1065 rhythm held from 2015 to 2025 like clockwork…
this time the real bull run might arrive later than expected.
A delayed ignition.
A late bloom.
A cycle that still respects the past — but evolves with the future.
Because for the first time in Bitcoin’s history, the buyers are not just retail dreamers or early believers.
They’re nations.
They’re institutions.
They’re multi-decade players.
And assets behave differently when the hands holding them change.

Bitcoin prediction 2025-NovBitcoin price has a motive to buy and it's now retraced to a bullish order block as way of correcting price with same Bullish bias from earlier trade call.

BTC 1H – Bearish Retracement Before Potential ContinuationBTC is currently pulling back after rejecting the upper volatility band, forming a clear lower high on the 1H timeframe. Price is trading back under the EMA ribbon, signaling a short-term bearish retracement within the broader bullish structure. This cooldown is healthy and expected after the recent impulsive move up.
Downside targets are aligned with the Fibonacci retracement levels:
🔻 TP1 – 38.2% Fib: ~$89,766
🔻 TP2 – 61.8% Fib: ~$88,923
🔻 TP3 – 100% Fib: ~$87,658
As long as BTC holds above the deeper Fib zones and maintains higher-timeframe structure, this move is likely just a corrective dip before buyers step back in. Once the retracement completes, a continuation to the upside remains the more probable scenario.

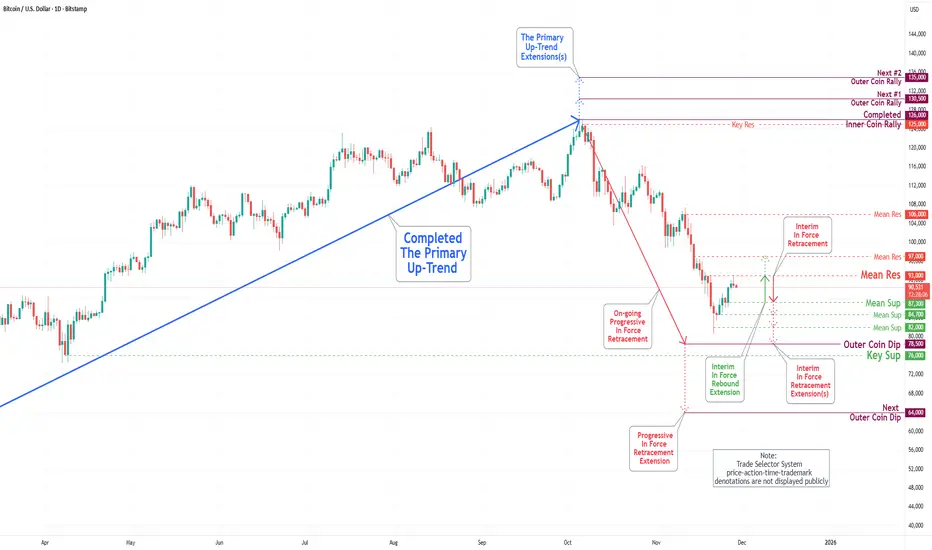
Bitcoin(BTC/USD) Daily Chart Analysis For Week of Nov 28, 2025Technical Analysis and Outlook:
During the most recent trading session, the Bitcoin market exhibited a resilient rebound, continuing a trend observed over the past week. The price has reached the Mean Resistance level of 93,000.
Market sentiment is in declining mode, and the price is likely to trend toward the Mean Support level at 87,300. Current trading activities are focused on identifying the next Outer Coin Dip, projected at 78,500, with additional obstacle support at the Mean Support levels of 84,700.
Given the prevailing trading dynamics, there is potential for an intermediate rebound from the Mean Support level of 87,300 to the Mean Resistance level of 93,000. Furthermore, an external extension may occur as the cryptocurrency market continues to fluctuate in line with current shaky market sentiment. Notably, it is essential to acknowledge the potential for a significant rebound once the Outer Coin Dip target of 88,500 is achieved.