Is BCH/USDT Setting Up a Downside Swing? Structure Explained🔻 BCH/USDT – Crypto Market Opportunity Blueprint (Swing Trade)
“Bitcoin Cash vs Tether: Bearish Structure in Focus”
📉 Trade Outlook
The bearish plan has been confirmed following a decisive weighted moving average dynamic-support breakdown, signaling potential downside momentum.
📌 Entry
You may enter at any price level that aligns with your trading framework and confirmation signals.
🛑 Stop-Loss (SL)
This setup uses a reference SL @ 520.0.
Dear Ladies & Gentleman (Thief OG’s), adjust your stop-loss according to your strategy, your confirmation, and your risk appetite.
Place the SL only after the breakout confirmation.
Note: This SL is not a recommendation. Manage your trade independently and execute based on your own risk tolerance.
🎯 Target (TP)
The moving average currently acts as a strong resistance zone, combined with overbought conditions + a potential trap setup.
Our reference target stands at 460.0 — lock in profits if the structure moves in your favor.
Note: This TP is also not mandatory. Choose your own exit based on your analysis and risk preferences.
📚 Market Structure Breakdown
Dynamic support has clearly failed → signals bearish momentum
Price retesting lower MA zones indicates weak bullish pressure
Volume profile confirming seller strength
Structure favors downside continuation if resistance holds
🔍 Related Pairs to Watch (Correlation Insights)
1. BITSTAMP:BTCUSD (Bitcoin)
BCH often mirrors BTC’s broader trend.
If BTC breaks key support levels, it can amplify downside on BCH.
Watch for MA rejections or liquidity grab zones.
2. BITSTAMP:ETHUSD (Ethereum)
ETH weakness frequently leads to crypto-wide risk-off sentiment.
ETH/BTC ratio drop usually pressures altcoins, including BCH.
3. COINBASE:LTCUSD (Litecoin)
A close competitor to BCH with similar structure behavior.
If LTC forms bearish MA crossovers or loses trendline support, BCH weakness can follow.
4. BINANCE:BNBUSDT (Binance Coin)
BNB drives exchange-based flows.
Increased selling in BNB can trigger broader altcoin corrections, hinting at BCH continuation.
5. BINANCE:BCHBTC (Bitcoin Cash vs Bitcoin)
Direct correlation indicator.
A falling BCHBTC pair signals relative weakness, strengthening the bearish case.
📌 Final Notes
This blueprint provides a structured guide for your analysis — but execution, SL, TP, and risk remain your personal decision.
Trade safe, stay disciplined, and follow your confirmation signals.
Bitcoinpump

BTCUSD – Bullish setup 4HBITSTAMP:BTCUSD is showing early signs of a potential bullish reversal after reclaiming the mid-range of the channel and holding above key EMAs. Price is consolidating just under the dynamic resistance band, and repeated higher lows suggest buyers are gradually regaining control.
🔍 Bullish Confluences:
Reclaim of mid-trend band with candles closing above the lower volatility ribbon.
Higher-low structure forming after the recent sweep of liquidity.
Momentum shift indicated by bullish reaction off the 0.382–0.5 retracement zone.
Support confluence at ~86.8k where previous demand and fib structure overlap.
🎯 Fibonacci Targets:
TP1 – 38.2%: 89,242
TP2 – 61.8%: 90,576
TP3 – 100%: 93,500
If price breaks and holds above the current compression zone, continuation toward the fib cluster at 90–91k becomes likely, with the final upside extension pointing toward 93.5k.

BITCOIN(BTCUSDT): First Setup Dropped From $107k To $80K, Next? Dear Traders,
Bitcoin has fallen from our selling point as described in our previous trading setup on BTCUSDT. The price has dropped significantly from $107k to $80k.
We anticipate a further decline to approximately $66k to $57k. This area appears to be a discounted price point where a large number of buyers are likely to be present. Once the price reaches our entry point marked by two white lines, we believe it will follow a strong bullish impulse. This will likely take the price from $60k to $140k.
We wish you the best of luck and trade safely.
Team Setupsfx
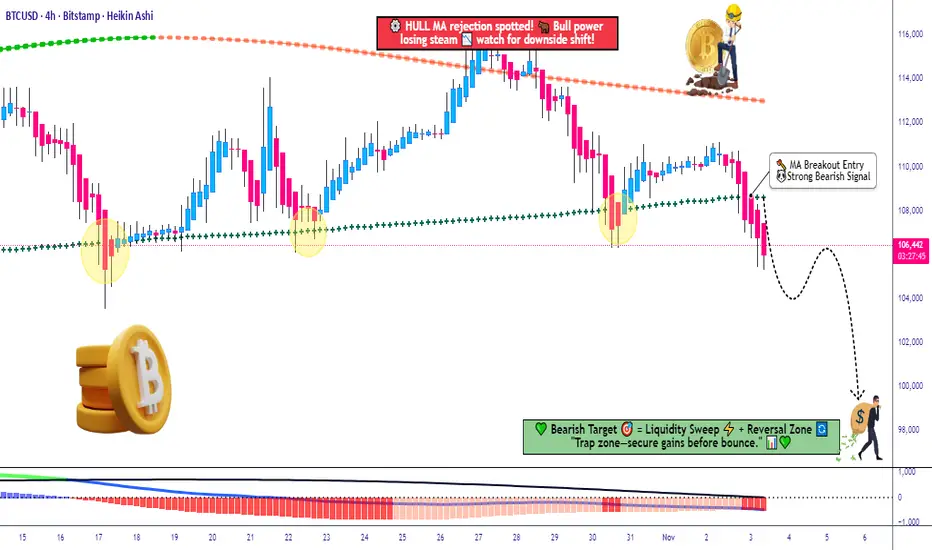
BTC/USD Breakdown Alert — MA Cross & MACD Flash Warning!💰 BTC/USD — “BITCOIN vs U.S. DOLLAR” | Crypto Market Capital Flow Blueprint (Swing Trade)
🧭 Market Overview
The king of crypto 👑, Bitcoin, is showing signs of fatigue at the top. After a solid bull sprint, we’re spotting bearish confirmation on multiple signals — a clean moving average breakout and a MACD divergence to the downside.
Looks like the market’s whispering, “It’s time for a cool-down, mate.” 😏
🎯 Trade Plan (Swing Setup)
Plan: ✅ Bearish plan confirmed — waiting for continuation pressure below structure zones.
Entry Strategy (Thief Layer Method 🕵️♂️):
Using layered limit sell orders — a signature “Thief Strategy” style of scaling in with patience, precision, and a bit of chaos theory.
Sell Limit Layers: 110,000 💸 → 108,000 💸 → 106,000 💸
(You can expand the layer grid as per your risk model.)
Stop Loss: 112,000 — positioned above the previous Higher High (HH) structure.
📝 Note: Dear Ladies & Gentlemen (Thief OG’s), I’m not recommending you to stick to my SL. Manage risk your way — you make money, you take money. 💼
Target: 98,000 — based on strong support, oversold confluence, and a potential liquidity trap zone below.
📝 Note: Same rule — take profits where it makes sense for you. The trap is the escape; don’t overstay the party. 🎭
🔍 Technical Confluence Highlights
📉 MA Breakout: Bears gaining control after crossover rejection.
📊 MACD Divergence: Weak momentum confirmed — watch histogram fade.
Structure Check: Market respecting descending trendline — sellers defending upper zone.
🧩 Momentum Flow: Smart money possibly rotating out of BTC into defensive assets.
🌍 Correlated Pairs to Watch
Keep an eye on these related assets for directional cues and correlation strength:
BITSTAMP:ETHUSD (Ethereum) — often mirrors BTC’s moves with higher beta.
TVC:DXY (U.S. Dollar Index) — rising DXY can pressure BTC.
PEPPERSTONE:NAS100 (NASDAQ 100) — tech sentiment affects BTC risk appetite.
CRYPTOCAP:BTC.D (Bitcoin Dominance) — watch if altcoins start outperforming.
✨ “If you find value in my analysis, a 👍 and 🚀 boost is much appreciated — it helps me share more setups with the community!”
#BTCUSD #Bitcoin #CryptoMarket #SwingTrade #TechnicalAnalysis #ThiefStrategy #BearishSetup #CryptoTrading #MarketFlow #LayeredEntries #SmartMoney #TradingView #EditorPickCandidate #BTCAnalysis
BitcoinBTCUSD
- Completed " 1234 " Impulsive Waves
- Break of Structure
- RSI - Divergence
- Bullish Channel as an corrective pattern in Short Time Frame
- Demand Zone

Bitcoin at Golden Pocket Support – Don’t Sell the Dip?Bitcoin is currently testing the 0.618–0.65 Fibonacci retracement zone (~$108k), a historically strong support level also known as the “Golden Pocket.”
With confluence from CZ’s reminder — “Things to avoid in crypto: Selling the dip” — this area could be a major bounce zone if bulls defend it.
🔹 Strong Support: $108k
🔹 Next Support: $98k if breakdown happens
🔹 Resistance: $113k – $117k
Bias: Watch for confirmation candles. A bounce here could send BTC back toward $113k–117k. A breakdown invalidates this support.

BTCBtc usdt Daily analysis
Time frame hourly
Risk rewards ratio =2
Target 107.000$
LS is very tightly so I have no problem with stop hunters
Btc is charging its energy to pump and reach the new high

My thoughts on Bitcoin.. ABC -> 129K Top?I think we correct down to 112K area to fill the FVG and CME then we Turn up, topping at 129K and then the rest of the Alts blow off top from there..
Thoughts?

Capital Doesnt Lie - The Energy ProblemPart 1: THE ENERGY PROBLEM
Everything we do produces energy, even prayer. If you have ever felt tired after praying for someone, that's because you spent energy and made an effort; let's call that energy 'capital' . Capital begins with effort, whether you see it or not.
The problem is: how do we use it or store it?
Imagine that energy as an invisible ball growing in front of your head. Every time you work and think, you're growing that invisible energy ball of capital. So, how do you get it in your hands? You can plant a cucumber, craft a chair, or clean your house. It's your order, attention, time- all energy made visible in the house, stored in the cucumber or the chair.
Genesis 3:19
'By the sweat of your face you shall eat bread…'
Verse Comment: It doesn't say 'by luck' or 'by inheritance.' It says by sweat. That's energy. That's effort. That's the value produced.
Proverbs 14:23
'All hard work brings a profit, but mere talk leads only to poverty.'
Verse Comment: Effort always creates something. Even spiritual labor, such as intercession, leadership, and parenting, is a form of value creation.
But here's the issue. That cucumber plant? It goes bad. That chair? It breaks. That clean house? Dirty again in 24 hours."
Everything we do has a cost; it's not free. Energy fades unless you can find a way to store it longer than the life of the thing you created.
So if everything fades, the big question becomes: How do you store the surplus of your energy, (the part you don't need today) so it doesn't fade by tomorrow?"
That's the foundation of all capital. Of all value. And of all wealth. And it starts with understanding where your energy is going, and what it's pouring into.

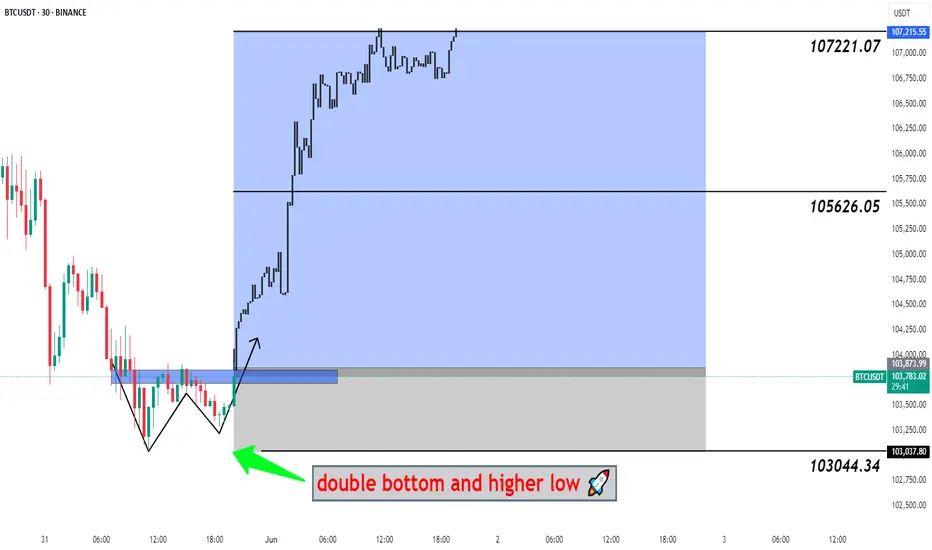
#BTCUSDT Big Pump Next Hour - Bitcoin, BTCUSD, BTCUSDT 📉 Double Bottom Pattern Forming – Potential Reversal Setup
The current price structure is showing signs of a Double Bottom – a classic bullish reversal pattern. After an extended downtrend, this pattern suggests that the market may be preparing for a trend reversal from this key demand zone.
🔹 Trade Setup
Entry, Targets, and Stop Loss (SL) are marked on the chart.
Entry: Upon breakout confirmation above the neckline.
Stop Loss: Just below the recent swing low to manage downside risk.
Targets: Calculated using the measured move method from the bottom to the neckline .
🔹 Risk & Money Management (Professional Approach)
To maintain consistent profitability and protect capital, strict risk management is essential. For this setup:
🔸 Position Sizing: Based on a fixed % of total capital (typically 1–2% of account equity per trade).
🔸 Risk-to-Reward Ratio: Minimum of 1:2, ideally higher.
🔸 Stop Loss Discipline: No arbitrary changes after entry. SL only adjusted for breakeven or trailing stops once price moves favorably.
🔸 Trade Management: Secure partial profits at key levels, trail stops as structure forms.
🔸 Capital Allocation: Avoid overexposure. Trade fits within overall portfolio strategy.
💬 Let the setup come to you. React, don’t predict.
🔁 Like, comment, or share your thoughts below!
BINANCE:BTCUSDT BITSTAMP:BTCUSD COINBASE:BTCUSD BINANCE:BTCUSDT.P INDEX:BTCUSD CRYPTOCAP:BTC.D CRYPTO:BTCUSD BYBIT:BTCUSDT.P BINANCE:BTCUSD
Pay no attention to the wavy line...Added this nonsense as filler- you know what to do though: we wait till the red resistance zones populate, so we can mentally throw out support zones that don't match the support/resistance channel.
What do you think: is this the channel that holds till Jan 1st 2025?
Because if it is, then we're darn close to >100k in the new year, and possibly reaching MAJOR correction by the inauguration.

Is bitcoin priming for 6 digit prices? This bullrun came out of nowhere and also did not give us the deep correction that we've come to expect from the previous bull/bear cycles. In fact, bitcoin managed to correct and accumulate inside the indicated range for an extended period, which is quite a feat considering the price per unit. This brings me to the conclusion that the correction is possibly over and bitcoin is ready to test ATH again. Also since the previous bear cycle was extended for a longer period (than what we know from history), it doesn't make sense to start another bear cycle right now. This reduces the probability for lower prices. What's even more strange and adds weight to the theory is that, it looks like (based on certain indicators) the next bull run has already begun!!
BUT!!
Bitcoin's strange MO is to always paint a green future ahead, just before dumping real hard. So take this one with a grain of salt.
Confirmation to look for:
The weekend is bullish and closes as indicated on the chart.
Trade will activate on confirmation!
Disclaimer: These are not trading signals. Trade at your own risk!

GBP/USD "Cable" Bank Money Heist Plan on Bullish Side.Ola! Ola! My Dear Robbers / Money Makers & Losers, 🤑 💰
This is our master plan to Heist GBP/USD "Cable" Bank based on Thief Trading style Technical Analysis.. kindly please follow the plan I have mentioned in the chart focus on Long entry. Our target is Red Zone that is High risk Dangerous level, market is overbought / Consolidation / Trend Reversal / Trap at the level Bearish Robbers / Traders gain the strength. Be safe and be careful and Be rich.
Entry : Can be taken Anywhere, What I suggest you to Place Buy Limit Orders in 15mins Timeframe Recent / Nearest Swing Low
Stop Loss 🛑 : Recent Swing Low using 30m timeframe
Attention for Scalpers : If you've got a lot of money you can get out right away otherwise you can join with a swing trade robbers and continue the heist plan, Use Trailing SL to protect our money 💰.
Warning : Fundamental Analysis news 📰 🗞️ comes against our robbery plan. our plan will be ruined smash the Stop Loss. Don't Enter the market at the news update.
Loot and escape on the target 🎯 Swing Traders Plz Book the partial sum of money and wait for next breakout of dynamic level / Order block, Once it is cleared we can continue our heist plan to next new target.
Support our Robbery plan we can easily make money & take money 💰💵 Follow, Like & Share with your friends and Lovers. Make our Robbery Team Very Strong Join Ur hands with US. Loot Everything in this market everyday make money easily with Thief Trading Style.
Stay tuned with me and see you again with another Heist Plan..... 🫂

BTCUSD Come on Baby, You are Ready to Bullrun1. Current Price Action
Price is trading at around $64,719, approaching the previous all-time high of $67,752.
There appears to be a breakout from a downward wedge pattern, indicating a potential continuation of the uptrend.
The price target projected from this wedge is aiming towards higher levels.
3. Future Price Targets
1.272 Fibonacci extension is marked at $100,214, which seems to be the next major target on the upside if the price breaks above the previous all-time high ($67,752).
The chart suggests that there’s a good probability of Bitcoin rallying towards this level if bullish momentum continues.
4. Trend Analysis
The breakout from the wedge is significant, as wedge patterns often signal the end of a corrective phase. The breakout suggests that the market could resume its bullish trend after the consolidation.
If Bitcoin sustains its price above $67,752, it would likely confirm a new bull run, with Fibonacci extensions providing potential targets for the next leg up.
5. Support Levels
On the downside, the first major support is around the 0.786 Fibonacci retracement at $49,793.
Below that, significant supports include $39,099 (0.618 Fibonacci level) and $32,992 (0.5 level).

Remember! Remember! The 5th of November!Thursday... the 5th of November 2020... CRYPTOCAP:BTC pumped nearly 7% in one day.
We were 30ish days into the parabolic phase of the 3rd bull cycle for #Bitcoin.
It was trading at $14,911.
The holders had no idea that CRYPTOCAP:BTC would continue to climb an additional 335% over another 5 months, reaching a local ATH of $64,895 on April 14th 2021.
Here we are on September 6th, 2024. CRYPTOCAP:BTC dropped to $52,546 or (-3.8%) for the day.
Septembers are a sore subject when it comes to financial markets and Bitcoin in particular.
Across the Post-Halving years, CRYPTOCAP:BTC will drop -2% historically.
Considering CRYPTOCAP:BTC has tested local lows across the 5th and 6th of the last 3 months;
July 5-6th low: $53,499
August 5-6th low: $49,050
September 5-6th low: $52,546 (so far)
It is almost like someone is trolling the Holders...
The focus of this chart is to consider the above and the following.
Have we found our local bottom this early in September? ($52,546)
How will Bitcoin react to the upcoming 25 bps Fed Rate cut? ($50,000 vs $60,000)
Will our price position entering the parabolic phase affect the overall gains over the next 6 months? (90% vs 480%)
Where will our new ATH fall next April/May? ($100,000 vs $305,000)
Let me know how bearish or bullish you think the future of Bitcoin is.

BTC/USD "Bitcoin" Bullish Robbery plan to steal the moneyHola ola My Dear,
Robbers / Money Makers & Losers,
This is our master plan to Heist BCH/USD "BITCOIN CASH" Market based on Thief Trading style Technical Analysis.. kindly please follow the plan I have mentioned in the chart focus on Long entry. Our target is Red Zone that is High risk Dangerous level, market is overbought / Consolidation / Trend Reversal at the level Bearish Robbers / Traders gain the strength. Be safe and be careful and Be rich.
Note: If you've got a lot of money you can get out right away otherwise you can join with a swing trade robbers and continue the heist plan, Use Trailing SL to protect our money.
Entry : Can be taken Anywhere, What I suggest you to Place Buy Limit Orders in 15mins Timeframe Recent / Nearest Swing Low
Stop Loss : Recent Swing Low using 2h timeframe
Warning : Fundamental Analysis comes against our robbery plan. our plan will be ruined smash the Stop Loss. Don't Enter the market at the news update.
Loot and escape on the target 🎯 Swing Traders Plz Book the partial sum of money and wait for next breakout of dynamic level / Order block, Once it is cleared we can continue our heist plan to next new target.
Support our Robbery plan we can easily make money & take money 💰💵 Follow, Like & Share with your friends and Lovers. Make our Robbery Team Very Strong Join Ur hands with US. Loot Everything in this market everyday make money easily with Thief Trading Style.

BTC TRADEAfter manipulation and shift market structure and retest fvg and ifvg we will see an expansion to taken liquidity buyside of equal high at 61885
- Tading is probability control your risk management.
Good luck !

bitcoin 15min certain good long position as we see in chart, Waite for 68879 line to
first retest and reject,
then we can go for a long when it breaks.
notice than 15 min body candle close above this line
stop loss could be under break candle or last floor that was formed before break

Bitcoin long 65564 Crypto crash canceled🎁 Bitcoin is being bought out
🚀 Good news background makes buyers greedy.
🤖 Entry in the breakdown of the level of Rocket 65564
Entry into the trade on the model of level breakout
💲1st target 80000

Bitcoin break out to a new ATH 78k - 81k ?Here is a huge bull flag breaking out as I write this on the 4hr chart. This can easily be a fake out but with the strength that BTC has shown, I can't underestimate it. Still with halving right around the corner, and BTC already being in extreme overbought zones, a -30% pull back can happen at any moment. 👍

Bitcoin Bitcoin is currently forming a FLAG & POLE pattern.
Wait till it breaks the descending trendline and retest plus bounce from it.
Max target would be 50000.
Be careful of liquidation candle

Bitcoin: One Person's Fear is Another Person's GreedFirst off, what the f*ck?
I believe Bitcoin should correct back to at least the 50% Fib Level -- if not the 38.2% -- so that we can see a healthy rally upwards. Years of trading crypto has taught me that every rally has a near equal correction. But emotions and bias will be the death of your portfolio so here's my unbiased analysis of the world's greatest cryptocurrency:
- Bitcoin is forming an ascending triangle on multiple charts which is a bullish sentiment on its own.
- On-Balance Volume (OBV) shows a steady increase in buying pressure since the start of the recent rally. Layman's terms: buying pressure is outcompeting selling pressure.
- Money Flow Index (MFI) has an inverse slope that favors oversold and is currently relaxing in neutral territory safely away from overbought.
These three indicators lead me to believe that Bitcoin may experience another breakout in the coming weeks and, potentially, without a dip back to $30.5K as I previously forecasted. At risk of stating the obvious, news can shake the markets enough to reverse any trajectory but yesterday's Binance update hardly rattled Bitcoin like it did for altcoins.
It's my personal opinion that the Bitcoin ETF decision is the closest catalyst in determining the next major rally or drop. However, we can't forget about the highly anticipated Bitcoin halving which is expected around April 2024. If the ETF does get rejected, this may provide a very lucrative buying opportunity.
COINBASE:BTCUSD

Cardano reversal diamond???ARE WE ABOUT TO PUMP???
Can we see 42K or more in the next coming days for Bitcoin?
I have that 46 cents in mind for ADA!!
NOT FINANCIAL ADVICE IT CAN GO TO ZERO!!!!
