BITCOIN, Formation to Indicate Bounce!Hello Community,
Welcome to this analysis about Bitcoin on the 4-Hour Timeframe Perspective. Bitcoin in recent times managed to hold above the preliminary crucial level of $18,500 which is now pointing out important support above which Bitcoin is moving on to form an inverse head-and-shoulder formation in which Bitcoin also already increased with volatility bounces indicating a final breakout above the neckline of the formation as shown in my chart is likely to emerge. Once this breakout has moved on this will be the origin for further continuation till the $21,000 level has been reached which will be a critical decision point because when Bitcoin has the potential to increase with high bullishness till this level is reached this will be a good movement from where Bitcoin can show up with the final breakout above the upper boundary of the channel which will lead to further continuations into this direction.
Thank you for your support and all the best!
Information provided is only educational and should not be used to take action in the markets.
Bitcoinsignals

BITCOIN Is it DECOUPLING from the stock market?Lately we see the stock market (for this analysis the S&P500 is used (blue trend-line)) falling sharply while at the same time Bitcoin (BTCUSD, orange trend-line) falls at a much lower rate or even at times remains stable (even increasing on some occasions). While this phenomenon might seem odd, especially in the eyes of people believing dogmatically that Bitcoin and the stock market are 100% correlated, it has occurred in the past and even a quick look can help us draw very useful conclusions.
On this 1W time-frame chart, I've displayed the times that the BTC - SPX decoupling has been notable. As you see, since December 2015 there have been three major and four minor occurrences where the S&P500 dropped sharply while Bitcoin remained stable and on some occasions even increased (October 2020, May 2019, late December 2018, early August 2017, October 2016). Two of them where on BTC Cycle Bottoms where a strong rally was starting. Another three was during BTC's parabolic rally phase. For obvious reasons (being a Black Swan event), I exclude the March 2020 COVID crash from the sample.
What do you think that the current divergence/ decorrelation may suggest for Bitcoin? Will it follow SPX sharply lower (if it continues to fall) or form a market bottom and start rising? Feel free to let me know in the comments section below!
P.S. You might find useful looking at the BTCUSD (orange) vs BTCUSD/SPX ratio (blue trend-line) below:
Also in case your browser distorts the lines placement, this is what the main chart of this analysis looks like:
-------------------------------------------------------------------------------
** Please LIKE 👍, SUBSCRIBE ✅, SHARE 🙌 and COMMENT ✍ if you enjoy this idea! Also share your ideas and charts in the comments section below! This is best way to keep it relevant, support me, keep the content here free and allow the idea to reach as many people as possible. **
-------------------------------------------------------------------------------
You may also TELL ME 🙋♀️🙋♂️ in the comments section which symbol you want me to analyze next and on which time-frame. The one with the most posts will be published tomorrow! 👏🎁
-------------------------------------------------------------------------------
👇 👇 👇 👇 👇 👇
💸💸💸💸💸💸
👇 👇 👇 👇 👇 👇

BITCOIN and VIX. Buy/ Sell signals based on the Volatility IndexThis two chart layout depicts Bitcoin (BTCUSD) at the top and the Volatility Index (VIX) at the bottom. A rather simple correlation analysis between the two assets. As you can immediately realize, VIX can give buy signals on BTC (green circles) when the price is High and sell signals (red circles) when it is low.
More specifically we see a clear Higher Lows trend-line and Resistance Zone on VIX. Since Bitcoin's November 2021 market High, every time VIX hit the Higher Lows trend-line, BTC started falling (some days variance), while every time it hit the Resistance Zone, BTC started rising (though rises are rather limited in strength during Bear Cycles). In total we've had 11 such signals since Nov 2021, and only one failed to deliver (May 02 2022).
Yesterday VIX gor rejected just below its Resistance Zone and posted a very strong red 1D candle. It remains to be seen if this very strong correlation will continue to hold and provide another excellent signal, at least on the short-term.
What do you think? Do you agree with this finding? Will the VIX rejection, indicating lower upcoming volatility, cause a rise on Bitcoin? Feel free to let me know in the comments section below!
-------------------------------------------------------------------------------
** Please LIKE 👍, SUBSCRIBE ✅, SHARE 🙌 and COMMENT ✍ if you enjoy this idea! Also share your ideas and charts in the comments section below! This is best way to keep it relevant, support me, keep the content here free and allow the idea to reach as many people as possible. **
-------------------------------------------------------------------------------
You may also TELL ME 🙋♀️🙋♂️ in the comments section which symbol you want me to analyze next and on which time-frame. The one with the most posts will be published tomorrow! 👏🎁
-------------------------------------------------------------------------------
👇 👇 👇 👇 👇 👇
💸💸💸💸💸💸
👇 👇 👇 👇 👇 👇

🔥The best places to buy and sell BITCOIN🧐💣🔰You can see Bitcoin analysis in 15 minutes time frame (BTCUSDT_ 15min)💣🔍
💥If the price can break the Support🧡 to the bottom and stabilize❗ below it, then it can have a fall to the DEMAND zone🔻
But if the price can break the Down trend line🖤 and stabilize❗ above it, it can experience an upward trend until the SUPPLY zone🚀🔺
which direction will the price go to the GREEN💚 side or the RED❤️ side❓❓
I hope the analysis was useful for you🤍🌹
📌Please introduce the channel to your friends 🙏🏻
_________📈TRADER STREET📉__________

BITCOIN The scariest fractal right now.-------------------------------------------------------------------------------
** Please LIKE 👍, SUBSCRIBE ✅, SHARE 🙌 and COMMENT ✍ if you enjoy this idea! Also share your ideas and charts in the comments section below! This is best way to keep it relevant, support me, keep the content here free and allow the idea to reach as many people as possible. **
-------------------------------------------------------------------------------
Yesterday's sudden reversal to Bitcoin's (BTCUSD) strong rise early in the day, just below the 1D MA50 (blue trend-line) was far from ideal as it closed the daily candle in red. That brings to memory the last time that happened and was the last signal before a massive sell-off.
That was on May 04 2022. As you see the price was again rejected just before hitting the 1D MA50, only a few days after it marginally broke above it (April 21) but again failed, just like on September 13. Following the May 04 rejection, the resulting sell-off initially dropped by -36% and by June 18 it completed a -63% fall from the March 28 Top. Such huge decreases have not been uncommon throughout this Bear Cycle (which has been trading within a Bearish Megaphone pattern) and especially since the November 10 All Time High, whose subsequent drop was around -52%.
I have replicated the January 22 - June 18 price action (blue) and pasted it on the post June 18 sequence. That fractal that hints to a -61% drop at around $10000. If it follows the Megaphone's first drop of -52%, then it would result to around $12000. Whatever happens, that is indeed a scary fractal, in fact the scariest projection that can be made on BTC right now. It may or may not happen. What matters is to be prepared for both and apply a strategy that utilizes the appropriate risk management.
But what's your view on this fractal? Do you think it is realistic? What are your targets for Bitcoin on a 1-2 month horizon? Feel free to let me know in the comments section below!
-------------------------------------------------------------------------------
You may also TELL ME 🙋♀️🙋♂️ in the comments section which symbol you want me to analyze next and on which time-frame. The one with the most posts will be published tomorrow! 👏🎁
-------------------------------------------------------------------------------
👇 👇 👇 👇 👇 👇
👇 👇 👇 👇 👇 👇
👇 👇 👇 👇 👇 👇

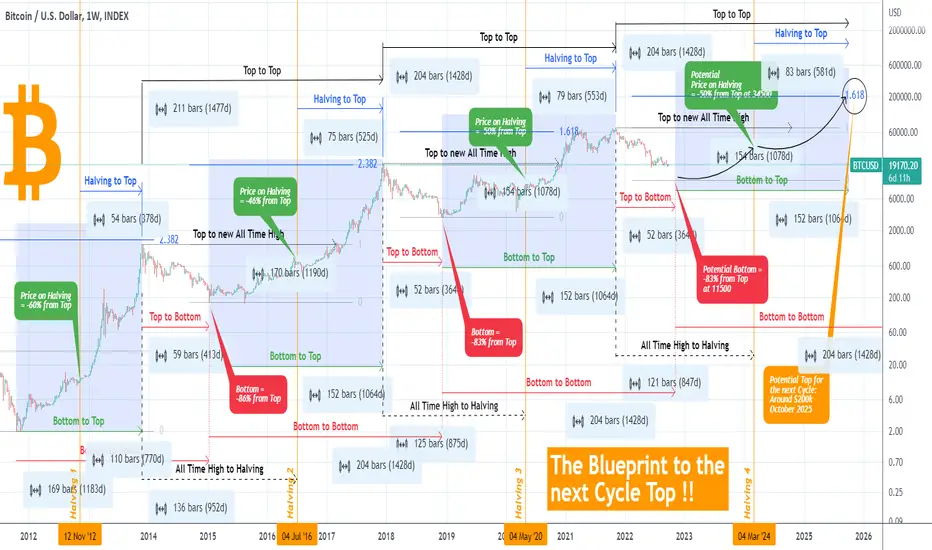
BITCOIN The Blueprint to the next Cycle TopThis is Bitcoin (BTCUSD) on the 1W time-frame and displays a projection both in terms of pricing and timing of its next Cycle modelled out of the previous three using the following attributes:
* The Halvings.
* Fibonacci extensions from Cycle Top to Bottom to calculate the next Top.
* Top-to-Top-to-Bottom-Bottom-to-Halving stats and vice versa.
Basically this is an extension and combination of previous studies that we've published here on TradingView.
The features of the New Cycle based on the previous ones:
- There is a potential Bottom for the current Cycle around $11500 and this is based on a -83% decrease from the $69000 Top. The previous two Cycles made a Bottom at -83% and -86% from their respective Tops.
- This Bottom is expected to be on the week of November 07 2022 based on the Top-to-Bottom stat, calculated at 52 weeks (364 days). This is consistent with the previous two Cycles Top-to-Bottom stats at 52 weeks (364 days) and 59 weeks (413 days) respectively.
- The Bottom-to-Top range for the next Cycle is calculated at 152 bars/ weeks (1064 days), giving a potential Top on the week of October 06 2025. The previous two Cycles Bottom-to-Top stats have also been 152 weeks (1064 days), while the earlier one 110 weeks (770 days).
- That Top of the new Cycle , can potentially be around $200000, calculated on the 1.618 Fibonacci extension level of the previous Top and the next potential Bottom. The Top of the previous Cycle was a little over 1.618, while the Tops of the previous two Cycles were around the 2.383 Fib. Having lower tops, i.e. lower returns is consistent with the Theory of Diminishing Returns in time.
- The Halving-to-Top ranges at 83 weeks (581 days), while the Top-to-Top at 204 weeks (1428 days) projected after the previous two Cycles.
- The price on the date of the Halving can potentially be around $34500. That is calculate at -50% from the top, consistent with the previous three Cycles (-50%, -46% and -60% respectively).
- Also the Bottom-to-Bottom stat (calculated at 204 weeks/ 1428 days) gives an estimated Bottom to the next Cycle around the week of October 05 2026.
If I forget something, it is all on the chart for you to see and draw your own conclusions. As the title says this is a Blueprint of the next Cycle, a roadmap purely drawn on Bitcoin's historical data at hand. The reality can turn out to be quite different if the fundamentals weigh differently this time but in a market of constantly moving variables, this 'Blueprint' may be a good way to start and do your own research.
So how useful do you think this model is? Do you agree with the potential Bottom and Top levels? Feel free to let me know in the comments section below!
------------------------------------------------------------------------------------------
** Please LIKE 👍, SUBSCRIBE ✅, SHARE 🙌 and COMMENT ✍ if you enjoyed this idea! Also share your ideas and charts with the community down below! This is best way to keep it relevant and support me and allow the idea to reach as many people as possible. **
------------------------------------------------------------------------------------------
You may also TELL ME 🙋♀️🙋♂️ in the comments section which symbol you want me to analyze next and on which time-frame. The one with the most posts will be published tomorrow! 👏🎁
------------------------------------------------------------------------------------------
👇 👇 👇 👇 👇 👇
👇 👇 👇 👇 👇 👇
👇 👇 👇 👇 👇 👇
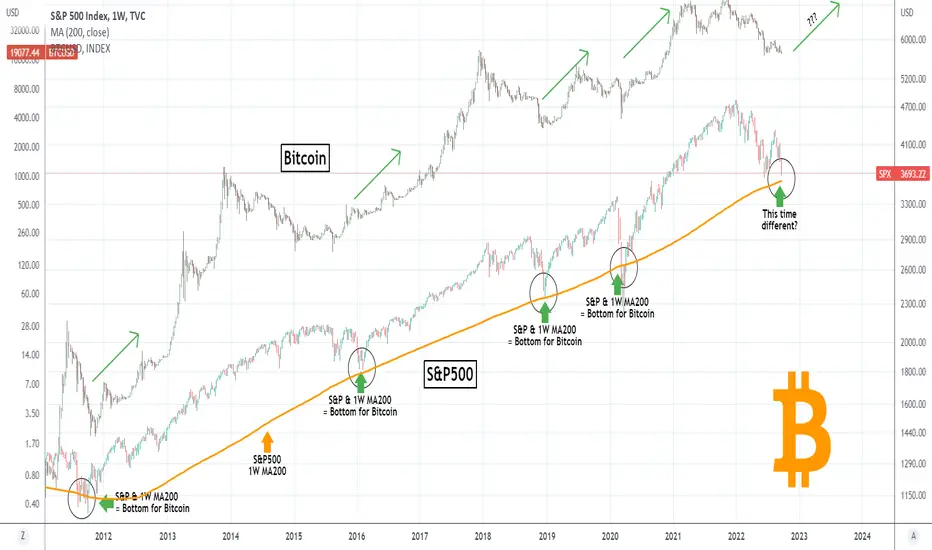
BITCOIN The S&P tests MA200. Crucial week ahead for BTC.Simple 1W chart. Every time the S&P500 index (SPX) hit and broke above or (nearly) bounced on its 1W MA200 (orange trend-line), Bitcoin has formed a bottom and started along with the S&P rally phases. This week the S&P500 will have an opportunity for such a test. Will it find Support and cause Bitcoin to bottom finally and rally? Or is this time different?
Feel free to let me know in the comments section below!
------------------------------------------------------------------------------------------
** Please LIKE 👍, SUBSCRIBE ✅, SHARE 🙌 and COMMENT ✍ if you enjoyed this idea! Also share your ideas and charts with the community down below! This is best way to keep it relevant and support me and allow the idea to reach as many people as possible. **
------------------------------------------------------------------------------------------
You may also TELL ME 🙋♀️🙋♂️ in the comments section which symbol you want me to analyze next and on which time-frame. The one with the most posts will be published tomorrow! 👏🎁
------------------------------------------------------------------------------------------
👇 👇 👇 👇 👇 👇
👇 👇 👇 👇 👇 👇
👇 👇 👇 👇 👇 👇
BITCOIN In DANGER if this level breaks. Can this save the day?Bitcoin (BTCUSD) has been trading within a Falling Wedge pattern ever since the August 15 top. This analysis is on the 1D time-frame but we do incorporate the 4H MA50 (green trend-line) and the 4H MA200 (grey trend-line) to help us understand critical Resistance and break-out level.
** The Falling Wedge and the importance of the 4H MA50 **
What stands out here is that while Bitcoin is on Lower Lows (Falling Wedge), the 1D RSI has been on Higher Lows, showcasing a Bullish Divergence. However that is not enough on its own to start a rebound to the top of the Wedge. What is needed is a candle closing above the 4H MA50. We haven't had one since September 12, which was the previous High of the Wedge. Even before that, since August 15, we see that the candle never closed above the 4H MA50 and only when it did once (Sep 09), did the price rebound. As a result we should consider a closing above the 4H MA50 as a bullish break-out signal targeting the 1D MA50 (blue trend-line) and the top (Lower Highs trend-line) of the Falling Wedge, on the short-term term only. We can derive further confirmation if the 1D MACD makes a Bullish Cross again (last did on Sep 09, exactly when the rebound took place).
** The danger of breaking a Triple Support cluster **
The danger for BTC lies on the potential 1W MA300 (red trend-line) test. As long as the 4H MA50 keeps rejecting a break-out, the price should continue trading lower on the Lower Lows trend-line. Eventually that can test the 1W MA300 on the first week of October. Interestingly enough, this is where the current Support level is (17600), formed by the June 18 Low. If this Triple Support level breaks and the week closes below it, an enormous sell-off can taken place. During this 2021/22 Bear Cycle, it has been common for Bitcoin to fall within -45.50% and 55.50%, as the following chart suggests:
Assuming that the August 15 High was the start of such a sell-off, then a -45.50% move can be completed around 14000 while a -55.50% drop can be completed at around 11500.
What probabilities would you give to see those targets? Feel free to share your work and let me know in the comments section below!
------------------------------------------------------------------------------------------
** Please LIKE 👍, SUBSCRIBE ✅, SHARE 🙌 and COMMENT ✍ if you enjoyed this idea! Also share your ideas and charts with the community down below! This is best way to keep it relevant and support me and allow the idea to reach as many people as possible. **
------------------------------------------------------------------------------------------
You may also TELL ME 🙋♀️🙋♂️ in the comments section which symbol you want me to analyze next and on which time-frame. The one with the most posts will be published tomorrow! 👏🎁
------------------------------------------------------------------------------------------
👇⬇🔽 👇⬇🔽 👇⬇🔽 👇⬇🔽 👇⬇🔽 👇⬇🔽 👇⬇🔽

Bitcoin- Did we had the bottom? If not, is pretty close, IMOI will start by saying that I'm not an eternal optimist when it comes to crypto, in fact, I was very bearish in the past year and I didn't call for a bottom on each support starting with 60k. In this case, though, I think we are pretty close to a bottom if we didn't already have it.
Let me explain.
First of all, Bitcoin is staying in the 20k zone for 3 months now, sometimes slightly under, sometimes slightly above, but you get the point. During this period we had interest rate rises and many other negative news, Bitcoin remained in this zone, with just a drop on the news, indicating that all is in price already.
Second, as was the case when BTC was trading at 60k and a lot of voices called for 100k, now a lot of voices are calling for 10k or whatever, much lower than the price is.
And as we all know, markets turn on extreme optimism and pessimism. As, you know, just 2 days ago we had FOMC with a rate rise and came with "bad" news for the crypto market. No reaction, at least not a notable one.
Technically speaking, we have a clear downtrend and support in the 18k area, also we have an H&S that we can use as a continuation pattern, so we are not yet out of the woods.
However, considering the facts stated above, I see two scenarios:
1. We have a false break of support and reversal above 22k, which would give us a high probability bottom and call for continuation to 25k and even to 30k by year's end.
2. We do not have this false break and the price gets back above 22k and follows the same scenario.
Time will tell, but as I'm concerned, there is a higher probability of 30k by year's end than 10k
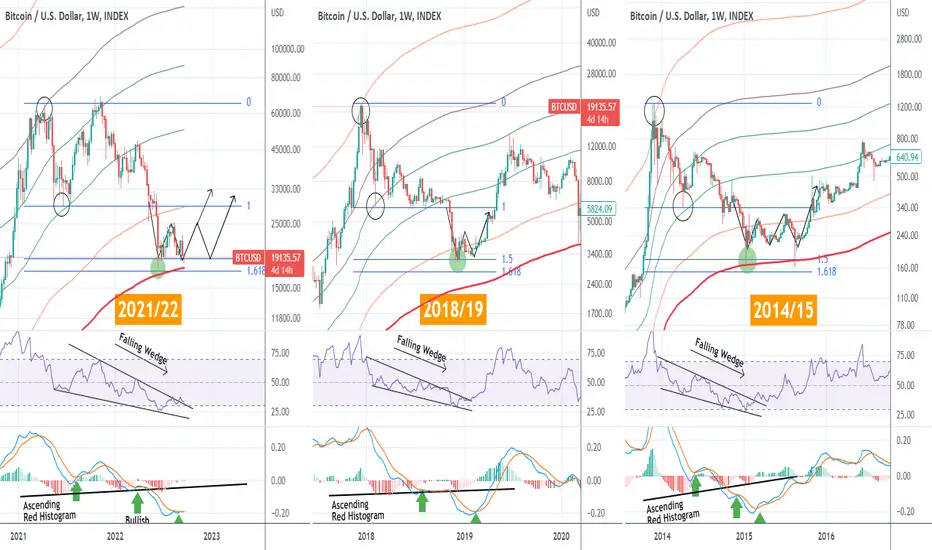
BITCOIN Do we have a clear recovery pattern based on pastCycles?Just as we are waiting for today's Fed Rate Decision, Bitcoin (BTCUSD) remains low, in fact it is the closest it has been to June's Low with the 1W MA300 (bold red trend-line) approaching from below. Is this the last selling before a bottom is formed. One way to look at it is by analyzing Bitcoin's past Bear Cycles. On this analysis we will compare the structure of the current (2021/22) Cycle to the previous two, 2018/19 and 2014/15.
Let's look at the similarities:
* All patterns have hit the 1.5 - 1.618 Fibonacci Zone following their most aggressive sell-off of the Cycle. The 2018/19 Cycle recovered after making a 2nd low and pull-back on a W-shaped pattern, while the 2014/15 had two pull-backs on an M-shaped recovery.
* No (weekly) candle closed below the 1W MA300.
* All RSI sequences formed a Falling Wedge pattern and when it broke to the upside (for 2018/19 and 2014/15), it signaled the start of the new Bull Cycle. For 2021/22, it broke upwards this month.
* The 2018/19 and 2014/15 MACD sequences formed the final Bullish Cross (green arrow) after bouncing on the -0.20 level, which is where the MACD is currently at.
Also their red histograms where on an Ascending (Higher Lows) pattern. The first green bars after that, signaled the start of the Bull Cycle.
As you may have noticed, we are using the Fibonacci MAs on these charts, painting a fairly clear picture of the steps the price took within the Cycles. So far, BTC's current Cycle is extremely consistent with the past two, especially with the 2014/15 one. If yet another Cycle gets completed by repeating this, then we are either at the very low and the start of a rally is imminent on a W-shaped recovery, or we will bounce once more and pull-back to test the 1W MA300 towards the end of the year, before starting the new Bull, on an M-shaped recovery.
Which of the two do you think is going to be? Or do you expect to close below the 1W MA300 and invalidate this historic model? Feel free to share your work and let me know in the comments section below!
--------------------------------------------------------------------------------------------------------
Please like, subscribe and share your ideas and charts with the community!
--------------------------------------------------------------------------------------------------------
Bitcoin- A final spike down before reversal?Since the 68k ATH in November last year, Bitcoin is dropping and dropping, and dropping again with all rallies being sold.
However, at this moment, in my opinion, we are very close to a reversal and as I'm not a "tu da munar", I'm not "tu da gounder" either.
In the past 3 months, Bitcoin has drawn an H&S on our chart and a break under support would put pressure again on the main cryptocurrency, although the target for the pattern and also other types of analysis suggest a low of around 12k, I think we will not touch this.
A spike under this support is not out of the question though but, as I said, I expect a reversal after this final drop.
15500-16k could be a good place to buy and a price of above 25k by year's end is very probable

BITCOIN 1W On Balance Volume calling for the ultimate buy nowThis Bitcoin (BTCUSD) analysis is on the 1W time-frame, utilizing a historically key indicator, the On Balance Volume (OBV). This has helped us spot both buy and sell opportunities in the past, especially since 2013, and as the market is trading sideways, potentially forming the Cycle bottom, it is perhaps the ideal time to take a look into it again.
Since 2013, the OBV has been trading within a Channel Up. The red arrows present tops on (or near) the Higher Highs trend-line, hence sell opportunities, while the green arrows present bottoms on the Higher Lows trend-line, hence buy opportunities. As you see, BTC has been trading on the Channel's Higher Lows trend-line since the June 13 1W candle. Since it is holding it and gradually trending upwards along with the Higher Lows trend-line, it is a sequence consistent with all prior market bottoms.
The 1W MA50/100 Bearish Cross has been formed this month, strengthening the bottoming argument. If the model continues to play out as it did all these years, then with should be expecting a rally soon with a 1st medium-term target on the middle of the OBV Channel Up and a 2nd on the Red Resistance (circle), which is the extension of the first Lower High of the Bear Cycle.
Do you think the OBV model will continue this pattern and deliver 48k-50k by Q1 2023? Feel free to share your work and let me know in the comments section below!
--------------------------------------------------------------------------------------------------------
Please like, subscribe and share your ideas and charts with the community!
--------------------------------------------------------------------------------------------------------

🔍BTC is too bearish to be bullish🔍Here together with you we already discussed price action and structure on BITCOIN before. And because BTC hasn't seen any structural changes from HTF, we remained bearish on it. This is a chart update at the beginning of the week. Please use split screen for better view.
📉 Text marks:
🔹 IL = impulse leg. Inside of IL we can usually see inside structure, which is secondary in nature, like a market noise, unless you trade it on LTF, as it’s own IL.
🔹 ph, pl = protected high or low, which holds current structural impulse.
🔹 bos = break of structure . Based on candle body close below/above previous structural impulse.
🔹 rsz, rdz = refined supply and demand zones. Specific areas to look for LTF confirmations. They are manipulative up-moves before real down moves, or vice versa. Strong hands (the Composite Man, as Wyckoff called it) often come back to such zones to close their manipulative orders at breakeven, before pushing prices further. If body closes outside of the zone, in most cases it will mean the cancellation of the setup.
🔹 if ltf confirms = entry only if there's a shift of structure on lower TF inside of rsz or rdz, or any other type of backtested and approved confirmation.
🔹 liq target = liquidity target: next profit taking levels for strong hands, our main targets based on current price action.
☝️Disclaimer: ALL ideas here are for EDUCATIONAL and MARKETING purposes only, not a financial advice, NOT A SIGNAL. I share my view on the market and search for like-minded traders. YOUR TRADES ARE YOUR COMPLETE RESPONSIBILITY. Everything here should be treated as trading in a simulated environment.
👉I believe that "right or wrong" mentality is a fundamental flaw of any beginner. In reality, a trader is right only when he executes the system and follows his rules, and he's wrong only when he's taking random setups. A trader should find a system he's willing to work with long-term, hindsight test, backtest and then execute live, then refine until perfection.
🚀Thanks for your BOOSTS and support🚀
💬Send your comments and questions below, share your ideas and charts, I'll be glad to talk to you💬

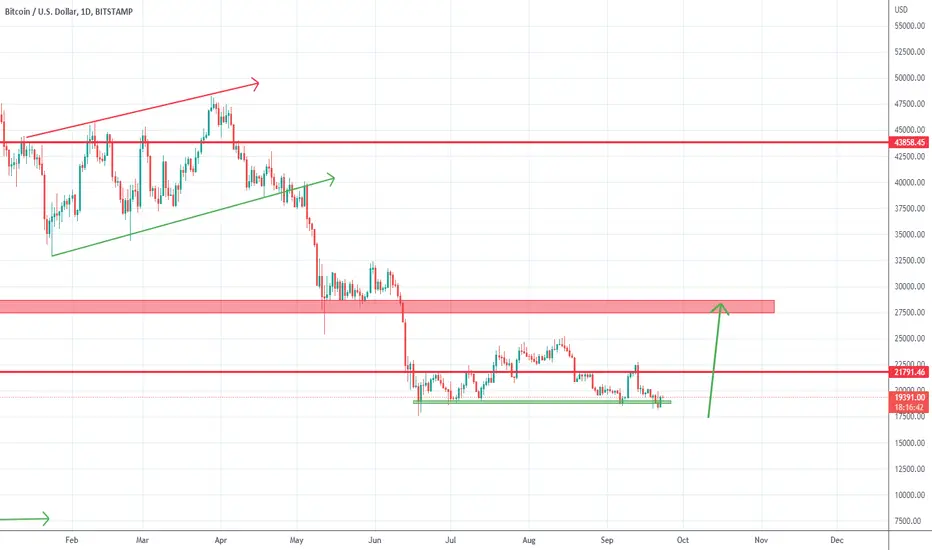
Will Bitcoin break under support?Again, Bitcoin is under pressure, and, after an abrupt reversal triggered by CPI data last week, the main crypto si pressing in extremely important support that lies between 18000 and 18500.
The price action in the past 3 months is an H&S and a new drop is looming.
The target for this pattern is around 12k which coincides with a previous zone that acted as support or resistance.
As long as 21k is intact, bears hold the upper hand and only a daily close above this figure would lift some of the weight.

Bitcoin forecast and idea 🧐Hi traders,
⭐ After the price hits the resistance line and a view of the fall of Ethereum, we will most likely see a fall in Bitcoin price.
Probably a short-term fall and the reach $17,500 price for a little time
------------------------------
✅ ✅ Risk warning, disclaimer: the above is a personal market judgment and analysis based on published information and historical chart data on The trading view,
And only some of these analyzes are my actual real trades.
I hope Traders consider I am Not responsible for your trades and investment decision.
------------------------------
✅ Please write any advice or suggestions.
Dear friends, request any cryptocurrency pair, currencies pair for forex, and any index that you want to be analyzed, and ask any questions about chart analysis.
Thanks for your attention

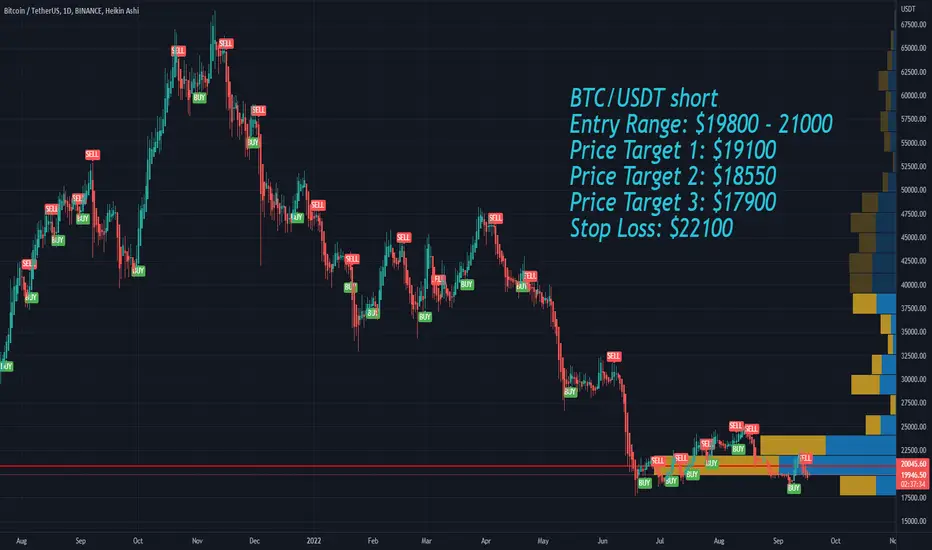
Bitcoin heavy coin inflow into exchangesNext week we have the FOMC meeting.
Most likely the Federal Reserve will raise rates by 75 basis points. In case of 100 basis points increase, i expect a sell-off in the markets.
Major cryptocurrencies have seen heavy coin inflow into exchanges recently.
I expect a strong sell pressure next week.
BTC/USDT short
Entry Range: $19800 - 21000
Price Target 1: $19100
Price Target 2: $18550
Price Target 3: $17900
Stop Loss: $22100