Bitcoin Tests Support at $110,500: Will the Downtrend Continue?The chart shows that Bitcoin is in a descending channel, with higher price levels being blocked, creating lower highs. Recent price action has formed a "lower high" pattern and is continuing to move downward.
BTC is currently testing support at the $110,500 level, and if broken, Bitcoin could easily drop to the $109,800 region. This is a level that traders need to watch closely, as if it fails to hold, the price may fall even further.
Recent news about significant liquidations from whales and cautious sentiment from Bitcoin ETFs is pushing the market toward a bearish trend. The actions of large investors, along with the fluctuations of other currencies like the USD, and price adjustments from previous resistance levels further reinforce the downtrend.
Wishing you successful trading!
Bitcointrading

SOLUSDT: Strong Uptrend with Solid SupportSOLUSDT is currently showing a strong upward trend thanks to the stability of the cryptocurrency market and a positive risk sentiment from investors. The Solana (SOL) token is receiving significant support from fundamental factors, such as a stable commodities market and the pressure on the US dollar due to the Federal Reserve's interest rate cuts.
From a technical perspective, SOLUSDT is testing the important support level at $199.00. If this level holds, the likelihood of a rebound and continuation of the uptrend is very high. The next resistance level is expected to be at $218.00, and if this level is breached, the price could continue towards $230.00.
The upward trend line remains intact, providing positive signals for the next move. Based on both fundamental and technical factors, SOLUSDT is likely to maintain its upward momentum if the support at $199.00 holds.

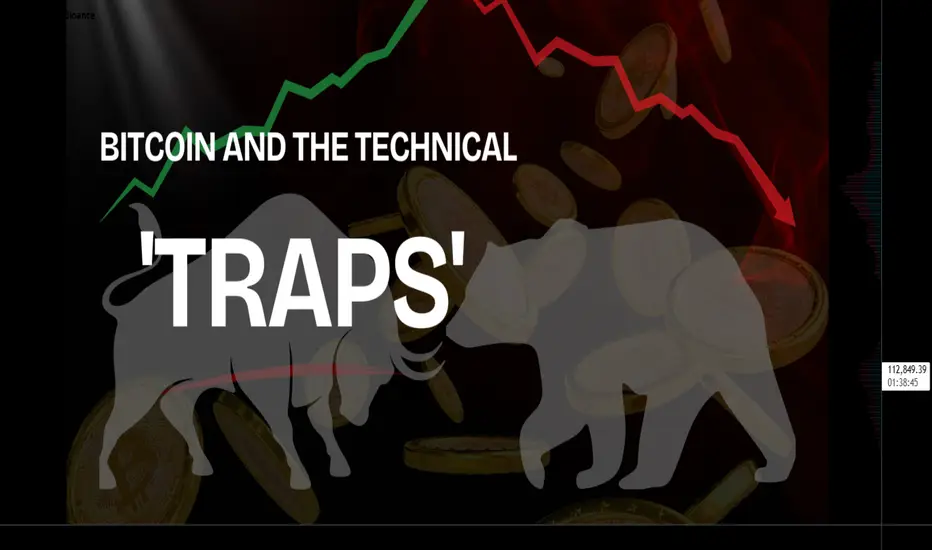
How to Avoid Bear and Bull Traps When Trading BitcoinWhen trading Bitcoin (BTCUSDT), you’ve probably heard of terms like Bear Trap and Bull Trap. These are traps that the market sets to deceive us, causing us to make wrong decisions and suffer losses. Let’s explore how to identify and avoid these traps.
1. What are Bear Trap and Bull Trap?
Bear Trap: This occurs when Bitcoin's price drops significantly, leading us to believe that a downtrend has begun, so we sell. But then, the price suddenly rises sharply. The result? We sell at the wrong time and miss out on potential profits.
Bull Trap: On the other hand, a Bull Trap happens when Bitcoin's price surges, making us think that an uptrend will continue, so we buy. But then, the price reverses and drops sharply, causing us to lose money by buying too early.
2. How to Identify Bear Trap and Bull Trap
Bear Trap: When the price drops but without strong trading volume, and RSI is in the oversold region, but the price does not continue to fall.
Bull Trap: When the price rises but trading volume does not follow suit, and RSI is overbought, but the price fails to maintain the uptrend.
3. How to Avoid Falling Into These Traps
Use Stop-Loss: Set stop-loss orders at key support and resistance levels to protect your account if the market moves against your expectations.
RSI: Use RSI to identify when the market is overbought (Bull Trap) or oversold (Bear Trap), helping you make better decisions.
EMA: Use moving averages like EMA 50 and EMA 200 to determine the main market trend and avoid being misled by “false moves”."
XRPUSDT: Downtrend and Future Trading StrategyHello traders, based on the chart and the latest news on XRPUSDT, the current trend is leaning towards a downtrend. The gradually decreasing resistance indicates strong selling pressure, and XRP is trading below the Ichimoku Cloud, confirming the short-term bearish trend. XRP has dropped sharply from $2.87 to $2.77 on September 23, 2025 , due to a contract liquidation event worth $1.7 billion, mainly from long positions, causing further price correction.
With resistance at $2.8900, if the price cannot break through this level, the likelihood of a further decline towards $2.6200 is high. This is the next key support level to watch. If the downtrend continues, this support zone could be tested again.
Trading Strategy: Watch for selling opportunities near the $2.8900 resistance and set a stop-loss if the price moves above this level.

$BTC Sunday Update Nothing has changed, structure still intactCRYPTOCAP:BTC Sunday Update
Nothing has changed, structure still intact I’m still holding my short, staying patient for the lower targets ahead. If BTC makes a push into 120, 125K, that’s where I’ll load more. My downside map stays the same: 105K → 100K → 95K → 90K. Altcoin pumps look like nothing more than liquidity traps set by market makers before the real drop unfolds.
BITCOIN GOLDEN ZONE RESISTANCE FOR NEXT LEG DOWNThis is continuation and update on my previous analysis on Bitcoin. As noted earlier Bitcoin found support on the weekly 21 EMA and has retrace to the golden fib zone. The overhead resistance on the weekly chart is still intact with the double tops shooting stars. The daily chart is presenting itself as the lower high at the golden fib zone. Indicators are also pointing to the lower side as there is no strength on RSI and MACD. From these signals I still expect BTC to sell off to the bearish targets with the initial target at $105,724. There is also the likelihood that price consolidates at this zone for a moment before the pullback.
The trade idea and plan will be invalidated if we get a candle open and close on the daily chart above the golden zone of about $118k.
Thanks for listening and reading my publications and please share your thought in the comments sections if you see otherwise or support the trade idea. Let beat the market together. Cheers!!!

Pending UltraShort SELL signal pendingLet's be honest, there's no crystal ball on BTC, but the way it trends seems like it does follow a very nice path for trading. The candles show weakening at the top and potentially a nice drop. It's probably waiting on the jobs report this morning at 8:30am ET which will likely look horrible (again).

Bitcoin BTC price analysis FOMC Fed rate🚀 CRYPTOCAP:BTC price is rising, while altcoins remain silent.
What happens tomorrow when the Fed announces its new rate? 🤔
📊 Expectations:
98% believe in a -0.25% cut
2% expect -0.5%
and no one believes it will stay unchanged at 4.5%
That’s why the market has already priced this in. But tomorrow, once the official decision comes — everything could flip ⚡️
📉 The chart looks like chaos to most, but a "trained eye" sees harmony: candles moving level to level.
🔑 Key zones for OKX:BTCUSDT :
Upper channel boundary: $117,800 – $118,000 (only breakable on massive volumes).
September is statistically weak. It opened at $108K, that’s the “zero point”. Logical scenario — dip to $102K.
😬 Worse scenarios:
$96,500
GAP close at $91,600 (but you’ll roast us for this one 😂).
❓Your take: By the end of September, will #Bitcoin be above $108K or below?
______________
◆ Follow us ❤️ for daily crypto insights & updates!
🚀 Don’t miss out on important market moves
🧠 DYOR | This is not financial advice, just thinking out loud.

BTC / USDT : Falling wedge breakout confirmedBitcoin (Update)
BTC has confirmed a breakout from the falling wedge pattern. After some consolidation, we anticipate a strong bullish move toward the $124,000 zone.
Keep it on your radar — breakout confirmation is in place, momentum could build quickly. Always manage risk in volatile conditions.

BTCUSDT - What next ?? We can see a retest of 111k7 level, but bitcoin was not successful in closing above it.
111K7 continues to remain as our area of interest for now. Closing above which we will change bias.
For now bitcoin is still bearish....
Happy Trading!!!

BTCUSDT.P 1D Time frameMarket Overview
Current Price: ~$112,380
Daily Change: Slight dip (around –0.3%)
Volatility: At multi-month lows, meaning the market is consolidating before a possible breakout.
📈 Key Levels
Immediate Resistance: $112,800 → price needs to clear this for upside continuation.
Next Resistance Zones: $114,000 → $116,000, and further up around $128,000.
Immediate Support: $111,000 → first cushion below current price.
Deeper Support: $110,000, then $107,800–108,000.
🔎 Technical Indicators
RSI (14-day): ~43 → Neutral, showing neither overbought nor oversold conditions.
MACD: Bullish crossover → suggests upward momentum is building.
Stochastic Oscillator: Near oversold → possible short-term bounce.
🧭 Outlook
Bullish Case: A sustained breakout above $114,000 could open a rally toward $128,000.
Sideways Case: Holding between $111,000 and $113,000 keeps Bitcoin in consolidation.
Bearish Case: A break below $110,000 could trigger a move toward $108,000 or even $102,000.
Overall Bias: Moderately bullish, but the market is in a tight range and waiting for a breakout.

AMD 3Hour Time frameAMD 3-Hour Snapshot
Current Price: $155.82
Change: +2.91% from the previous close
Market Cap: $252.87 billion
P/E Ratio: Not specified
Beta: 1.89
🔎 Key Levels
Resistance:
R1: $160.00 (recent high)
R2: $165.00 (next resistance zone)
Support:
S1: $150.00 (immediate support)
S2: $145.00 (next support level)
📈 Technical Indicators
RSI (14): Not specified
MACD: Not specified
Moving Averages:
5-period SMA: Not specified
50-period SMA: Not specified
200-period SMA: Not specified
📌 Market Sentiment
Recent Catalyst: Positive momentum following recent gains and analyst upgrades.
Sector Performance: Semiconductor sector showing strength, with AMD leading gains among peers.
Options Activity: Significant trading in call options at $160 strike price, indicating bullish sentiment.
📅 Outlook
Bullish Scenario: A breakout above $160.00 could lead to a push toward $165.00 and higher.
Bearish Scenario: A drop below $150.00 may test support around $145.00.
Overall Bias: Moderately bullish, with positive momentum but facing near-term resistance.

Bitcoin EMA update - Big day today ?This chart uses the EMA, Simple Moving Average
Red = 50, Blue = 100, Green = 128, Yellow = 200
Today, PA is once again up against the 50 EMA that has become resistance.
This is just below the important level that would allow us to make a higher high if PA breaks through.
A Higher High is made if we rise above 113452
We can see that the 100 SMA is also now on a local line of support.
So it is decision time for PA today.
To remain in an ever decreasing area, a squeeze, or Break out above the 50 ( 112967 ) or fall below the 100 ( 110831 ) and the local support.
As you can see, this is a very tight range
This is continued with the 128 SMA at
109134
A Lower low is made if we drop below 107165
Daily MACD still rising Bullish
This is only just and not really showing to many sighs of a "Surge". The Histogram is green but is we look bak, we can see a similar rise in Mid August that failed to continue.
However, It has room to move higher when ready, by a substantial margin.
The 4 Hour PA charts shows ua how the Bulls have been at work
PA continues to besandwiched between the 200 EMA and the 50.
If this pattern continues, we can expect to see PA rejected today by the 200 EMA and return to the 111200 area.
The 4 hour MACD
The Histogram shows us the hesitancy of PA. This is nit such a bad thing PA seems to be waiting, maybe for the FED on 17th.
I am not sure that PA can continue this long and I feel a reaction will be made prior to this date.
This may be a Dip lower, A LONG destroyer just before we see a move higher,, should the FED lower rates.
But trying to predict BTC Moves is foolhardy...............
Today will certainly give us an idea of future direction........

BTC $100K IN SEPTEMBERBitcoin (BTCUSD) appears to be following a repeating market structure characterized by impulsive bullish moves followed by corrective retracements — consistently around the 50% ranging level. This pattern has now repeated at least 4 times on the HTF, suggesting a high-probability continuation to the upside, potentially targeting $100,000 by September if the pattern continues to play out.
Pattern Analysis:
- The chart illustrates a step-wise bullish structure with four distinct impulse legs, each followed by a retracement to roughly the 50% level.
- Each consolidation zone is marked in red, with retracement levels clearly visualized.
- The 50% retracement areas acted as strong demand zones, consistently leading to the next impulsive move.
One of the key reasons this 50% retracement structure continues to repeat itself is due to the increasing involvement of institutional players and large entities (commonly referred to as "whales") in the Bitcoin market. Since the launch of spot Bitcoin ETFs and broader institutional acceptance, the market dynamics have fundamentally shifted from retail-dominated speculation to more structured accumulation and distribution strategies.
Why Institutions Favor the 50% Retracement:
Volume-Based Accumulation:
- Large players cannot enter or exit the market in one move without causing slippage or exposing their intent.
- They use retracements (typically to the 50% level) to accumulate positions quietly after a strong impulse move.
- These retracement zones offer optimal risk/reward entries for funds looking to scale into long positions.
Liquidity Creation:
- Before large entities can buy in size, they need liquidity — often created by shaking out weak hands through retracements.
- A 50% pullback tends to scare off retail traders, providing the perfect entry for institutions under the radar.
Algorithmic Market Making:
- Many institutional players use algorithmic trading systems that operate on Fibonacci retracement models and volatility-based levels.
- The consistency in structure indicates the presence of well-coordinated algorithmic strategies that respect these levels mechanically.
Market Maturity:
- As Bitcoin matures, it behaves more like traditional assets (stocks, commodities), where institutional order flow shapes the charts.
- The repeated structure is reminiscent of what you often see in Wyckoff accumulation phases, followed by markups, a method often used by professionals.
Supporting Evidence:
The ETF flows have brought billions of dollars in long-term capital into the Bitcoin market — capital that moves with patience, not panic.
Open interest and on-chain data (not shown in this chart but available) reveal large wallet accumulation during retracement phases.
Each retracement occurs on decreasing volume and volatility, suggesting absorption rather than panic selling — a classic institutional signature.
Conclusion:
What we’re seeing on the chart is not just technical symmetry, but the visible footprint of large, sophisticated players using the market structure to their advantage. The repeating 50% retracement pattern is a direct reflection of this, smart money accumulating during fear, then driving the next leg up once retail is out of position.
As long as this structure continues and fundamentals align, the path to $100K by September remains valid and supported by both technical patterns and institutional behavior.
This whole idea invalidates only if we break ATH.

Bitcoin trade planGot rejected from 112k , Looking forward to build a short position to 100k as swing short!
Close below 110k and we go short..
Waiting
Let's see how it plays...

BTC - Short Plan Update / Reminder Anyone who didn’t take this trade at top entry may enter at the lower level here.
Entry - 110,500-111,000
Stop Loss - 113,000 (High Risk) to 120,000 (Low Risk)
Targets:
1) 81,000
2) 61,000
3) 36,000
4) 9,000
Personally I will time any crypto related trades with this pathway. Everything will drop and rise with bitcoins movement.
Happy trading.
Disclaimer - this is not financial advice and outlines my personal trade plan only

$BTC bounced to the 112K zone as expected, with even a shotCRYPTOCAP:BTC bounced to the 112K zone as expected, with even a shot at 115K possible, but I’m still holding my short from 116K. If we revisit my entry area, I’ll look to add more. For now, I’m staying in the trade and will share updates if anything changes. Targets remain 100K → 95K → 90K.

Bitcoin Daily SMA UPDATE
This daily chart uses the SMA, Simple Moving Average
Red = 50, Blue = 100, Green = 128, Yellow = 200
Yesterday, PA broke through the descending line of resistance it had been under since 13 August.
As yet, this does not mean PA will now rise, though on a daily chart, the MACD certainly has the room to move higher, as seen below
However, given where we are in a traditionaly quiet month, I do still see PA sliding down this line in the bear future...testing it as support
This maybe supported by the fact that the shorter term 4 Hour MACD has Crossed Neutral but the Hitogram is showing White bars and not Green. This shows a weakening and the MACD line moving closer to the red signal line.
The Daily RSI is also turning over but remains above its MA for now
So for now, we see PA has broken over the Daily 100 SMA and is testing as support.
Above, we have the 50 at 113300
This could be the next line of resistance if PA rises now.
Should PA turn down now, we have the 100 SMA at 110762.
Below that , the 128 sits at 108194
To remain above that descending trend line, we need to Range in the area we currently are in and stay above that 100SMA at 110K for at least the next 24 hours
If we look at the Bitcoin 4 hour chart, we see this maybe possible
PA sits in a very tight range between the 50 and the 100 4 hour SMA and is currently sitting on the VRVP Point of control ( red dotted line )
This is all support but we have to wait and see if it remains so.
There is Very little action trading right now...we just waiting.

Btc looks bearish Bitcoin bears were successful in forming a new lower high during this small time frame down trend. If we do not close above 110k bitcoin will remain bearish.
Next support :- 105k and 100k

#Bitcoin Bearish Sunday Update: $BTC short taken from 116K,#Bitcoin Bearish Sunday Update:
CRYPTOCAP:BTC short taken from 116K, and now BTC is already trading near 108K. I’m still holding my short position.
First target is 100K, then looking for 95K → 90K.
🔸 Market View:
No matter if BTC pushes into 112K–115K, the structure remains bearish. The CPI data outlook is also bearish for markets, adding more pressure. September will be brutal. Everyone is talking about the CPI data being very bearish, but I believe this is just a sell-the-news event. Be careful — I already told you the market is ready to dump.
🔸 Outlook:
I continue to hold my short from 116K and will update as targets get hit. The bigger picture stays bearish until we see real capitulation in the lower zones.

$BTC: -$4000 in 10min – panic or opportunity?Here's our take:
🔹 Historically, such sharp CRYPTOCAP:BTC drops used to cause -20% to -40% crashes in altcoins.
Now, some alts are holding, others correcting mildly, and a few are even rallying.
🔹 In the last 24 hours, $840M was liquidated.
Roughly 80% were long positions.
Historically, reversals often start after $1.1–1.3B in total liquidations.
🔹 BTC Dominance (BTC.D) and Tether Dominance (USDT.D) are forming readable, consistent patterns.
👉 Current thesis: OKX:BTCUSDT will likely continue its movement inside the falling purple channel.
If price reaches $107–108K, we’ll consider closing our short bot to reassess market conditions.
💬 What’s your perspective? Share below.
______________
◆ Follow us ❤️ for daily crypto insights & updates!
🚀 Don’t miss out on important market moves
🧠 DYOR | This is not financial advice, just thinking out loud.

How Potentially Manipulated NFP Data Could Affect BTC's PricBitcoin rallied last Friday after Federal Reserve Chair Jerome Powell's prepped the market for an interest rate cut in September.
However, these gains have faded, with Bitcoin back to where it started last Friday; around $112,000.
The market's focus is now shifting to the upcoming U.S. Non-Farm Payroll (NFP) report, scheduled for release next week, which could greatly influence interest rates expectations.
Strong job data may reduce the likelihood of a September rate cut.
And with an Orwellian portrait of Trump now hanging from the Department of Labor Building, and his administration potentially pressuring the Bureau of Labor Statistics to inflate job numbers, this scenario is becoming a real possibility. If this happens, we could expect price action to test the lower Fibonacci retracement levels, such as the 141.4% at around $109,900 or further at $108,700.
Bearish BTC is coming; Candle confirmation at 110k is neededAfter falling below 110k, I believe BTC is going to have the ''Last Kiss'' scenario to confirm its bearish momentum. While it has come up again towards 110k, I believe it's going to confirm the bearish scenario and goes for 107k, 105k and 103k in a short period. But for a long overview, 95k is probable.
