BTC BUY ALERT
📌 Trade Plan:
🔓 Entry: 89000
❌ Stop Loss: 88500
🎯 Target: 90000
🔥 BTC BUY ALERT – 89,000 Zone
Buyers stepping in strong! Momentum building toward 90,000.
Clean setup, high-probability entry, perfect risk-reward.
⚠️ Trade with discipline. Educational purpose only.
Bitcon

BITCOIN HIGH PROBABILITY BUY SETUPSOON!!!🚨BTC HIGH PROBABILITY BUY SETUP 🚨
* Here We Can See Clearly The Next Potential Moves For BTCUSD Coming Hours.
* Keep Your Eyes Close On Your Trading Positions.
* Happy PIP Hunting Traders.
FXKILLA.

Short Idea – Rejection From ResistancePrice is trading directly into a clear resistance zone and continues to fail holding above it. Each push higher is getting sold, showing buyers are losing control.
Instead of acceptance above resistance, price is consolidating below it — a common sign of distribution. Lower timeframe structure is starting to weaken, with lower highs forming under resistance.
As long as price stays below this zone, I’m looking for a downside move into the prior demand/liquidity area below. Clean invalidation if resistance breaks and holds.
TARGET IS 86200

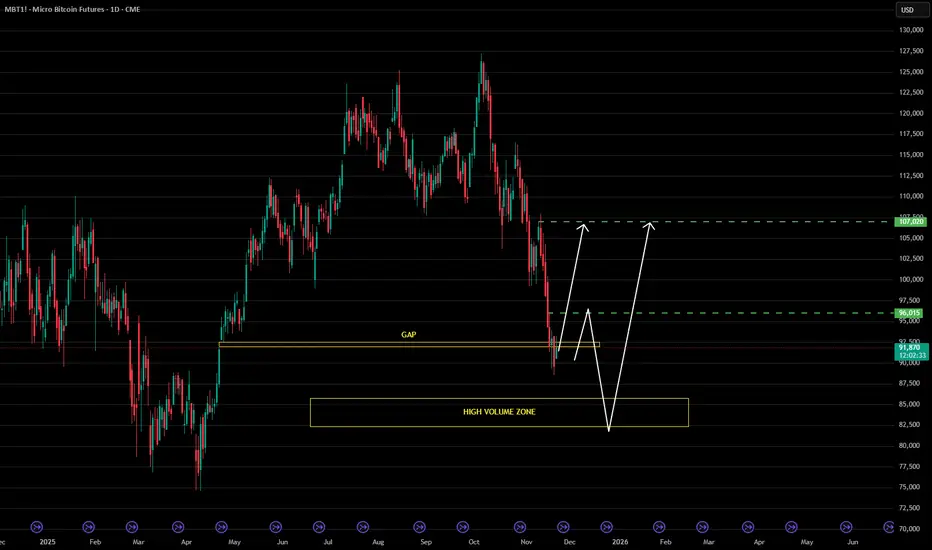
Tokenization Push by US Government Will Unleash a Demand ShockCME: Micro Bitcoin Futures ( CME:MBT1! ) and Micro Ether Futures ( CME:MET1! )
On December 8th, U.S. Commodity Futures Trading Commission (CFTC) announced the launch of a digital assets pilot program for certain digital assets, including BTC, ETH, and USDC, to be used as collateral in derivatives markets.
This announcement marks a significant milestone in expanding the adoption of digital assets in regulated markets with appropriate guardrails. In my opinion, the flood gate has just opened. It will let in organic growth of crypto demand in hundreds of billions of dollars.
Collateral Assets in Derivatives Markets
Unlike the fully-funded cash market trades, futures and options contracts are transacted using performance margins. This important feature allows investors to get large exposure (in contract notional value terms) with a smaller upfront deposit (initial margin). The built-in leverage improves capital efficiency and could help enhance returns.
Futures and options positions are marked-to-market on a daily basis. If a contract is not settled by the end of the day, the traders on both the long side and the short side of a trade are required to keep their margin account balance above the threshold set by the clearinghouse (maintenance margin). The Exchange’s clearinghouse manages client collateral assets. If the open interest is huge, this could amount to billions of dollars.
Take CME Group, the largest Derivatives Exchange holding company, as an example:
• Total combined Open Interest is 234,389,524 contracts on December 12, 2025, according the CME Group website.
• CME Group had performance bond assets at $149.0 billion on September 30, 2025, according to data released by CME Group in its 10Q report, October 24, 2025.
CME Clearing takes the following types of assets as acceptable collateral:
• US dollar
• Foreign currencies: subject to haircuts and caps
• US treasuries: bills, notes, and bonds, as well as TIPS
• Gold: COMEX gold warrants and London gold bullion
• Agency: selected U.S. government agencies and mortgage-backed securities
• Stocks and ETFs: blue-chip stocks, subject to a 25-30% haircut
• Corporate bonds: high rated bonds, subject to haircuts and caps
CME Clearing does not currently accept cryptocurrencies as collateral. With the CFTC-backed pilot program, BTC, ETH and USDC could likely be added to the menu.
In my November 3rd market commentary, “Bitcoin: from Pet Rock to Loan Collateral”, I discussed the significance of JPMorgan accepting crypto ETFs as stock lending collateral.
JPMorgan, being the largest US bank, could influence other banks with its action. The CFTC pilot program takes the matter to the next level. US regulators are issuing policies pushing for crypto adoption.
Trump Administration Pro-Crypto Policies
Since returning to the White House in January, the Trump Administration have brought about a series of pro-Crypto policies. These include President’s executive orders, laws passed by Congress, as well as new rules enacted by various federal agencies.
• Executive Orders: Trump signed executive orders to establish a presidential working group to propose a new federal regulatory framework and created the Strategic Bitcoin Reserve and a U.S. Digital Asset Stockpile.
• The GENIUS Act: This act, signed into law in July 2025, provides a regulatory framework for payment stablecoins, requiring 1:1 reserves and compliance with AML rules, and clarifies they are not securities or commodities.
• Securities and Exchange Commission (SEC): The SEC issued SAB 122 to facilitate crypto custody services by banks. It established a "Crypto Task Force" and issued statements clarifying that certain stablecoins are not securities.
• Department of Justice (DOJ): The DOJ now prioritizes cases involving clear financial harm and disbanded the National Cryptocurrency Enforcement Unit.
• Banking Regulators: FDIC and Federal Reserve rolled back previous guidance, allowing banks to engage in crypto-asset services without prior non-objection letters.
• IRS: The IRS is focusing on accurate record-keeping and disclosure for the 2025 tax year, while eliminating certain DeFi reporting rules.
• Department of Labor (DOL): In August 2025, DOL issued guidance to clear the way for 401K plan sponsors to offer digital assets as an investment option.
• Future Legislation: Bills under consideration include the CLARITY Act to define most digital assets as commodities and the Anti-CBDC Surveillance State Act to codify the ban on a U.S. CBDC.
Industry adoption may start slowly, but once core financial assets are tokenized, we will see huge crypto demand, specifically for Bitcoin and Ethereum.
• Strategic Bitcoin Reserve could grow to a trillion-dollar sovereignty fund.
• The $9 trillion U.S. 401K market: Even if only 5% of the retirement asset is held in cryptos, the new demand will be half a trillion dollars.
• If 10% of CME collateral assets gets tokenized, it will be $15 billion in BTC, ETH and USDC. Once other Exchanges and the OTC derivatives market follow suit, new crypto demand could grow to $100 billion.
Riding the ride with Micro Bitcoin and ETH Futures
Bitcoin has declined 30% in the last two months, while ETH suffered a 40% loss. Such pullbacks are common throughout the history of cryptocurrencies. If we take the long view, the crypto “gold” and “silver” could rise again on the back of new organic demand.
Traders who share the bullish view on Bitcoins and Ethereum could explore CME Micro Bitcoin Futures ( PSE:MBT ) and Micro ETH Futures ( NYSE:MET ).
The MBT contract has a notional value of 0.10 bitcoin, as defined by the CME CF Bitcoin Reference Rate (BRR). On December 12th, the January 2026 contract (MBTF6) is settled at $90,960. Each contract has a notional value of $9,096. To buy or sell one contract, CME Group requires an initial margin of $2,184. By design, this futures contract has a built-in leverage of 4.2-to-1. When bitcoin goes up, futures positions could enhance the return by four times compared to spot bitcoin positions.
MET has a notional value of 0.10 ETH. On December 12th, the January contract (METF6) is settled at $3,104, putting the contract value at $310.4. The initial margin is $100, implying a built-in leverage of 3.1-to-1. When Ethereum goes up, futures positions could enhance the return by three times compared to spot ETH positions.
What happens if Bitcoin or Ethereum drops? For price protection, traders could enter a buy order with a stoploss. For example:
• A long MBTF6 order at 91,000 with a stoploss of 85,000 limits the maximum loss to $600 (= (91000-85000) x 0.1).
• A long METF6 order at 3,100 with a stoploss of 2,800 limits the maximum loss to $30 (= (3100-2800) x 0.1).
In addition to margin (leverage) and stoploss (loss protection), both Micro Bitcoin and Micro ETH have a daily price limit at 10%. This feature is particularly helpful when the market is panicky. Price Limit or Circuit slows down the irrational price movements until cooler heads prevail.
Happy Trading.
Disclaimers
*Trade ideas cited above are for illustration only, as an integral part of a case study to demonstrate the fundamental concepts in risk management under the market scenarios being discussed. They shall not be construed as investment recommendations or advice. Nor are they used to promote any specific products, or services.
CME Real-time Market Data help identify trading set-ups and express my market views. If you have futures in your trading portfolio, you can check out on CME Group data plans available that suit your trading needs www.tradingview.com

GET READY FOR BITCOIN HIGH PROBABILITY LONG SETUP SOON!!!🚨BTC HIGH PROBABILITY BUY SETUP 🚨
* Here We Can See Clearly The Next Potential Moves For BTCUSD Coming Hours/Days.
* Keep Your Eyes Close On Your Trading Positions.
* Happy PIP Hunting Traders.
FXKILLA.

BTCUSD: It’s All Going According To PlanPrice came down as expected. Now we have entered into a consolidation range before proceeding lower. This is normal and in the bots algorithm to short Bitcoin again. The key target to wait for on the pullback is between 95k-105k. After this stop, price will decrease over the next year to between 50k-60k; that’s where the buying will come in and the next cycle will start.

Perfect Execution - Waiting for Confirmation Saves AccounsKey levels attract attention, but attention alone rarely produces good trades. A level gains meaning only when price shows how it behaves around it. Many traders understand where important levels are, yet still lose money because they enter too early, assume a breakout will continue, or anticipate a reversal before the market confirms it.
Patience at these levels is what separates disciplined execution from unnecessary losses.
A key level acts like a pressure point. Liquidity gathers above highs, below lows, and around clear support or resistance.
When price approaches these zones, it does not move cleanly. It probes, sweeps, hesitates, or accelerates depending on who holds control. Entering at the first touch is often an emotional decision disguised as confidence. Entering after confirmation is a structured decision grounded in evidence.
Confirmation begins with a reaction. A legitimate bounce or rejection has intent behind it. You will see displacement, cleaner momentum, or a defined shift in micro-structure. A candle wick alone is not confirmation.
A single green or red candle is not confirmation. Confirmation comes when the market shows that a level is respected or rejected with conviction, as several conditions align.
One of the clearest signs of confirmation is the break of micro-structure after the level is touched. If price sweeps a low and then breaks a minor high, the narrative changes. The same applies to resistance: a sweep followed by a failed attempt to push lower is evidence of buyers stepping in.
This structural shift shows that the reaction is more than a random bounce.
Another layer of confirmation is the retest. Strong moves often return to the level they broke to validate participation.
Traders who enter before this retest expose themselves to unnecessary volatility. Traders who wait allow the market to prove that the move is real, not a trap.
The retest reduces risk naturally and improves the reward-to-risk ratio without changing the strategy itself.
Patience does not slow you down. It filters out trades that look attractive but lack substance. Key levels attract liquidity, manipulation, and emotional behaviour.
Waiting for confirmation keeps you grounded when the market is trying to provoke a reaction. It prevents you from turning strong levels into weak trades through premature entries.
The goal is not to catch the exact top or bottom of a move. The goal is to participate in moves that show clear strength and clear intent.
When you treat key levels as decision points rather than entry signals, your trading becomes structured, disciplined, and far more consistent. Patience is not passive. It is an active skill that protects your account and elevates your execution.

BTCUSD: Bullish OB Test Done Now Watch the Drop BTCUSD – Bullish OB Reaction & Potential Drop Setup
Price has tapped into a fresh Bullish Order Block, triggering a short-term push upward. But structure is showing signs of liquidity building above, meaning market may engineer one more liquidity sweep before a deeper move.
I’m expecting price to create a range, grab liquidity from the top, and then drop toward the strong support zone where multiple confluences align.
🧠 Key Points
🔸 Bullish OB tested – short-term reaction expected
🔸 Liquidity resting above current highs
🔸 Fake-out possible before a sharp bearish move
🔸 Strong support zone is my reversal area
🔸 Main target: 89,564 zone
📉 My Plan
I’m waiting for price to sweep liquidity above the OB → form bearish confirmation → then target the demand area below.
This setup combines liquidity, structure, OB, and support levels, giving high probability for a clean move.

BTC analysis 8 DecBTC – Bullish Outlook with Planned Laddered Entries
📌 Overall Trend
My higher-timeframe bias on Bitcoin remains bullish.
I expect the current pullback to create liquidity for continuation to the upside.
⸻
📥 Laddered Buy Zones
I am planning to accumulate in three key demand zones:
• $90,500
• $88,650
• $85,907
These levels align with previous reaction zones and liquidity pockets that could serve as bases for bullish continuation.
⸻
🔍 Entry Criteria (Very Important)
I will NOT enter blindly into these zones.
For each level, I will wait for:
✔ CHoCH (Change of Character)
✔ Break of Structure on the 15-minute timeframe
Only after a clear shift in market structure will I execute entries.
This filter significantly increases win-rate by avoiding ignored or weak zones.
⸻
🎯 Trade Plan Summary
• HTF trend: Bullish
• Looking for a corrective move into demand
• Entry only with 15m CHoCH + BOS confirmation
• No confirmation → no trade

Bitcoin (BTCUSDT) Technical Analysis – December 5, 2025Strong downside momentum is currently dominating on the lower timeframes. Bitcoin has once again dropped below the $90k mark.
This entire drop from the ATH (~125,769) fits beautifully into the classic Fibonacci retracement structure — price got rejected right at the 0.618 level (94,657), and despite a temporary bounce off the 0.5 retracement (99,980), bulls lacked the strength to push further. Currently, we’re trading below the 0.382 level (88,799), which is now acting as resistance — and it’s no coincidence that price today has been struggling exactly at that zone.
In addition, today’s move has perfectly filled the Fair Value Gap (FVG) from April 22, which is now completely closed. That gap also lines up with the 0.382 level of the local (smaller) Fibonacci retracement.
At the local bottom (around 83,500), we saw a classic swing low with a long lower wick, followed by a bullish candle — this is forming the early signs of a bullish engulfing pattern. Volume-wise, that candle printed a significant spike, showing strong buyer interest. Looking at cumulative volume, it’s clear that there was a notable absorption of sell pressure by larger players in that zone.
If bulls fail to reclaim the 88,800 level, a retest of the 0.886 Fibo (82,929) is likely, or even a deeper drop toward the 1.272 and 1.414 Fibonacci extensions (77,012 and 74,058). Just below that, we have a strong demand zone around 72,000–74,000, which overlaps with previous consolidations and historical FVGs.
What’s Next? 🙄😎
The current move looks like a potential end to the corrective wave, with a local bottom near 83,500, key support at 82,900, and resistance at 88,800. If price can break above that and close a daily candle higher, then 94–96k is back on the table. On the flip side, if the red descending channel holds, we could see further liquidation sweeps down toward 74–77k.
Volume signals and oscillator momentum are starting to flash a bullish bias, but bears still have the upper hand until the 0.5 Fibonacci level (99,980) is broken and the descending channel is invalidated with a proper close above it.
For now, all eyes on how price reacts around 88,800 and 92,000 — those are the key breakout levels that could confirm a larger trend reversal.

MARA HIGH PROBABILITY BUY SETUP SOON!!!🚨 MARA HIGH PROBABILITY BUY SETUP 🚨
* Here We Can See Clearly The Next Potential Moves For MARA Coming Hours/Days.
* Keep Your Eyes Close On Your Trading Positions.
* Happy PIP Hunting Traders.
FXKILLA.

BTCUSD – Strong Bounce + Double Rejection Zone AheadBitcoin gave a strong bounce from the ascending support trendline, the same place price reacted earlier.
This repeated reaction shows that buyers are actively protecting this area, creating a clear higher-low structure.
Now price is pushing back toward the major rejection zone marked on the chart — the same level where BTC got rejected twice (eye emojis).
This zone is not a random area; it’s a strong liquidity pocket where sellers previously dominated.
But this time the price is approaching with momentum, and the recovery candle is large and clean.
✨ My View
If BTC breaks above this rejection block with strength, I expect continuation toward the next expansion level.
Based on the structure and extension outlook, my expectation zone is:
🎯 Expectation Level: 96,300
Once this resistance zone is cleared, BTC normally moves quickly because there’s not much structure above it — it’s open space for momentum expansion.
The current trendline bounce + aggressive push makes this level realistic.
🔥 Why This Setup Stands Out
- Clean bounce from a strong diagonal support
- Two previous rejections at the same block → now acting as a breakout point
- Strong upside momentum
- No resistance between breakout level and expectation level
This combination often leads to a fast move.
📘 Disclaimer
This is only my personal market approach, not financial advice.

btcTwo important points seem to me: First, I think we are close to the time to buy and we should be ready to continue. But the second important point is that the red box has not yet allowed to break and has brought the price down. The red triangle area is in high demand, so we need to see if we can make a swing buy at the current prices.

BtcusdtI think Bitcoin will bounce from the 77-80K range and touch a new high in the 140K range.
If the 77K range breaks downwards, we should wait for the 60K range.

Bitcoin: Two Development Scenarios from Gap Closure ZoneCurrent Situation
Bitcoin has completed a sharp decline and is located in the critical gap closure zone. The chart shows two key technical elements: a resistance level in the upper part of the range and a high volume zone (HIGH VOLUME ZONE) significantly below current prices. Price has stopped precisely in the gap area, creating conditions for institutional players to make their decision.
Primary Scenario: Bounce from Gap Closure Zone
An immediate reversal upward from current levels is possible with subsequent movement toward key resistance. Gap closure often acts as a price magnet and correction completion point. If limit players are ready to defend this zone, a strong bounce is possible without testing lower levels.
Target Levels:
Movement toward the upper boundary of the range
Test of key resistance where price was previously stopped
Alternative Scenario: Test of High Volume Zone
Price may continue declining toward the high volume zone (HIGH VOLUME ZONE) located significantly lower. This area represents interest for forming a long-term reversal, as high volume concentration indicates institutional position accumulation. A more powerful and sustainable reversal upward is possible from here.
Key Levels of Alternative Scenario:
HIGH VOLUME ZONE — area for potential long-term reversal
Possibility of forming a strong base for upward movement
Trading Plan
For Primary Scenario:
Monitoring price reaction in current gap closure zone
Entry into long positions upon formation of reversal patterns
Target: movement toward key resistance
For Alternative Scenario:
Waiting for decline to high volume zone
Looking for signs of selling absorption in HIGH VOLUME ZONE
Entry into long positions with more aggressive risk/reward ratio
Risk Management
Primary scenario: stop-loss below gap closure zone accounting for possible false breakout
Alternative scenario: stop-loss below high volume zone with margin for stop liquidation
Recommended to split capital between two possible entry points
Bitcoin is painfully weakBitcoin ATH break at was the first sign of weakness, now relative strength index is at levels bitcoin hasn't been at since early 2023 - big difference in price $96k 3 years in a bull market vs $22k after the horrible painful 2022 bear market. I think 2026 will be bearish for bitcoin. Mid term elections will offer uncertainty and if you look at bitcoin's performance in 2025 under the "pro crypto" administration it has been painfully weak only up around 1% YTD. I think around $75k is a good area to watch. Full global economic meltdown like 2022 and Im looking at $48k region. COINBASE:BTCUSD

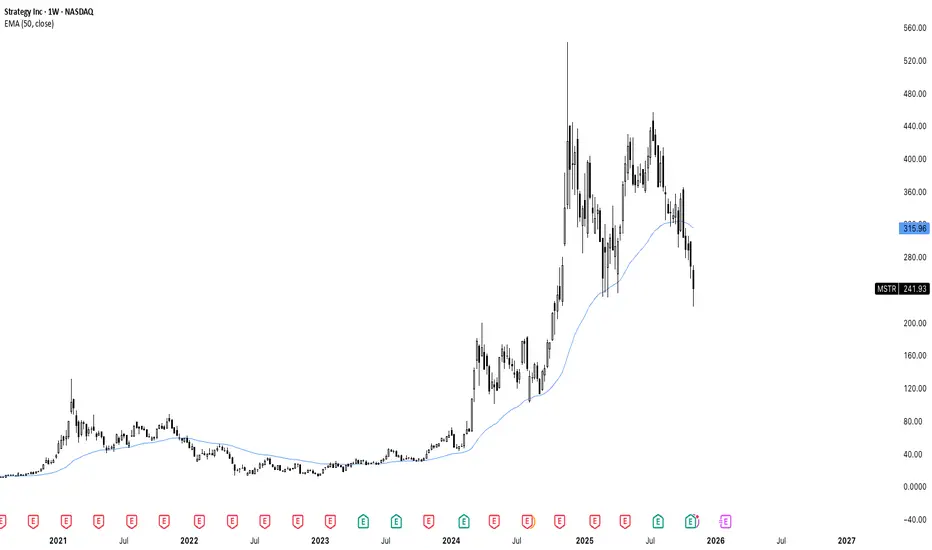
Microstrategy is who Satoshi warned us about. MSTR has broken below the 50 day moving average and is now at 52 weeks low. All while they hold the most bitcoin they ever have, now at 641,000 BTC. Some would even say they are trying to corner the market, using debt - while they claim they will never sell, but also they are not even earning any yield on their holdings. They will owe over $600 million in dividend payments next year. You simply can not create value out of thin air. NASDAQ:MSTR
IS CRYPTOCURRENCY BACK AT IT?Most cryptocurrency are at the range/point of reversal back to the top. With much anticipation and investment made we will be looking at a new ATH. This is followed by a tap into the monthly IRL especially for markets like BTC,ETH and others in line with a strike of reversal. We will hope to see further confirmations as there has been a 4hr market shift and a sweep above last Friday high gearing it down to a smart money support zone for an opportunity to buy, invest and HODL.
FOLLOW FOR MORE TIPS

BITCOIN (BTC/USD): Consolidates—Breakout or Breakdown Ahead?⚠️Bitcoin is currently consolidating following a significant bearish rally.
The price is coiling within a horizontal trading range on a 4-hour timeframe.
Based on the price's reaction to these boundaries, two potential scenarios are anticipated:
Bullish Scenario:
Should the price break and close above 104,640 on a 4-hour timeframe, a bullish trend continuation is expected.
The target for this scenario is 108,000.
Bearish Scenario:
Conversely, if the price drops and closes below 98,780 on the 4-hour timeframe, a bearish movement is anticipated.
The objective for this scenario is 96,000.
Given the current oversold market conditions, a bullish bias is held.
However, further observation is warranted to confirm the market's direction.
What are your expectations?

BTCUSDTHello Traders! 👋
What are your thoughts on BITCOIN?
Bitcoin has entered a corrective phase after reaching the top of its ascending channel and setting a new high.
The correction is still ongoing, and the price is now approaching a major support zone that aligns with the ascending trendline.
This correction is expected to extend toward the marked support area, where we anticipate a positive price reaction that could trigger a bullish reversal and lead to new highs.
In this region, traders can consider using the DCA strategy to accumulate long-term positions, as the overall market structure remains bullish.
Don’t forget to like and share your thoughts in the comments! ❤️

MicroStrategy - Mean ReversionAfter a choppy but still successful call on MSTR in Feb, we are back with another one. Heavily oversold and ready to shoot alongside $BTC.

Bitcoin Consolidates Within Symmetrical TriangleHi guys!
The chart illustrates a symmetrical triangle formation. This pattern typically signals a potential breakout scenario, though the direction must be confirmed by price action.
Key Technical Levels
Resistance Zone: Around $111,000 – $113,000, aligned with the top line of the symmetrical triangle.
Major Support: Defined by the bottom line of the triangle, currently holding near $107,000 – $108,000.
Breakout Target: Upon a confirmed breakout to the upside, the projected target for the triangle stands near $122,587, which aligns with a measured move from the pattern’s height.
Trading Plan
Bullish Scenario:
A breakout and close above the resistance zone ($111,500) would confirm bullish momentum. In this case, a long position could be considered, with the target around $122,500 as marked on the chart. This would also indicate renewed market strength and continuation toward higher levels.
Bearish Scenario:
If the price fails to break above the resistance and instead faces rejection, traders are advised to focus on short positions, anticipating a potential retracement toward the lower boundary of the triangle or even a breakdown below it. A close below the bottom trendline could signal deeper downside continuation.
Conclusion
Bitcoin is currently consolidating within a symmetrical triangle, reflecting indecision in the market. A confirmed breakout above resistance could trigger a bullish run toward $122,500, while rejection at this level would favor short setups. Traders should monitor the breakout area closely and wait for volume confirmation before committing to a position.

BitcoinBTCUSD
- Completed " 1234 " Impulsive Waves
- Break of Structure
- RSI - Divergence
- Bullish Channel as an corrective pattern in Short Time Frame
- Demand Zone
