There is a possibility for the beginning of an uptrend in BTSETHTechnical analysis:
. BitShares/Ethereum is in a range bound and the beginning of uptrend is expected.
. The price is below the 21-Day WEMA which acts as a dynamic resistance.
. The RSI is at 31.
Trading suggestion:
. There is a possibility of temporary retracement to suggested support zone (0.00031700 to 0.00029600). if so, traders can set orders based on Price Action and expect to reach short-term targets.
Beginning of entry zone (0.00031700)
Ending of entry zone (0.00029600)
Entry signal:
Signal to enter the market occurs when the price comes to " Buy zone " then forms one of the reversal patterns, whether " Bullish Engulfing ", " Hammer " or " Valley " in other words,
NO entry signal when the price comes to the zone BUT after any of the reversal patterns is formed in the zone.
To learn more about " Entry signal " and the special version of our " Price Action " strategy FOLLOW our lessons:
Take Profits:
TP1= @ 0.00034200
TP2= @ 0.00036000
TP3= @ 0.00038400
TP4= @ 0.00040900
TP5= @ 0.00044700
TP6= @ 0.00047500
TP7= @ 0.00050100
TP8= @ 0.00057000
TP9= Free
Bitshares

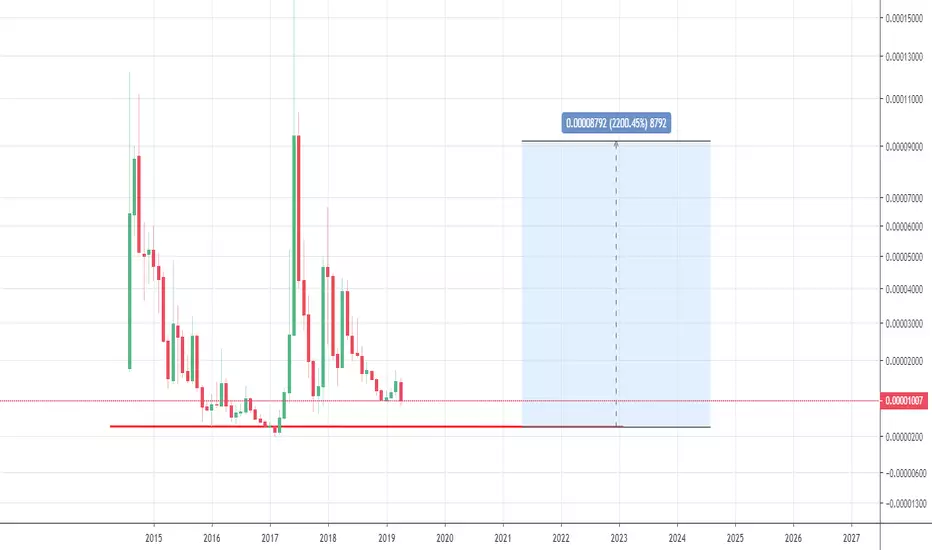
Bitshares - going down deep before the big pampBuy zone 400 sats - sell at 2000% profit - time frame 6 - 12 months.
Bitshares moving back upHello,
After a big drop Bitshares looks like its rebounding back up.
If Bitshares can pass the first support line it would for sure pass the next support which is pretty weak. If things go well Bitshares can be above 1300 sats very shortly.

Bitshares Still Moving UpwardsHello, Bitshares is moving upwards very slow the last 30 days compared to other crypto's, but as long as BTS is moving up its all good. BEOS is having an airdrop on all BTS holders that leave there BTS on the BEOS platform for 89 days starting on the 9th of April. Good new for BTS, current BTS holders will most likely take advantage of the airdrop meaning less BTS on exchanges for 89 days.
Lets see what happens.

Bitshares must make a moveBitshares has been moving sideways for a few days now. I'm seeing a bull move coming up, but if BTS dips below the red support we could see it back in the 1300 sats.
Lets see what happens as I'm rooting for another bull move since BTS is already undervalued.

BTC is looking interesting hereBTS is already colsolidating for a couple days here, with a really small range.
Could indicate that there is a lot of buying pressure to not really let this one retrace.
When it breaks resistance it could get rapido IMO
Every red dotted line is a place where i expect resistance and would take partially profits.

$BTS Trying to flip R-->S at 1450sats...$BTS Trying to flip R-->S at 1450sats... If it hodls, we can aim for new targets at 1900sats
UCTS Buy signal active (30% up)
MACD Rising, RSI at overbought levels..
Volume looks really low for now so act with caution..
Failing to hodl would be a retest of EMA10->EMA50
#BTS

BTSBTC Bitshare Buy on D1BTSBTC
Trend: uptrend
Buy on EMA20 chard D1 & trendline when price hit it.
TP: 50%
SL: 25%.

Bitshares looking goodHello,
If everything goes well we should see bts break upwards to the next resistance line at 1540 sats. So far the volume looks good, Stoch RSI is oversold, but lets see what happens.


BITSHARES +70% profit opportunity Buy SignalPattern: Higher Low Channel on 1D.
Signal: Bullish.
Target 0.08680 (the 1W Resistance Zone).


Educational video about shitcoin trading on many topicsIn this video I go through:
How to choose your exchange you buy a coin (differences between exchanges)
How to set your sell orders depending on the exchange you are on
Optimal exits (orderbooks + TA)
How to avoid your target not getting hit
How to learn faster
How to keep yourself in check when trading
Opportunity cost
When to get out and buy another coin
Why it isn't worth buying a coin that is up 200% right now
And more! All with examples of my mistakes (for which I will provide proof on twitter) explaining what went wrong.

BTS - Bitshares - Long opportunity.Bitshares seems to have hit the bottom. A falling wedge has been formed. MACD shows a bullish crossover. Bitshares will now enter accumulation phase (look on binance you will see it was stop hunted a few weeks back, usually what bulls do before wanting to pump something (check STRATIS).
Targets are red lines. Can sell a portion at each line.

BTS bearish a bitLooks like we could be in a bearish pennant, but we will have to wait for the chart to mature a bit more.
We are also follow BTC pattern so if BTC drops we will too. If BTS drops it could go to the next support around 1200 sats.
Lets just wait to see what happens first.

BTS to the upsideHello, the descending triangle looks like its about to end and head to the upside. Most of the day has been testing out the support line which is holding for now. If the support breaks maybe we will get lucky and get a single busted descending triangle.

Bitshare Last Wave 5 in progressSo as we can see there is big chance for 12-15% if you open entry between now and 0.048
#playsafewithrado and with #stoploss

BTS looks upBTS is showing an ascending tiangle, but lets see what happens.
Long just for today, but I'm still bearish overall.


$BTS - 1D - LONG - OPEN TRADE- Price has broken above 3 Day OB and consolidation above previous resistance is underway.
- Wanting to see 3 Day OB now act as support and hold price up.
- Wanting any fall into orange zone to be absorbed
- Targeting clear resistance at 1450 sats, may wick higher. closing all of trade in this zone.
-liking the rounded bottom and large wick on the 18th of december clearing long term stops.
- Closing on the daily below 1150 sats invalidates idea and stop is placed below, hoping not to get wicked out on any downward pressure.

EOSUSD: Buy on dips...or buy into strength from higher levels$EOSUSD has an interesting chart here, it seems to be one of the highest potential coins together with $ETH and $BTC naturally, as far as technical patterns go. As far as fundamentals go I'll let others more knowledgeable on the tech behind it comment here if they like, I have heard good things coming from people I respect who are involved in this field.
I'm not in any position here, but would watch carefully for an entry, if buying with cash. I wouldn't sell any $ETH or $BTC for it, personally.
Cheers,
Ivan Labrie.

Rounded Bottom for Bitshares !!Bitshares looking good right now !! Beautiful rounded bottom suggesting breakout with reverse simmetry !

Daily Bullish Signal $BTS #BTS (18 Feb 2019)RED ARROW indicates the EXPECTED Time and Targets
Level Stoploss point up to maximize profit and reduce risk
I'm working all the time, even in Bearish Market
