BTC — Bullish Gartley Harmonic PatternBitcoin is setting up for a Bullish Gartley harmonic pattern, with price approaching the Potential Reversal Zone (PRZ) around $81,382.
After the recent move higher, BTC has been consolidating above the PRZ, and this area is where I'm watching for the Gartley to complete and potentially trigger another move higher.
Trade Setup
Entry: $81,382
Stop Loss: $80,415
TP1: $87,324
TP2: $93,830
TP3: $101,500
The $81,382 level is the key area on this chart. If BTC pulls back into the PRZ and holds, I
Bitshares
SILVER — Bullish Gartley Harmonic PatternSilver is approaching a very interesting Bullish Gartley harmonic pattern, with price moving into the Potential Reversal Zone (PRZ) around $59–$60.
This is the area I'm watching closely.
Trade Setup
Entry: $59.00–$60.00
TP1: $67.556
TP2: $71.00
TP3: $76.8425
TP4: $86.00
The $59–$60 area is the key PRZ. If the Bullish Gartley completes here and we get confirmation from price action, I believe this could be a very important area for Silver.
What makes this setup especially interesting is the
BROS — Bullish Gartley Harmonic PatternBROS is approaching a major Potential Reversal Zone (PRZ) where the Bullish Gartley pattern is completing.
The chart currently looks ugly. Price has been falling hard, and at first glance this can look like a falling knife. But this is exactly the type of setup I like to watch when a harmonic pattern is completing at a major PRZ.
Trade Setup
Entry: $34–$36
Stop Loss: $26.00
TP1: $56.00
TP2: $70.00
TP3: $88.00
The $34–$36 area is the key PRZ. This is where the Gartley is expected to complete
MSTR: Bullish Gartley With Massive Upside PotentialMSTR has formed a bullish Gartley pattern on the weekly chart, competing around the Potential Reversal Zone.
More importantly, the dashed green trigger has already been triggered, giving the bullish setup confirmation.
Trade Setup
Entry Zone: $110–$120
Stop Loss: $75
Take Profit Targets:
TP1: $305
TP2: $410
TP3: $600
TP4: $900
The Bigger Picture
What stands out here is the potential size of the move.
If MSTR holds the reversal zone and continues higher, the move toward $305 and $410 woul
SUNB — Bullish Gartley SetupSUNB is coming into an area where a Bullish Gartley pattern could give us a nice reversal setup. After the recent selloff, price is now sitting inside the potential reversal zone.
I’m watching two levels closely before considering the setup confirmed.
Confirmation
The yellow trend line is the first one to watch. Price has been respecting this downward trend, so breaking above it would be an early sign that the sellers are losing control.
The second level is the red dotted line at $67.26. Get
ETC: Is This Gartley Setting Up a Reversal?Ethereum Classic is sitting in an interesting spot. We have a bullish Gartley pattern developing near the $7 area, and at the same time, RSI is showing bullish divergence — price is making lower lows while momentum is starting to improve.
But there’s one level I’m watching very closely: the yellow trendline.
That trendline has been acting as a major barrier on the way down. A clean break and hold above the yellow trendline would give this setup much stronger confirmation that the trend may fin
Silver's Bullish Gartley: Reversal Loading?Silver has entered a key Potential Reversal Zone (PRZ) as a Bullish Gartley pattern nears completion. This harmonic setup suggests selling pressure may be fading, creating conditions for a potential trend reversal.
If buyers step in and defend this support area, silver could begin a strong recovery toward higher resistance levels. With a favorable risk-to-reward profile and clearly defined invalidation levels, this is a technical setup worth watching closely.
A confirmed bounce from the PRZ co
BULLISH GARTLEY SETUP DEVELOPING ON DASH/USDDash is on the verge of completing a bullish Gartley pattern on the daily chart.
To keep it simple, this could mark the beginning of the strongest bullish move Dash has seen in years.
Do what you want with this information. I'm simply sharing what I believe is a high-probability setup.
Blue pill or red pill—the choice is yours.
/CL: Bearish Deep Gartley and Bearish Shooting Star Confirmed/CL seems to be furthering it's RSI Bearish Divergence as the price-action prints a Hanging Man followed by a Bearish Shooting Star, confirming an .886 entry for a newly developed Bearish Deep Gartley. This can serve as a good secondary entry against Oil, Market Volatility, and the DXY which may likely lead to a bounce in SPX, BTC, ETH, and perhaps Silver as detailed here:
I will be careful with gold and silver and SPX as those aren't exactly fixed assets not even Gold and Silver. The producti
BTCUSD: Bullish Gartley Support Confirmed Targeting $155,627.72This is a follow-up to the previous bullish entry idea from 2 months ago at the bottom of the channel.
Over the last several weeks BTC has been putting in a bottom at the bottom of this channel both in terms of putting in a Double Bottom on the weekly timeframe and confirming a Bullish Inverted Hammer on last month's Monthly Close; in this time BTC has been taking back the 200-week moving average and given that BTC rarely stays below the 200-week Moving Average for long it is statistically li
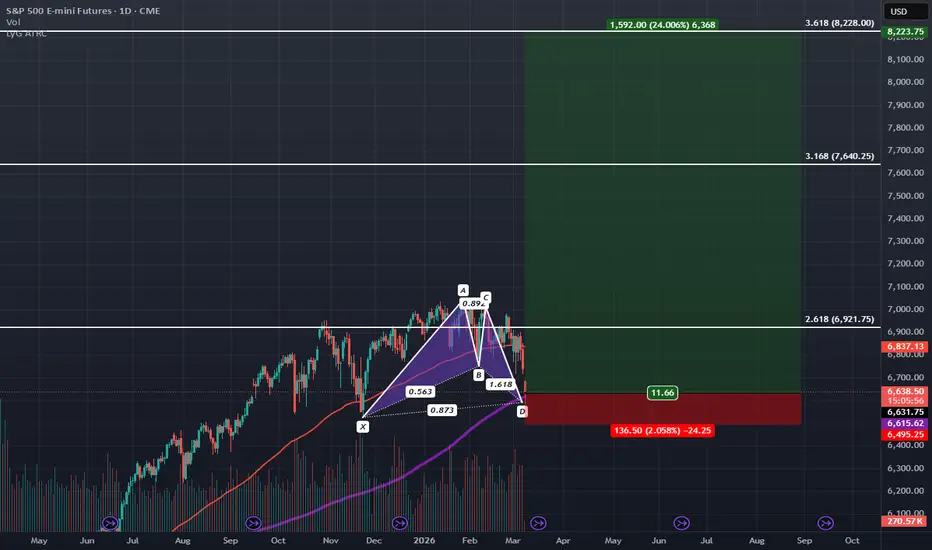
S&P-500 Futures Bullish Gartley Entry at 200-day SMAThe Nasdaq-100 Futures have been holding up in the range printing potential Bullish Cup with Handle Pattern but the SPX Futures have come down to nearly a 0.886 retrace, completing a Bullish Gartley aligning with the 200-day SMA.
Oil has recently spiked above $110 which was likely the trigger for the SPX's decline, but at this point is likely to come crashing back down below $100 if not just for a week or so.
During this time we can likely see the SPX stage a recovery from this recent declin
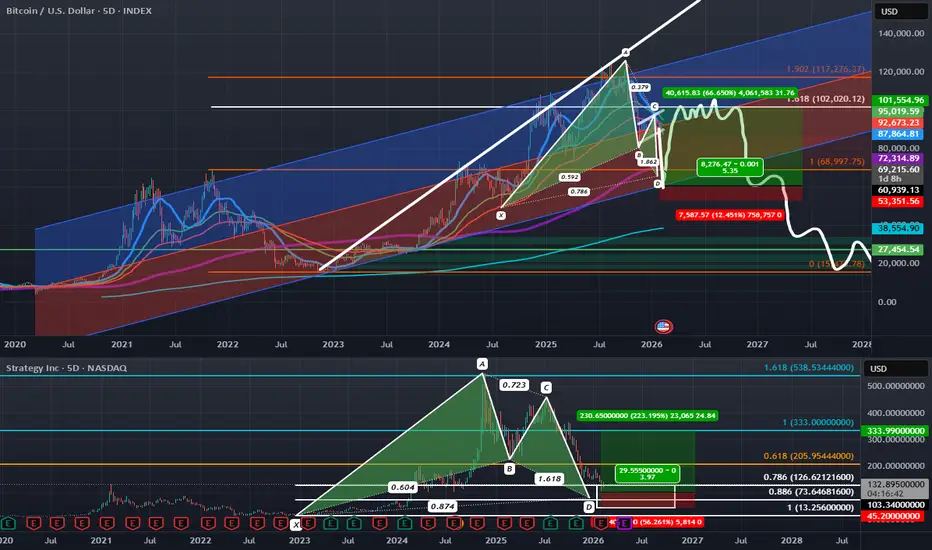
Taking Profit on BTC Shorts; Looking to Get Tiny Long ExposureOriginally Posted: 02/05/2026
Reposted For Compliance: 02/13/2026
BTC and MSTR are at potential PCZs of Bullish Gartley; The two assets moved down leading to MSTR earnings and negative unrealized losses expectations. I do think that BTC will ultimately move back down, but from where it is now, looking at all of the downside short leverage that has been building at these lower levels, I think there is a high chance of it short squeezing to the upside and for it to be fast and violent move up to
Bullish 2021 Bitcoin Fractal Suggests Bitcoin has BottomedBitcoin is sitting at the PCZ of a what can be plotted as both a Bullish Cypher and a Bullish gartley and on the 5D timeframe it is below the 200 Period SMA which it usually doesn't stay below for long; and is also sitting a the 1.618 Standard Deviation demand line of a Linear regression Channel while exhibiting Bullish Divergence on the MACD and starting to show a second recovery from oversold zones in the RSI after what was a sharp secondary decline into oversold zones and lastly on the price
ETHUSD: Bullish Gartley with Bullish Divergence 10.3HR TimeframeETH Thus far has held up well at the Bullish Butterfly PCZ that I mentioned in the last idea I posted on ETH here: since then, I'v realized that this Butterfly PCZ aligns with the 0.886 retrace from the macro low to high and at these levels the price action has closely followed the initial projection marked in the gray with having an initial bounce followed by a secondary retrace back down to the lows. If this projection is to continue to playout we should expect to see ETH break free from this
The Gartley at play? EUR/USD making a move...I have been building short positions since end of June/early July based on my original trade idea (which is still open)
....However, I noticed a potential harmonic pattern on the weekly about 3 weeks ago and this strengthened my conviction to keep and add additional shorts when we consolidated around the 1.1800+ price zone.
Although I am a chart pattern trader, I'm not a traditional harmonic trader but certain price action stands out to me and this looks like one playing out.
If this does qu
#ZECUSDT - Another leg up is aheadWe all saw a massive bullish in zec in previous days out of 260% instant bullish... and now it's in consolidation
it shows a symmetrical triangle pattern in hourly chart with 2 attempts of breakout ... third one must be work
the next station at ( 250 - 280$)
best Regards:
Ceciliones🎯
BellRing Brands (BRBR) Weekly Gartley@ Key Levels + Kijun SignalIn March 2025, I previously took a look at this budding public company BellRing Brands, Inc. for a long-term investment horizon. It was priced around 74 at the time, then the fall of the overall market status put additional pressure on its stock, although the company itself is booming and meets my fundamental parameters. See the following:
Since then, we had an awesome and confident forward guidance from the company in the last earnings call in May 2025: bellring.com
Now, looking at BellRin
Two reasons to sell FTSE Right NOWWe are seeing some reasons to sell FTSE right now.
1) The daily trend is down.
2) H4 is pointing down, but the price is above the MA
3) There are two patterns to sell at the current level
4) 8165 is the last weeks high that will be a good resistance
Hoping for a test of last week's lows.
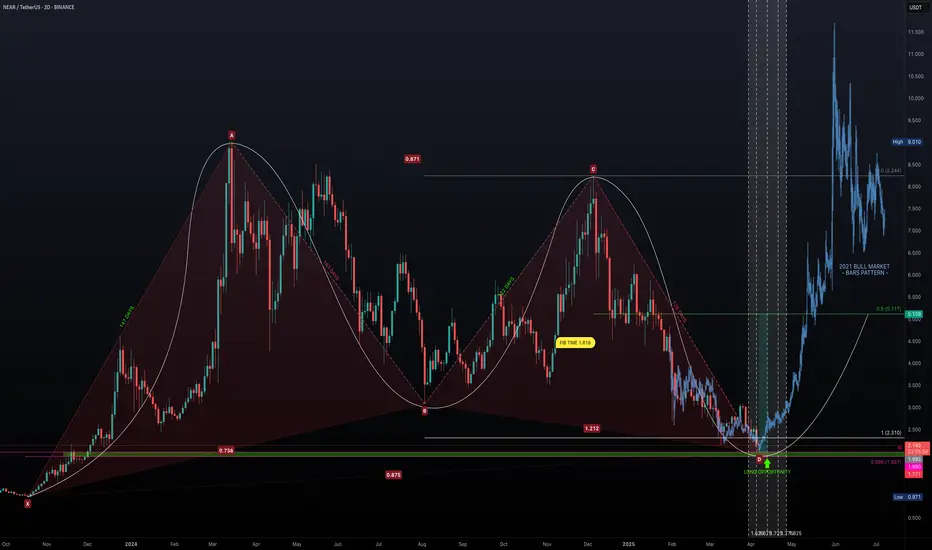
NEAR the Bottom? - The Crash Ends HereBack in October 2023, NEAR embarked on an incredible bull run lasting 147 days, surging from a low of $0.971 to a high of $9.01—an astounding +828% gain. Following this euphoric phase, the market sentiment shifted dramatically. Over the subsequent 392 days, NEAR retraced to around $2, marking a -78% decline. Now, with the market at a critical juncture, the question remains: when does the madness of the crash end, and can we finally see a reversal?
Harmonic Patterns & Fibonacci Confluence
Ch
BTC Bearish GarleySummary of Confluences
Trade Setup Long Trade (Buy at C)
Key Confluences
✅ Fibonacci 0.618 - 0.633 Retracement (XA Leg)
✅ Weekly FVG Support
✅ Market Structure Pivot & Liquidity Grab
Short Trade (Sell at D)
✅ Bearish Gartley Completion (1.27 - 1.3 Fib Extension of BC)
✅ Anchored VWAP from ATH (Resistance)
✅ Bearish Order Block & Supply Zone
1. Long Trade Setup (From C to D – Bullish Move within the Gartley)
🔹 Trade Type: Counter-trend long (buy from C to D).
📌 Entry Criteria:
Buy
XRP - Bearish Gartley Pattern (Long & Short Positions)Confirmation:
Market Structure: The chart highlights a first weekly lower high and first weekly lower low, reinforcing a bearish trend.
Daily Fair Value Gap (FVG): Could serve as an additional target for the price.
Risk-to-Reward Ratio (RRR): The trade appears to have a favourable RRR, with an optimal entry around D.
1. Long Position (Counter-Trend Trade from C to D)
Trade Setup:
Entry: At point C, around the 0.882 Fibonacci retracement level.
Stop Loss: Below point A, ensuring protec