Bitcoin Levels OffAs predicted, bitcoin rejected $19.5K, and is tending back to $19.0K. We are roughly in the midpoint of this range at the time of this writing. Low liquidity and low volume are likely to remain an issue standing in the way of BTC and higher prices. If we are able to break out then we will surely face resistance at $20K. Although $19.0K should provide support, $18.6K is the next level down and is a likely floor for now.
Blockchain

Bitcoin: The Bottom Already Happened When we first took a look at Bitcoin's price action from a long-term view a few weeks ago, we assumed it was due for another major leg down to the $16-17k level or even lower to the $11-12k zone.
This is a sentiment that has been echoed by numerous VC firms, hedge funds, and even investment banks (Goldman Sachs).
However, after taking a second look at the large time frame charts for Bitcoin, it appears there's considerable reason for us to revise our initial estimate of what we consider to be the 'bottom' for Bitcoin.
We're going to move forward here by shifting the time frame of our chart to the 1-week / 2-week resolution (we'll get to the monthly resolution in due time).
Tracking Bitcoin's Total Decline from Top to Bottom, Percentage-Wise
From the most recent ATH ($68,995) to the lowest point of this current bear market we're in ($17,585), the price declined by approximately -74.51%.
That 'bottom' occurred in June 2022. The likely catalyst for this price decline was the $UST / $LUNA debacle involving Terra Finance that occurred earlier this year.
Let's compare this total decline with what we saw from the top of the 2017 bull market to its eventual bottom a little over a year later (13 months) in December 2018.
As we can see above, the total price decline during that bear market was approx. 83-84% from the prior ATH set in December 2017.
From here, we're going to pan back even further to the peak (ATH) Bitcoin hit in November 2013 to its eventual bottom in January 2015 (13-14 months later).
Many have looked at the ensuing price action following the prior two bull runs and have assumed that this cycle is merely an analog.
However, if we take a closer look at some of our momentum indicators and compare the readings they're giving us at this present moment to what they gave at the bottom of the previous two bear markets, it appears that the market may have already reached its bottom.
Librehash RSI(14) on the 2-Week Resolution
For this indicator, we're going to take a look at the Librehash RSI(14) on the 2-week resolution.
First, we're going to see what the RSI(14) read at the respective bear market bottoms following the 2013 and 2017 bull runs.
Above, we can see the RSI(14) provided a reading of 34.24 back in January 2015.
The indicator read 36.54 back in December 2018 (bottom following the December 2017 bull run).
The only other time that the RSI(14) has yielded a reading that low on the 2-week resolution was back in June 2022.
Perhaps without coincidence, this marks the localized low for Bitcoin for this bear cycle.
Assuming that the trajectory of the RSI(14) remains, then we've already seen the 'bottom' for this cycle (but don't get too excited just yet because this is only true if the RSI remains on its trajectory).
Librehash Volatility RSI on the 2-Week Resolution
Taking a look at the Volatility RSI on the 2-week resolution, we can witness a similar phenomenon between the indicator's readings and the 'bottoms' that were formed following the 2013 and 2017 bull markets.
Check out the indicator's readings below at the bottom of the post-2013 bear market (circa. January 2015):
Now let's see the indicator's readings at the bottom of the post-2017 bull market (circa. December 2018):
Taking a look at the previous two charts, we can see that the indicator turns blue and pivots upward following these 'bottoming' points.
Now let's see where the most recent 'bottoming' point is for this indicator in this current bear market cycle we're in:
To put these bottoms in perspective, let's take a look at this indicator on the 2-week resolution from a 'panned out' view so that we can compare the location of each 'bottom' point we identified for this indicator on the 2-week resolution.
As we can see, the reading provided by this indicator on July 2022, closely matches what it gave us for the bear market bottoms that occurred in December 2018 and January 2015.
To be specific, below are the specific numeric readings for this indicator during those times:
1. January/February 2015 = 35.84
2. December 2018 = 35.85
3. July 2022 = 35.66
As we can see, these points are only separated by a few decimals, maximum (0.19 value points).
Librehash Trending MA
Not going to spend too much time going into the calculations behind this indicator beacuse there were numerous adjustments that had to be made to its original iteration after receiving some valuable feedback from a subscriber.
The important thing to note is that this indicator is primed to signal exits & entries on the basis of overall trend. In other words, its meant to be resistant to intermediate whipsaws in the price action that can yield 'false' buy / sell signals from indicators that are too sensitive in their tuning.
Thus, this indicator is not designed to 'signal' very often. And when it does signal, its mean to capture the localized 'bottom' and 'top' of a specific region of price action.
This indicator is designed to be overlaid on the price chart. So let's see what its showing us on the 2-week resolution below:
This, itself, is not an indicator that the price has bottomed out, but it does lend itself as a strong arguing point that we're far away from seeing any major drop in price or significant takeover by bears in the near future (remember we're still on the 2-week resolution here).
Librehash Double Guppy Channels on the 2-Week Resolution
This is yet another custom indicator we're using as a lens to examine Bitcoin's price action on the 2-week resolution.
The LH double guppy creates a range-bounded channel that envelops the price action (i.e., indicator is coded so that the price never falls below or above the channel). Typically, when the price price action is at the bottom of the channel, we're due for a bounce. When the price is at the top of the channel, we're due for a drop (to understand the reasons why, visit the indicator page where there's a comprehensive explanation of how the indicator works).
Let's take a look at what the indicator is showing us below on the 2-week resolution:
As we can see the price has been bumping against the bottom of the double guppy channels for the past few weeks (dating back to April 2022).
Again, this is not an indicator that the price is at a bottom but it doesn't portend any substantial bearish price action in the near future (remember terms like 'near future' are relative to the time frame we're using here, which is the 2-week resolution in this case; at this time frame, 'near future' should be extrapolated to refer to the next 5-10 periods at least, which would give us a 10-20 week time frame).
Identifying the 'Flat Base' Chart Formation
The 'flat base' is a chart formation discovered by legendary Thomas Bulkowski and documented in his famous technical indicator reference guide titled, 'Encyclopedia of Chart Patterns Second Edition'.
Its important that we take the time to identify this chart formation because many traders in the public analyzing Bitcoin's price have falsely claimed that its current price action reflects an evolving 'descending triangle' formation like what we saw during the previous bear market (following the 2017 bull run).
What's important to note is that this chart formation is typically characterized by:
1. A 'high' formed by the price action, which marks the 'opening' of the chart formation itself. This 'high' is typically a 'bounce' off of the underlying horizontal support.
2. That horizontal support we mentioned in #1 remains consistent throughout the duration of the pattern.
3. The overall volatility of the asset's price action decreases as the progresses (from the 'open' to the 'apex' of the triangle).
There is no such pattern present or emerging on Bitcoin in any time frame . Period. Doesn't matter whether you look at Bitcoin through a logarithmic or 'regular' view.
Exploring the 'Flat Base' Pattern
This is a chart pattern we've never covered before because we've never seen Bitcoin (or any other crypto) exhibit such price action.
But now that we are observing this chart formation (clearly, at that), its time for us to get a crash course on what the 'flat base' pattern is, how to recognize it, how to identify it within Bitcoin's recent price action and how that impacts our price forecasts moving forward.
Thomas Bulkowski noted that he observed this pattern at the end of the 2008 bear market (traditional finance). More critically, he notes that he struggled to identify this chart pattern at first due to his chart settings.
Specifically, Bulkowski stated, " The real reason I did not find any is because I was using the logarithmic scale on my charts and not the linear or arithmetic scale. Switching to a linear scale when searching for flat bases made all the difference ."
Now let's take a look at what the Bitcoin price chart looks like when we have our charts set to a 'logarithmic' view (which its usually always on by default):
Now let's see what it looks like on the regular, non-adjusted view:
As we can see above, Bitcoin's most recent price action strongly mirrors a typical 'flat base' chart formation.
This pattern is also commonly referred to as a 'rectangle bottom', which is created when the price enters a traded range (heavy consolidation) for a significant period following heavy bearish price action.
In most cases, this pattern is considered to be a bullish reversal where price action is expected to breakout above the overhead horizontal support formed by the traded range during a bullish breakout (which should be accompanied with sufficient volume).
Conclusion
This price analysis is going to go on a limb and conclude that we've already seen the bottom for Bitcoin (back in June 2022), and that we should only be seeing perpetual / gradual increases in the price action from here.
Given the readings on all of our technical indicators (on various time frames), it doesn't seem unreasonable for someone to take a long position here (with a heavy S/L that must be adhered to).
Below is our R/R for the time being (be warned that we're still in a phase of heavy consolidation & low volatility, so the choice to enter into any position at this point may result in one having to wait several more weeks before reaping the potential ROI from this position).
You read that R/R right. We set a target for Bitcoin at $32k with a S/L at the current bottom for this bear market at $17.5k.
That gives us a reward that's about 7x our risk and a total risk of less than 10%, with a potential reward of >65%. Assuming the price gets there, this would just be a starting mark for us.
This price analysis makes such an ambitious forecast because there's nothing on any time frame that's indicating Bitcoin's price is in jeopardy of being seized by bears anytime soon.
Let's revisit this price analysis in the near future and see if our forecast ends up being correct.

Bitcoin Looking Bullish Near-Term In this analysis, we're going to do two things:
Take a look at Bitcoin's short-term trajectory (forecast the price action for the next few days / weeks)
Take a look at Bitcoin's long-term trajectory moving forward
The second part is going to be more important than the first one because we're going to revisit our assumptions that Bitcoin is due for another leg down. The reason for doing so is because there's a possibility that we may have already hit the bottom (nothing confirmed yet but read along to see the rationale for saying that).
As anyone observing the price of Bitcoin has noticed, the price has been trading sideways for the past few weeks.
Below is a quick look at Bitcoin on the H12 resolution:
As we can see above, Bitcoin's consolidation has created a traded range with an upper resistance at $20.3k and lower support at $18.6k (approx). From top to bottom, the total upside is about 8.6%, which hardly counts as volatility when it comes to Bitcoin.
Many traders on Twitter and elsewhere have been calling for Bitcoin to fall below the sturdy horizontal support resting at the $18.6k level. To gauge whether this is true or not, we're going to take a look at some of our momentum indicators to get a better idea.
Balance of Power RSI
We're going to start with the Balance of Power RSI, which is a custom indicator designed to track accumulation (buying) vs. distribution (selling).
Even though the Balance of Power RSI is designed to significantly smooth the normal Balance of Power signal (which is all over the place), its still somewhat hard to gauge whether there is definitive accumulation vs. distribution for Bitcoin here.
If we look closer, we'll see there's definitively been a noticeable positive trajectory in the indicator dating back to October 10th, 2022.
We'd be better served if we could plot a 'line of best fit' here for the Balance of Power RSI, but what we can glean from the 'eyeball test' should be sufficient to say that the indicator is telling us there's an increasing amount of underlying accumulation.
Librehash RSI(14)
The RSI(14) is designed to be read like any normal RSI. The difference here is that the RSI line changes colors based on the EMA of the rate of change (actual formula is a little more complex than this, check the actual indicator page for more details).
Main point here is that when the indicator flashes green, that means that the RSI(14) is signaling bullish momentum, red means bearish, of course.
Let's see what its showing us below:
From the chart below, we can see that while the RSI has been fairly choppy over the past several weeks, its overall trending trajectory has been pretty consistent (positive).
Librehash Volatility RSI
The 'Volatility RSI' is another custom indicator (this one publicly available for free).
The purpose of this indicator is to essentially track the volatility and the price direction all at once. As the line itself moves upward, so does the overall volatility. When the line flashes 'red' that means that the volatility is decreasing and when it flashes 'blue' its increasing (yes, that means that the overall volatility can be increasing while the price action within that time frame signals heavy consolidation).
Let's take a look at the indicator below:
As of right now, it appears that the Volatility RSI has retained a positive trajectory for some time.
Librehash Reversion Ribbon
Moving forward, we're going to take a look at the Librehash Reversion Ribbon on the daily resolution (remember we were on the H12 resolution before, so we zoomed out 2x here).
This indicator is another custom one, but to simplify, you can analyze this indicator the same way you would the MACD.
Let's take a look at what its showing us below:
Its important to note that when it comes to the Librehash Reversion Ribbon V2, there are multiple different readings we must glean from what its display in order to gain a better idea of what's going on.
Those factors are:
1. Where the ribbon is in relation to the histogram (zero line)
2. The coloring of the candles
3. Convergence or Divergence
One of the most notable observations that we can make here is the fact that the ribbon itself has traveled upward from where it 'bottomed out' at the end of August 2022.
Hopefully the photo above makes the ribbon's trajectory clear. If not, then the observation here is that the ribbon has moved vertically (upward) toward the histogram.
This is worth noting because, like the MACD, when the indicator's signal traverses below the histogram, that means that it is signaling the price action is in a bearish trend. Conversely, when the price action traverses above the histogram, the indicator is signaling that the price action is in a bullish trend.
As of right now, the ribbon is on the threshold of crossing above the histogram.
What This All Means in the Short-Term
All of the indicators we're reading are bullish, overall. That doesn't mean that the price is due to spike. It just means that all of the indicators are currently yielding bullish readings.
However, it doesn't appear that this has been reflected in the price action since Bitcoin's price has remained pretty ambivalent over the past few weeks.
If we revisit the price action again, we'll see that the price has been trapped in a traded range where the overhead horizontal resistance only stands 7-8% above the underlying horizontal support.
Thus, it goes without saying that one can enter into a long position from here but if you do, you might be waiting a while before the trade begins to bear fruit (however long it takes for Bitcoin's price to exit this lengthy period of consolidation that its been in).

Litecoin to $55?Litecoin broke out of the narrow range it had been holding for a few days, between $50.64 and $51.92. This narrow range suggested that a breakout was near and sure enough we were able to break out into the range above. We mentioned that $55.84 was an ambitious target and sure enough, we appear to be meeting resistance in the low $54's. Volume has been extremely thin with Litecoin for the past month, and we will need proper momentum to sustain the rally. If so, $55.84 is a target, but we are likely to face strong resistance here. In the more likely event that we retrace, then those levels mentioned in the low $50's should continue to provide support.

Ethereum Gets A LiftEthereum broke out with the rest of the crypto market. Momentum has been surprisingly strong for Ethereum, and it's surpassed Bitcoin in the relative strength of this rally. We anticipated $1341 to provide resistance as it has been the upper bound of this range for over two weeks. We were able to test $1368, which we have added as a new technical level, before momentum petered out. Currently, we are finding support at $1341, and are likely to retrace to $1288, but if momentum can somehow pick up then $1368 is the next target then $1424.

Brief Rally in Bitcoin Faces ResistanceBitcoin has gained strength off the unexpected rally in stocks, testing $19.5K. As predicted many times here, Bitcoin met swift resistance at this level, and could not continue the rally to $20K. We are seeing a nice pull back here, and are likely to return to $19.0K, with $18.6K a likely lower bound, and $17.6K a floor price for now. If we are somehow able to make an attempt at $20K, this level will surely provide resistance.

#btcstarburst Opportunities?This could be a big opportunity… The risk is on the table? PIVOT point everyone is waiting for? dCA safely GANN study Support and resistance… zoom out.. Follow up!!

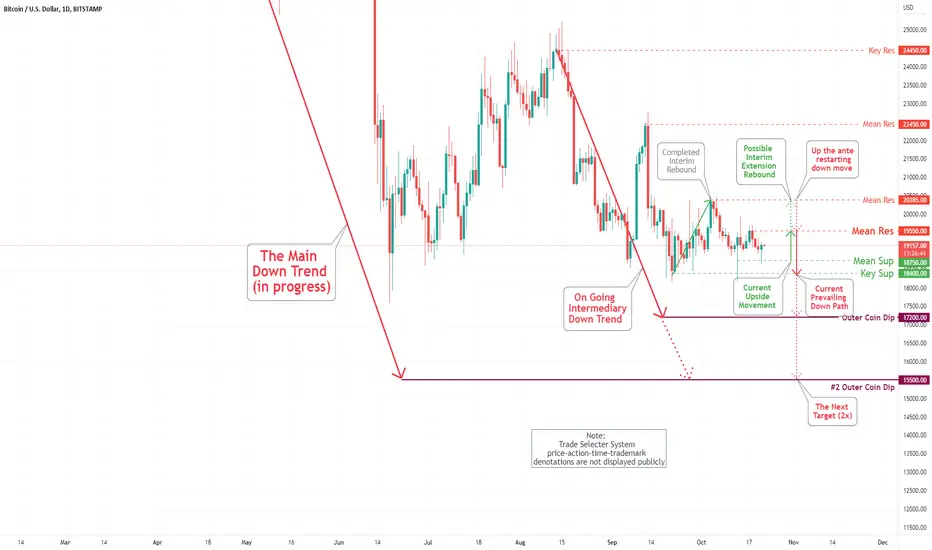
Bitcoin (BTC/USD) Daily Chart Analysis For Week of Oct 21, 2022Technical Analysis and Outlook:
The Bitcoin is churning between our Mean Res $19,550 and Mean Sup $18,750. As specified on the Bitcoin (BTC/USD) Daily Chart Analysis For October 14, the possibility of moving to the Outer Coin Dip of $17,200 and extending the overall outcome to the #2 Outer Coin Dip at $15,500 is in the process. Reaching out in the short-term to the Mean Res $19,550 and possibly Mean Res $20,385 is blowing hot and cold.
October 22 BTCUSD BingX Chart Analysis and Today's HeadlineBingX’s Bitcoin Chart
The benchmark 10-year Treasury bond yield rose to about 4.23% Thursday afternoon, the highest level since June 2008. Bitcoin is up 0.49% over the last 24 hours and rose to an intraday high of $19,250. U.S. stocks surged after the Wall Street Journal reported that the U.S. Federal Reserve will likely debate on a smaller interest rate hike in December. However, the largest cryptocurrency still trades in a tight range on Friday. For now, the sideway trading activities are likely to continue as there is not much volatility in the market.
Today’s Cryptocurrency Headline
Fidelity Digital Assets Plans to Hire 100 More Employees in Next Six Months
Fidelity Digital Assets division plans to add an additional 100 new employees over the next six months, said Chris Tyrer, head of Fidelity Digital Assets Europe and head of Fidelity Digital Asset Management. This will bring its workforce to around 600 people. The new hires will all be within Fidelity Digital Assets and will be across multiple regions and functions including technology, business development, client services, marketing and compliance.
Disclaimer: BingX does not endorse and is not responsible for or liable for any content, accuracy, quality, advertising, products, or other materials on this page. Readers should do their own research before taking any actions related to the company. BingX is not responsible, directly or indirectly, for any damage or loss caused or alleged to be caused by or in connection with the use of or reliance on any content, goods, or services mentioned in the article.

October 21 BTCUSD BingX Chart Analysis and Today's HeadlineBingX’s Bitcoin Chart
According to IntoTheBlock, Bitcoin’s 30-day price volatility was at 31%, the lowest in almost two years. Bitcoin is up 0.27% over the last 24 hours and rose to an intraday high of $19,348.46. The largest cryptocurrency continues to trade around the $19,000 price level, suggesting a lack of demand for both sides. For now, the sideway trading activities are likely to continue as there is not much volatility in the market.
Today’s Cryptocurrency Headline
OpenSea Rolls Out New Analytics Tab
According to OpenSea's official Twitter, the NFT market OpenSea has launched a new analytics tab on most collection pages. Most collections now include an analytics tab where users can browse trends, metrics, and collection activity. The analytics tab also includes three core metrics of volume, sales, and floor price, to help users make informed decisions. The feature is currently in the beta version and will be updated based on users' feedback.
Disclaimer: BingX does not endorse and is not responsible for or liable for any content, accuracy, quality, advertising, products, or other materials on this page. Readers should do their own research before taking any actions related to the company. BingX is not responsible, directly or indirectly, for any damage or loss caused or alleged to be caused by or in connection with the use of or reliance on any content, goods, or services mentioned in the article.

Litecoin Barely Holds the $50'sLitecoin is forming a very narrow range, as dedicated readers will remember. For the new readers, recall that we have strong levels at $50.64 and $51.92, between which LTC is ranging right now. If we are able to break out, then $55.84 is the next target but this will require significant momentum so don't get your hopes up. In reality it is likely we will continue the range with $50.64 a floor price for now.

Ethereum RangingEthereum is tending toward the lows of the range at $1288. We anticipated this, and frankly, it's getting a little boring. If we are able to pivot, then $1341 will provide resistance and should be considered a ceiling. If we can break through current levels, $1235 is most assuredly a floor, so range trading is the best strategy for now as it has been for the past month or so. Congrats to those who have banked off of these reports (thanks for your messages).

Bitcoin Holds the Range 🥱🥱Bitcoin as wavered and tapered down against the hopes of many perma-bulls. We are still caught in the range between $19.0K and $19.5K. Dedicated readers should be tiring of these numbers but should be banking off of the mean reversion trades we have seen come to fruition, right here in these reports, for the past month. Again, it is unlikely we will see any miraculous burst of momentum, but if we do, $20K is a hard ceiling for now. As a floor, $18.6K should provide further support.

BTC - Support & Resistance Zones!Hello TradingView Family / Fellow Traders. This is Richard, as known as theSignalyst.
BTC has been stuck in a range between 18k and 20k for a couple of days.
Bullish Scenario:
For the bulls to take over, and start the minor / short-term correction upward, we need a momentum candle close above the orange zone.
And then, for the bulls to remain in control, we need a break above the upper red trendline (20,500)
Bearish Scenario:
For the bears to remain in control short-term, we need a break below the gray zone.
And then, for the the bears to kick in long-term, we need a break below the 18k zone in green.
Which scenario do you think is more probable and why?
Always follow your trading plan regarding entry, risk management, and trade management.
Good luck!
All Strategies Are Good; If Managed Properly!
~Rich

Litecoin Hugs the Low $50'sLitecoin has found support at the base of the $50 handle at our level at $50.64. However we are running into immediate resistance from the next level above at $51.92. This is a very narrow range for Litecoin, which had been oscillating between these lower levels and $55.84. If we are able to break out from $51.92 then $55.84 is the next target, and based on the markets right now, we don't expect that any time soon.

Ethereum Flirts with $1300Ethereum has found support at the bottom of the range, at our newest level at $1288. Recall that this is the exact move we predicted yesterday, when we had rejected $1341. We are seeing good support at current levels confirmed by green triangles on the KRI. If we cannot hold this level, however, then the next level of support is at $1235. We anticipate $1341 to hold as an upper bound.

Bitcoin RangesBitcoin has continued to meander in the range exactly as we have anticipated yesterday. Recall that we said we should have resistance at $19.5K, and support at $19.0K, with a floor of $18.6K for now. This is exactly what we are seeing currently and the outlook remains unchanged. If we do catch a bid and are able to break through $19.5K, then $20K will surely provide resistance. The Kovach OBV is showing weakness, so don't expect any miracles any time soon.

October 20 BTCUSD BingX Chart Analysis and Today's HeadlineBingX’s Bitcoin Chart
The annual inflation rate in the Eurozone rose to 10.9 per cent in September, a jump from 10.1 per cent in the previous month. Meanwhile, UK inflation hit 10.1 per cent in September, a 40-year high. Bitcoin is down 1.23% over the last 24 hours and fell to an intraday low of $18,900. The largest cryptocurrency continues to trade sideways between the $18,000 and $20,000 price zone for the past week, suggesting no big movements in either direction have taken place. The gradually downsloping 20-day exponential moving average ($1,320) and the relative strength index in the negative territory indicate that bears are at a marginal advantage. For now, the sideway trading activities are likely to continue as there is not much volatility in the market.
Today’s Cryptocurrency Headline
Rio de Janeiro to Allow Digital Asset Tax Payments
Rio de Janeiro will allow its residents to pay property taxes in digital assets starting in 2023, a decree published this week has revealed. The city’s mayor, Eduardo Pae, has now published a decree calling for applications from virtual asset service providers who wish to process digital asset payments starting in 2023. While the residents will use digital assets for payments, the city government will only charge fiat currencies, and converting digital assets will not incur any additional cost to the taxpayers.
Disclaimer: BingX does not endorse and is not responsible for or liable for any content, accuracy, quality, advertising, products, or other materials on this page. Readers should do their own research before taking any actions related to the company. BingX is not responsible, directly or indirectly, for any damage or loss caused or alleged to be caused by or in connection with the use of or reliance on any content, goods, or services mentioned in the article.

Litecoin Holding the $50'sLitecoin has been able to hold the $50's, but is facing resistance at $51.92, as predicted yesterday. We were able to find support just above $50.64, holding the $50 handle. However, a lack of momentum prevented any follow through past $51.92. If we are able to break through this level then we will surely meet resistance at $55.84 but it is not likely that will happen any time soon. We anticipate $50.64 to hold as a lower bound, but if not the next level of support is at $45.48.

Bitcoin Holds a Narrow RangeAs predicted yesterday, Bitcoin had prohibitive resistance at $19.5K, and was not able to even test the $20K's. There are numerous red triangles on the KRI suggesting that every attempt to do so was thwarted. We are currently testing $19.0K, the next level down, which we anticipated yesterday as well. So far it looks like this level is holding and if so, expect Bitcoin to drift between $19.0K and $19.5K, which is a very narrow range. Almost a $Billion worth of Bitcoin was taken off one exchange, which will result in a lack of liquidity and supports our idea of a slow drift until more signficant momentum can come through. We expect $18.6K to hold as a floor for now, with $20K as a ceiling.

Daily Review: #BITCOIN#BTC prince slips down to the support/previous range build. Acceptance below 19161 will trigger new dump. towards 18800. In other case, acceptance abpve 19532 will possibly lead to a breakout higher which could give bulls a chance to flip the table towards 21k as this week's $510m BTC options expires on friday.

October 19 BTCUSD BingX Chart Analysis and Today's HeadlineBingX’s Bitcoin Chart
Bitcoin is down 1.81% over the last 24 hours and fell to an intraday low of $19,091.97. The largest cryptocurrency broke below the 20-day exponential moving average ($19,410), suggesting the seller remains active at the higher levels. The RSI is near the midpoint, suggesting a balance between supply and demand. For now, the bulls need to push the price above the 20-day exponential moving average in order to prevent further decline.
Today’s Cryptocurrency Headline
Silvergate Capital Release Q3 Earnings Report
Crypto bank Silvergate Capital released its third-quarter earnings statement Tuesday. The bank reported EPS of $1.28 in its third-quarter earnings presentation, compared with analysts’ consensus estimate of $1.41 via S&P Capital IQ. Silvergate's shares subsequently fell about 20%. Transfers via Silvergate’s real-time settlement network totaled $112.6 billion in the third quarter, which represents a 41% decrease compared with the previous three-month period and a 30% decline from the third quarter of 2021.
Disclaimer: BingX does not endorse and is not responsible for or liable for any content, accuracy, quality, advertising, products, or other materials on this page. Readers should do their own research before taking any actions related to the company. BingX is not responsible, directly or indirectly, for any damage or loss caused or alleged to be caused by or in connection with the use of or reliance on any content, goods, or services mentioned in the article.

Deeper Network DPR Crypto Breakout +27%Deeper Network DPR Crypto is possibly breaking out bullish from a falling Wedge Pattern with a +27% upside to .012cents.
Good & Bad News: "All Genesis nodes will have one rewards halving event on Dec. 1st, 2022. Genesis will continue until Aug. 28th, 2023, then enter into EZ Mining directly." What this means is a Ter8 was getting 90% reward but it will be reduced to 43% for a Genesis. So they are forcing all those people who originally staked in at a Ter7 or Ter8 to unstake there one device on Dec. 21, 2022 and either sell there DPR or to purchase additional miners an start EZMining instead with a 60% reward at a Ter8 level. By Dec 1st the price of DPR could be around .0045 on a low end, which means you may need to purchase 1 or 2 extra miner from Deeper to get a higher reward amount above a Genesis. All those who staked in from a Ter6 Level or lower are getting a great rewards for a little bit longer. (I am not sure if they are changing this again)
News: There will likely be a similar crash to the 1990's Dot Com bubble crash coming very soon, with the Alt Coin Bubble that is going on now. Only the strongest Alt Coins will survive. Will Deeper Network get there act together to maintain there support thru out there community or will they continue to twist there words around forcing there supporters to look to only Bitcoin or Ethereum . So far Deeper Network on its own initiatives, is pushing itself farther away from the top ranking alto coins.
Bearish News: Deeper Network is not a Decentralized Platform but a Centralized Platform, They currently use the Polkadot Blockchain Governance Platform which if working 100% is not technically decentralized as per it's maker Gavin Woods. But Deeper Network has a hidden backdown open to bypass all approvals for programing which would other wise need to be approved by who ever holds the most DPR basically at the end of the day as a Council Member by voting yourself in on the Governance Website Page made by Polkadot . At any point in time the Council Members or Deeper Network with there back door open can take you DPR out of your wallet if they want thru programing codes directly by Deepers DEVs or voting as a Council Member as a Motion. Since Deeper has the most DPR it will be controlled internally in a scenes making it centralized at the end of the day.
Bearish News: Possible Token Crash Starting around September 6, 2022 thru the next 6 months, investors getting Deeper ERC-20 DPR returned to them who bought in at .006cents to .02cents. There was 2Billion token allocated to sell but they only advertise 1Billion being sold. DPR given out already to the investors that crashed the coin the first time (estimated 40% investment returned already), there is an estimated amount of 2 to 4 Million DPR being released each day to their investors for the next 6 months starting in September 2022 thru March 2023. I foresee another massive upset that Deeper Network will hush the investors by kicking people out of there Deeper Network community social groups when people complain and get upset like what happened when they lock up the investors DPR the first time without paying them back as was promised in their smart contract that had a hidden back door in the smart contract to reprogram it and to lock back up again. This is a lack of trust that I don’t think Deeper Network will every out live. This is the finial contract agreement after being changed multiple times with out permission from the investors.
Bearish News: the Seed Investors who bought in at .003cents were told this "Your DPR is locked until tier 1 CEX listing, then unlocked 1 year after tier 1 CEX listing. Linear distribution over 1 year. If DPR is not listed on tier 1 CEX within 2 years of Jan 1, 2023, unlock starts on Jan 1, 2025 then linear distribution over a year. You will definitely get your DPR however, you'll need to wait a little longer for the benefit of the whole. Deeper Network appreciates your understanding and apologizes for any inconvenience this may have caused." This was confirmed by a Volunteer Mod.
-Crypto Whale Information: See the Whale news on my channel for their Wallet address & Location, as you can track for yourself who is a true supporter and who is a dumper…… (AMA said Whales are allowed in the project now)
- Deeper Chain Community Governance - Currently being controlled directly by Deeper Network, not by the Community but thru a back door in the program (Verified on AMA) I don't foresee them giving the governance to the community within the next year or so because they like to be able to have fully control without have to wait for voting approvals, because the programing is far from being perfect..............
- 7 Validator Nodes on Deeper Chain, 7 have been verified to be in control of by Deeper Network DEVs, apparently they can control votes on the Governance with their locked DPR rewards- Wallet Addresses 1st 5C4vNVT5pDroqufEtXKYp3RKrNXVTHk9yqTeNNUSnJ6EbGGY ; 2nd 5CJDFR5RCMxPwVdzgH6JA9D7M625FEFKrdsJG1JnQVQdQkH2 ; 3rd 5HCG6MvAhYgLZdPoD1BVHEjgKee9n4AhMLKfq64VLiM4znuU; 4th 5Fug4ra4oJaCZQzUZ5C5vNaWBHUujKwGgu5NmZtcDwXMtsCp ; 5th 5Fe7kQ2kunvxDzd1f1AFUuLDPnd8uzqrbgQ4Q4zLHNeC82xD ; 6th 5CaViidoJL9qL22pvdVfpGkaE34kH7cH79rTemVGpUqddaaZ ; 7th 5F95SXGB5dj6TpcKzPGZRCXMsoBLcgg7nmhZxSC5sHCHdDx7 ; Deeper has said they will burn the DPR from the 7 Validators but the miners do not know if they can trust Deeper Network to keeping there word and if it will be 100% Burn or just 1% like everything else........
Founder & Head of the Society Governance Platform Wallet Address: 5GViXCfq22KUdWYK9E6bFZXYJWY7v4EVKJz3mgn6vGGPU1iT this is a Genesis Gold Ter 8 out of the United Kingdom. This wallet seems to be programed to dump coins after there mined across the bridge to sell on and exchange. We will be following this wallet, stay tuned for updates...................
-Deeper Chain DPR Crypto Burn Wallet #1: (Warning this is a subject Deeper does not like to talk about) There has not been a routine burn setup yet promised by Deeper to fight inflation . The only burning is est 21DPR perday equivalent to about .80cents per day!!! from the Validator transactions which they are calling a “Routine Burning or Every Gas Fee”. The old burning was every 7 days and burnt all the treasury wallet. Then they slowed it down to every 24 Days thru the Treasury and to burn only about 1% now. There is credit burning set up for the miners, which is false advertisement because they only burn 1% of the money paid to buy credit to increase mining rewards. The rest of the money is added to the treasury wallet for Deeper to pay their DEVs instead. Waiting for Deeper Network to provide Burn Wallet Address for all three Blockchains so the community can monitor what they are being told. Talking about this subject will get you band and removed from Deeper Network Social media accounts so be aware………… Deeper Network has responded to my concern about this saying "that 1% of the treasury wallet is burned each day" but I don't believe that's what happens, I believe that only 1% of each transaction that is transferred to the Treasury wallet is then sent into the burn wallet only during the transaction process, not that 1% of the treasury wallet total is burned. So once the funds go into the Treasury wallet once the 1% has been taken out, the remaining funds are no longer programed to be burned. (...to be determined) At the moment it is unknown how to see a total burn amount from this wallet but you can see how much DPR will be burned in the next 7 day burn period.
-Deeper Chain DPR Crypto Burn Wallet #2: Deeper Network has not provided the wallet address from the burning during the Pico sale so the community can monitor the wallet activity. (I believe they did a fake burn because they did not even realize they had an internal burn wallet nor did they know they had a Treasury Wallet, I believe they just made a random what address and sent it there. But Deeper will not provide the process they used)
- Deeper Token ECR-20 Blockchain Ethereum Burn Wallet Address - Deeper Network has not provided the wallet address from the burning during the Pico sale so the community can monitor the wallet activity.
- Deeper Token BSC Binance Smart Chain Burn Wallet Address - Deeper Network has not provided the wallet address, nothing would be in the wallet address that i would be aware of if it exist yet
- Deeper Chain Treasury Wallet Address: This is how Deeper Network makes income from internal network transactions 5EYCAe5ijiYfyeZ2JJCGq56LmPyNRAKzpG4QkoQkkQNB5e6Z (At the moment this is funded by the left over Validator Transactions & Burn DPR for Credit Score Increase, ect. 1% of Transactions going into the wallet are Burned every 24 days, this is confirmed by looking at the programing on Github Deeper-Chain; Actions; Branches; modify treasury burnning rate
- Polkadot Parachain for Deeper Chain – not yet, no future plans at the moment (Verified by Polkadot Support)
-10 Billion DPR Total: 6 Billion DPR will be mined within 25years (Verified on AMA); & 4 Billion DPR Belong to Deeper & Investors
-Location of Deeper Network servers where VPN data is stored: Unverified, Programmers working from China, ect. , Government Jurisdiction over VPN data information unknown (As per Deeper User Policy to have to agree to Logs are kept by them internally), Privacy Policy VPN info shows data is kept by Deeper Network, time period kept unknown. Do not know why Deeper Network is not Transparent with this information like other VPN providers. And or what will be there main goal with this data kept.
- Deeper Network VPN / DPN equipment concerns: They say they do not keep logs of records of your internet access BUT!!!!! When you login to the device for the first time it makes you approve there two privacy agreements first. Terms and Condition of Use agreement under point Prohibited and restricted uses point #25 say : “We shall have the right… to monitor User Content”; The second agreement you must approve is the Deeper Network Privacy Policy under Data we Collect says “We may receive access to basic personal information from your social network accounts should you register or sign onto such services using Deeper Network Products or Services” (Why in the world is Deeper trying to collect your personal information?????????, also would they not also be able to see your banking information then...), then under section Data Retention it says “We will keep records containing personal data….. as maybe required by applicable laws (So then which governments laws are you under because there are countries that require no data collected) at the end of the day Deeper Network is not a Decentralized VPN because your data is collected in Deeper Networks Servers and Deeper Does not allow the Miners with the Exit Nodes for the VPN service to erase the VPN data on there own devices, even if their country allows for no logs to be collected. Will Deeper Network change their policy’s to be in harmony with what they told their community of NO LOGS/DATA KEEP BY DEEPER and ONLY DATA COLLECTED ON EACH EXIT NODE, apparently, they changed their minds……
Pico - At the moment the Pico is only good for mining with a Staked credit score, if the Pico has its own Public IP and is connected for months without being disconnected it will currently not get 10mb of traffic each day to get an increased organic credit score as an exit node, the network currently will choose a faster path out thru a Mini instead. So the Pico at the moment is not a good mining device if that's what you bought it for organically. This has been confirmed. Update: It seems like they are trying to fix this issue. If the device to left on for an extended amount of time it will work on the block chain but will not allow for personal internet access.
-Company Info:
-Deeper Network INC of the Marshal Islands (no office location there currently) Crypto Currency company that was set up as a shell company, filed on March 8, 2019 Entity number 100333 (Legal system mixed legal system of US and English common law, customary law, and local statutes; International law organization participation accepts compulsory ICJ jurisdiction with reservations; accepts ICCt jurisdiction)
-Deeper Network Inc of Delaware USA (no office location in Delaware currently) Software Developer/ VPN / DPN , Entity 201816910575 6/14/2018, (EIN Tax ID# 841835438 Old # from the first company that was formed), State ID 04799167 This is the company that controls everything.
-Location Of Head Quartiers Office (5200 Great America Pkwy, Santa Clara , California, 95054) : The main temp office rental location no longer exists that is advertised and on Entity Documents, the location is currently enmity and abandoned, supposedly working remotely from home and out of a shipping warehouse since the past two years+ or longer, unable to verify from the last trip to California. No new permanent office location currently that I am aware of that has been verified. Even from there past video of this office location you can tell it was just a temp location as if it was like one of those rent a cubical to work at temporary location.
(A lot of people have come and gone from the head ranks or moved DOWN to different positions within the company, High Turnover Rate, not sure if currently accurate)
Chief Executive Officer: Mao Liu ( aka also known as Michael Liu); China / California (Runs another Company in California Fam Capital which is not registered in the State of California to work in the State)
Chief Technology Officer: Hui Liu ( aka also known as Russell Liu); San Jose, California, USA
Chief Operations Officer: Xiaoshuai Liu ( aka also known as Cheryl Liu); Maple Ridge, British Columbia, Canada
Chief Marketing Officer: Position Open, last person quite and moved on...............
Contracts: Chao Ma
Secretary/Chief Financial Officer: Xiaoshuai Liu ( aka also known as Cheryl Liu); Maple Ridge, British Columbia, Canada
Corporate Officer: Adam Wolfe
Lei Chang; Saratoga, California
Chief Branding Officer: Yinan S.
Software Developer: Arturo Jimenez
Product manager: Kain Xu
Deeper Network if you feel any of this information is inaccurate please reach out to me and provide me proof showing something different and I will update it on my next post. Information is gathered thru the Deeper Network Community Chats. I have only been reached out to my one volunteer member from my post named Jordan and any discrepancies were adjusted.
