I'm not a bear anymore. 🚀No this title isn't clickbait - I think I genuinely figured out what the pitchfork is going on around here.
>I might be late to the pawrty, but from my perspective, I am right on time ;).
That odd move from 6\22~7\4 seriously threw me off, and I bet I wasn't the only one who was caught off guard by that peculiar structure.
It was a leading diagonal 😅!
I spent so many hours trying to figure out what in the world this uncanny formation was, and it wasn't until this evening that I decided to just scrap all my old charts and start with a new perspective. I was looking at the ETH chart, looking for some clues... When it all clicked, and everything just came together effortlessly. That move on ETH from 6\22~7\7 was a leading diagonal (It is a lot more pronounced on the eth chart, and was a lot more difficult to spot on the btc chart unless you were genuinely looking for it).
Lessons were learned on this night.
-----
As for the argument that we saw 5 waves down from 64k - Let's call it a WXYXZ . All of the measurements check out flawlessly, and it's one of the more complex structures in the book. I see btc pulling wxyxz's on the minute time frames all the time. The algos are pre-programmed to mess with us, and I think that's genuinely what this is.
-----
Watch for this last sub-fifth wave to complete at 49.5k (123.60% extension) to put in Wave (1) of our bull run.
From there we see a 0.618% (gz) retracement, to retrace this entire move that started in June down into Wave (2).
The golden zone perfectly aligns with the bottom of our pitchfork perfectly, as well as the midline of the bull channel we've created in March of 2020.
Wave 1 target = 49.5k
Wave 2 target = 34k
Wave 3 target = 84k
Wave 4 target = 60k
Wave 5 target = 108k
here's a visual representation of the bull channel:
---------
also here's the same idea posted on 7\23
Ps. I knew deep down that this rally was real, but I always try to look for alternative scenarios just in case. This is the one and only as of today, and it is my primary going forward. Once that Wave (2) is in, I'm going long \ hodl'ng everything & never looking back.
100k by christmas eve, calling it right now 🎄
BLX

BTC/USD (43k New Short Term Support)💎Technical Analysis Summary💎
BTC/USD
-Bitcoin respected the EMAs at the 8H timeframe period
-With the confluence of previous higher low at 43k dollar range
-The price is now retesting the recent top
-This zone has been tested 3x and it is still acting as resistance
-As long as the Bulls can hold above the EMAs and 44k dollars
-I think there is still a big chance for another leg up
-For now, Many altcoins have recovered from their recent downward move
-I am observing the market for potential swing trades
-Good luck everyone and stay safe!
⚠️Please always read the description⚠️
Thanks for donating 💰 via Tradingview coins bitcoinpam 🙏🎉
``````````````````````````````````````````````
If you need help🙋 don't hesitate to
Send me a message here PolarHusk 😊
``````````````````````````````````````````````
Trading Involves High Risk ⚠️
Not Financial Advice 💸
Exercise Proper Risk Management 💱
``````````````````````````````````````````````

Bitcoin Top Target BLX $250KUsing the .618 Fib line we can assume this is where we are within the 4 year period of Bitcoins run
Previous runs have shown rejections at this point, which is evident with the current rejection
I am placing my target at ~250k by the end of the 4 year Period
After this a Bear market may be entered
Don't underestimate BTC..
I do have thoughts however that this run will be propelled by Ethereum and the DeFi / NFT craze that has occurred, and a few assumptions based on chart structures
If it is propelled by Ethereum, this will be a first

don't shoot the messenger.i'm not convinced that crypto has finished this wave 4 correction, in fact - i am willing to place a large bet against this ponzi when the time comes 😅
take a look at this chart dating back to 2013:
every single correction we've ever had in the history of bitcoin has tested the weekly 200ema before resumption to the upside.
you know what is in perfect confluence with the 200 weekly ema?
the organic wave 4 algo target.
dead cat bounces are fun, but they are short lived - what follows after though, very few ever expect. the majority of the population trade using their emotions & get overly excited due to the large short term gains they experience 😁 (i know the feels, no hard feelings).
--
my downside target is 22k, we could see a wick get as low as 15k for a quick liquidity grab due to the over leveraged long liquidations.
this will put in wave 4 on a higher degree
my upside target from there is 120k (at the bare minimum).
ps. short term bearish, long term very bullish.
ps2. this will be The generational buying opportunity if you know exactly what to buy and when 😉.
best of luck to all 💸
BTC/USD (46K Acting Resistance?)💎Technical Analysis Summary💎
BTC/USD
-Bitcoin in the short term is looking to retest its local support
-Though this area has been tested before so it might likely do it again
-If the Bulls will defend the 43k dollars zone, then we can be safe
-Then expect a potential return up to the 46k dollars again
-From there, we will have to re-access the market if we can see another continuation
-A correction down to the 43k is a -5% decrease
-So please always have a trading plan and follow it
-Good luck and stay safe everyone
⚠️Please always read the description⚠️
Thanks for donating 💰 via Tradingview coins bitcoinpam 🙏🎉
``````````````````````````````````````````````
If you need help🙋 don't hesitate to
Send me a message here PolarHusk 😊
``````````````````````````````````````````````
Trading Involves High Risk ⚠️
Not Financial Advice 💸
Exercise Proper Risk Management 💱
``````````````````````````````````````````````

Possible out come?This chart simply shares an idea. It's not financial advice. Bitcoin looks like it want to make another parabolic move although we are not I repeat NOT out of the woods just yet. Having said that there is more weight towards the bull scenario with confluence on bullish signals.

BTC/USD (46k Target Hit)BTC/USD
Bitcoin hit 46k level base from my previous post
Like what I'm potentially expecting if the recent 42k is broken
I am looking for the next Fib target at the 46k level
From here, I expecting BTC to consolidate a bit
I will update my idea if I see new developments

taking another crack at this count.since most of the liquidity goes through binance, this will be the primary chart i will be using going forward. previously i was using the kukoin chart, as that's the exchange i use, but this morning i learned that nothing else matters except this binance chart.
----
this last move on july 31st from 42885.28 ---> 37915.50 caught me off guard, and i bet i wasn't the only one.
the only chart that clearly shows what's going on is this binance chart, every single other exchange made a lower low for that move, which made things very confusing \ invalidated this larger picture.
this is the only scenario that i could possibly think of given the new data this morning.
looking for 47~48k to put in wave (1) on the higher degree, before the 0.618 wave (2) pullback to that 35k area.
this would in theory set us up for a much larger move to the upside.
BTC/USD (Testing 20W Moving Average)💎Technical Analysis Summary💎
BTC/USD
-Bitcoin is now testing the weekly mid-resistance area
-We can see the price is reacting to this zone
-The 20W Moving Average also a confluence in this level, this may act resistance
-But if the Bulls can sustain the 41k-43k trading zone for the next 5-10 days
-I think we will have a higher chance to break above this resistance
-On the other hand, BTC Dominance bounces up from the 46 level support
-It is currently testing the mid resistance at 47 level
-Please be cautious a little because if this Dominance increase up to 48 level
-Altcoins will perform weakly or they may consolidate for a few days
-Good luck traders! and always follow your trading plan
⚠️Please always read the description⚠️
Thanks for donating 💰 via Tradingview coins bitcoinpam 🙏🎉
``````````````````````````````````````````````
If you need help🙋 don't hesitate to
Send me a message here PolarHusk 😊
``````````````````````````````````````````````
Trading Involves High Risk ⚠️
Not Financial Advice 💸
Exercise Proper Risk Management 💱
``````````````````````````````````````````````

Is the writing on the wall??? Possible bull trap in the making.Each time Log MACD retraced to the zero line was followed by a new higher low... Long term remains bullish, but we might see further consolidation to previous top at 20Kish... Place your stops accordingly if entering now.

An honest observation. I wanted to give you all my honest opinion on this move, and how i feel about what is happening right now.
This is an inversed chart on btc, inversed to make this as clear as possible.
From the highs of 64k, we saw 5 waves down - with the last wave seeing a truncation.
5 waves down is not a correction, it is an impulse.
Corrections generally move in 3 waves (5-3-5) 1-2-3-4-5(A) - a-b-c(B) - 1-2-3-4-5(C)
(some corrections are more complex than others, but after a 5 wave move down, we can eliminate every other type of correction except the simple 5-3-5)
(A)'s have 5 waves within them, so do wave (C)'s.
Which leads me to believe despite how things may look and seem these last few weeks, is we are still in a much larger correction.
Wave 4 corrections take the longest time to play out, and are the most psychologically advanced moves in the markets.
We are in a large Wave 4 correction from my perspective, and this will take time to play out. Could take weeks to months to a year to fully complete.
Take full advantage of this move up, hodl the alts which will run hundreds to thousands of percent in the meantime - but just keep this idea in the back of your mind, and remember - that this larger correction has not yet been completed.
-------
These are my four targets for for this second corrective phase (Wave B)
0.618% - 47k
100.0% 54k
123.60% = 59k
161.80% = 68k
Extended wave B moves are not uncommon, and they happen all the time - they push to the absolute extremes, sometimes even make a new all time high before the final drop which is usually the most parabolic move in any market.
One of these targets will reject and btc will drop to the low 20k's before the big Wave (5) begins.
(it is impossible to know which one of these will be The target, but i have a few ideas using some other data points)
-------
Take a look at the 1 year chart on the Fear \ Greed Index for btc; notice how when btc tops out, the greed index starts to consolidate \ move sideways before a massive drop down. This is what I'm looking at daily, and will continue to do so until i see this consolidation take place - once it does it will semi confirm a top, and we could better anticipate the closest target to us.
Also take a look at the 200 Week Moving Average Heatmap , Notice the how btc's heatmap turned blue recently, which triggered this strong move up. Historically - during a correction, whenever it turns blue that is when a dead cat bounce occurs, before the deeper dive to touch the 200 week moving average.
Ps. I will conclude this by saying: this is just my own personal opinion, from my own experience with corrections in the various markets out there. I have seen tens of thousands of them in my journey, and I feel fairly confident when identifying one. I am not bearish, in fact I am extremely bullish on btc in the long term. I think once this correction is completed, our final fifth wave on the highest degree will go anywhere between the hundred thousands all the way into the millions.
Best of luck to everyone, stay safe out there!

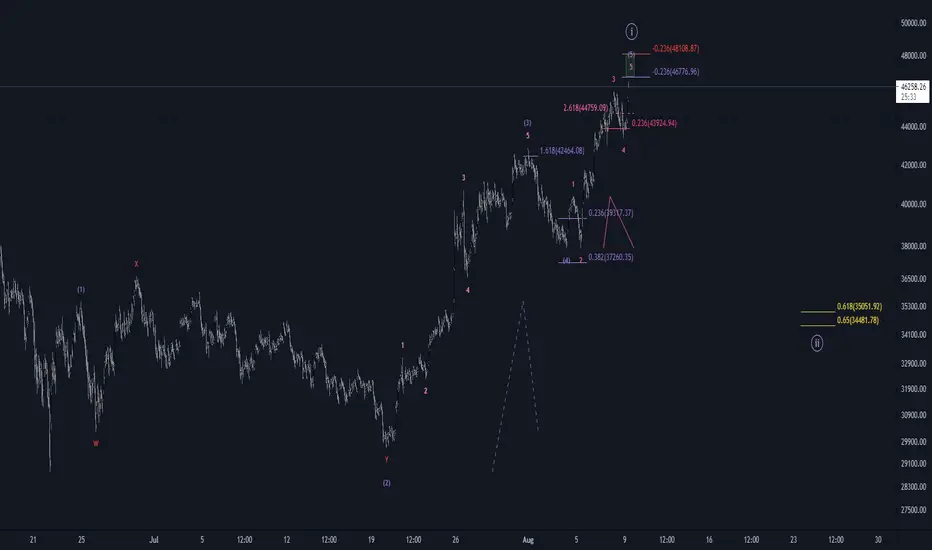
btc primary.look for this wave 1 to top out at 45.5k
that's also where the 200 daily simple moving average is, perfectly in confluence with our sub wave 5 target to put in wave (1) on a higher degree.
from there we should in theory see a mean reversion for wave (2) to about 34.7k
the alternative is btc will have a flat correction, similar to last year, where it will move sideways for a month or two, rather than down.
if we do see the mean reversion for wave 2, that is the key entry for long positions on any alts, as well as leveraged longs on btc.
since btc wants to move up, we have to adapt to what the new data is showing us, and as of this moment that data points straight up.
wave 5 could see an extension to 100k+, but i'm being conservative with my analysis here, and giving it a 84k upside target.
better to aim lower, than higher.
best of luck to everyone, let's get it.

BTC/USD (Bullish Recovery)BTC/USD
Bullish double bottom for Bitcoin
Back above 50MA
Retesting recent high
If broken, expect the price to hit 46k

BTC/USD (37k Dollars New Support?)BTC/USD
-Bitcoin found support at near the 20D Moving Average
-We can see a strong move up by the Bulls
-If this daily candle closes in green
-We can say the 37k dollar is our immediate support
-If and only if the recent top is broken upwards
-The chances to go higher increase to test 47k sell area
-For now, everything is looking safe again
-Some Altcoins is looking ready for mini reversals
-Good luck everyone and stay safe!
⚠️Please always read the description⚠️
Thanks for donating 💰 via Tradingview coins bitcoinpam 🙏🎉
``````````````````````````````````````````````
If you need help🙋 don't hesitate to
Send me a message here PolarHusk 😊
``````````````````````````````````````````````
Trading Involves High Risk ⚠️
Not Financial Advice 💸
Exercise Proper Risk Management 💱
``````````````````````````````````````````````

BTC/USD (Found Support at Fib .382)BTC/USD
Bitcoin found local support at Fib 0.382
If this current level will hold
Expect a run-up to a recent high at 42k dollars
Otherwise, a retest of support at 37k dollars
Potential mini consolidation for the next few days

BTC/USD (Fib Support Areas)Bitcoin is rejected at the 41k-42k resistance zone.
We have 3 potential areas where BTC can find support.
This is from 38k down to 34k where the 50D Moving Average is located too.
Let us wait and see.

BTC/USD (Good Monthly Support?)💎Technical Analysis Summary💎
BTC/USD
-Finally, after 3 months of red candles. The month of July finishes strong
-Bitcoin has a monthly immediate key area of support around 35k-29k dollars
-This is the zone we need to watch for the remaining months of this year 2021
-As long as this area will hold, BTC will remain Bullish until the end of the year
-For now, I'm expecting a few months of sideways trading again
-During this consolidation, Let us see if the Altcoins space will move stronger
-Because most of the time, Altcoins performs better when BTC trade-in range
-I will always keep my watchlist updated and hopefully share some of my public ideas
-See you and Good luck! :)
⚠️Please always read the description⚠️
Thanks for donating 💰 via Tradingview coins bitcoinpam 🙏🎉
``````````````````````````````````````````````
If you need help🙋 don't hesitate to
Send me a message here PolarHusk 😊
``````````````````````````````````````````````
Trading Involves High Risk ⚠️
Not Financial Advice 💸
Exercise Proper Risk Management 💱
``````````````````````````````````````````````

The Next UPs And Downs of BTCAs we Told before the last deep correction
BTC can record New ATH After this correction
Correction happened, and now We are expecting ATH & later , a deeper correction - about 80 to 95 %
So Be careful
Hold altcoins till BTC Records its now ATH - then - get ready to sell again
GL HF

BTC/USD (40k Area Acting Resistance?)💎Technical Analysis Summary💎
BTC/USD
-Bitcoin is currently testing the mid resistance area after a 40% increased from the 29k region
-This zone is a confluence of previous tops from January 8, May 26, June 15 trading
-Also, the 100 Moving Average is sitting inside this zone
-Take note, the RSI hit the 70 level or overbought territory
-After 9 trading days with all green candles, it is potential painting a red day
-If BTC tops out or slows down from here, expect a mini consolidation range
-A correction is likely to happen if not yet then BTC might break the 42k zone
-Let us wait and see which way the market will go within 24hrs-48hrs
-Good luck traders and stay safe!
⚠️Please always read the description⚠️
Thanks for donating 💰 via Tradingview coins bitcoinpam 🙏🎉
``````````````````````````````````````````````
If you need help🙋 don't hesitate to
Send me a message here PolarHusk 😊
``````````````````````````````````````````````
Trading Involves High Risk ⚠️
Not Financial Advice 💸
Exercise Proper Risk Management 💱
``````````````````````````````````````````````

BTC/USD (New Strength)💎Technical Analysis Summary💎
BTC/USD
-Bitcoin finally confirms the weekly key support area
-After a strong recovery back above the 50W MA and hitting the 40k level
-We can say BTC is safe for now in the coming weeks
-But the Bulls can't stay relax because the 40k dollar is acting as a strong barrier
-And also, we have a new CME price gap of around 34k-32k dollars
-We know these gaps are likely to get filled soon
-If you noticed some Altcoins are not doing well during BTC run-up
-It is because the Bitcoin Dominance level increases too by 5%
-The Altcoin space may move weak or slow in the coming days
-Unless the BTC Dominance decreases and Bitcoin moves in a range
-Congrats for the Bulls, let us see if they can make another follow-through
⚠️Please always read the description⚠️
Thanks for donating 💰 via Tradingview coins bitcoinpam 🙏🎉
``````````````````````````````````````````````
If you need help🙋 don't hesitate to
Send me a message here PolarHusk 😊
``````````````````````````````````````````````
Trading Involves High Risk ⚠️
Not Financial Advice 💸
Exercise Proper Risk Management 💱
``````````````````````````````````````````````

More Fib Circles BLX BitcoinDemonstrating the Power of the circle
Red areas = price decline as per hitting an area of the circle
Green areas = support area as per hitting an area of the circle
Linked is my guide to using the circle tool
Really do enjoy using this tool to portray support and resistance zones

Bitcoin Analysis and Commentary BLX Optimal entry point directed on chart
This is along a curve that has extended from the previous bull market top
An observation I can't display on chart is that the 200MA is forming a somewhat "W" pattern, meaning the structure of the 200MA is in the form of a W
Made a little spread between the entry point due to possible error while drawing the curve

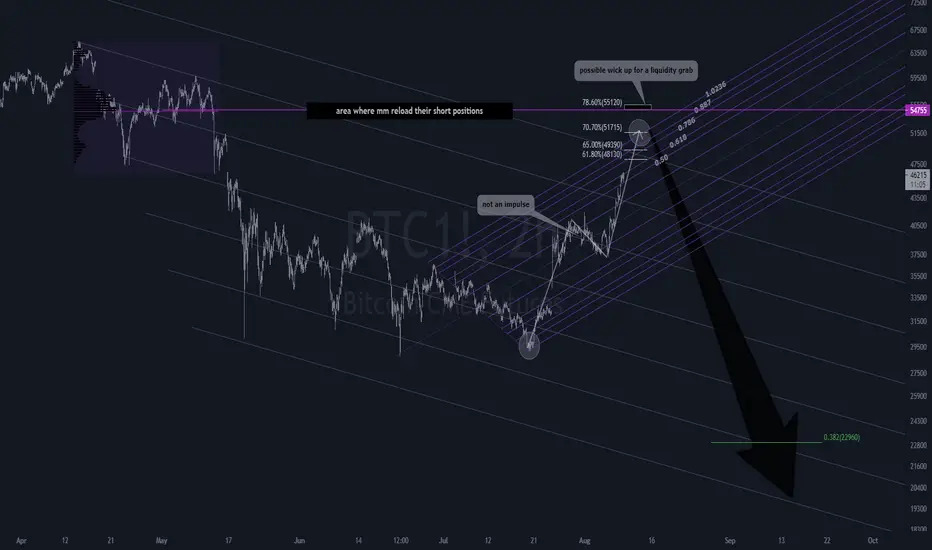
it isn't time yet.i took a closer look at this recent rally, and i can't help but feel like something is off about it. my intuition is telling me that this is yet again another phase of distribution before the deeper drop to lower lows.
it would explain the unusual volume spikes in this 34k range.
----
my downside projection sits at 25.5k as of this morning, and until the charts tell me otherwise - this will be my primary count going forward.
i could be wrong, but i have to trust my intuition on this one, as it is what got me here in the first place.
we could make one last push to about 36.2k, but the probability of that is very slim as of this moment.
i started layering in shorts as of this morning, and will continue to do so until i am proven wrong.
💸
ps. i talked about this scenario not too long ago, and this false break out of this wedge is the ultimate trap to anyone who doesn't see it coming. i have seen this scenario play out so many times on the smaller timeframes, so i just felt like sharing my opinion on this with you all.
