Boeing - Lowering HeightsWe are analyzing the move since November 2025, identifying two main impulses, which can be viewed as a three -wave structure of a larger five -wave move.
At this stage, it’s not critical whether this impulse is considered wave 5 or wave B of a larger move.
Currently, a downward move is expected. The exact corrective type will clarify the structure of the larger move.
Holding altitude above 207 would keep the flight on course and support continuation of the impulsive move.
Main targets:
240
232
225
219
---
Please subscribe and leave a comment!
You’ll get new information faster than anyone else.
---
Boeing

A turnaround at $BA...or just another false dawn?An excerpt from analysis covered on the @ForexTraderPaul Monday Market Update on YouTube.
I've not been the biggest fan of BA over the last few years - but you have to learn to trade what you see as opposed to what you think or your biases are trying to tell you.
Anyway, BA has been on a tear the last few weeks off the back of defence stocks bullishness, and a perceived turn-around in its fortunes. Question is: will their earnings, before the open on Tuesday, help propel them higher, or take the wind out of its sails?
Points to note:
- Ongoing quality and regulatory scrutiny continues to cap confidence and multiple expansion.
- Cash flow recovery remains the key medium-term test, not order book strength.
- Reputation risk is now embedded, keeping institutional positioning cautious.
What traders should be aware of:
BA is headline-sensitive — regulatory updates and production commentary matter more than traditional earnings beats.

BA | The Boeing Company Will Grow Into 2026The Boeing Co. is an aerospace company, which engages in the manufacture of commercial jetliners and defense, space, and security systems. It operates through the following segments: Commercial Airplanes (BCA), Defense, Space and Security (BDS), Global Services (BGS), and Boeing Capital (BCC). The Commercial Airplanes segment includes the development, production, and market of commercial jet aircraft and provides fleet support services, principally to the commercial airline industry worldwide. The Defense, Space and Security segment refers to the research, development, production and modification of manned and unmanned military aircraft and weapons systems for global strike, including fighter and combat rotorcraft aircraft and missile systems, global mobility, including tanker, rotorcraft and tilt-rotor aircraft, and airborne surveillance and reconnaissance, including command and control, battle management and airborne anti-submarine aircraft. The Global Services segment provides services to commercial and defense customers. The Boeing Capital segment seeks to ensure that Boeing customers have the financing they need to buy and take delivery of their Boeing product and manages overall financing exposure. The company was founded by William Edward Boeing on July 15, 1916 and is headquartered in Arlington, VA.

Is Boeing's Defense Bet America's New Arsenal?Boeing's recent stock appreciation stems from a fundamental strategic pivot toward defense contracts, driven by intensifying global security tensions. The company has secured major wins, including the F-47 Next Generation Air Dominance (NGAD) fighter contract worth over $20 billion and a $4.7 billion deal to supply AH-64E Apache helicopters to Poland, Egypt, and Kuwait. These contracts position Boeing as central to U.S. military modernization efforts aimed at countering China's rapid expansion of stealth fighters like the J-20, which now rivals American fifth-generation aircraft production rates.
The F-47 program represents Boeing's redemption after losing the Joint Strike Fighter competition two decades ago. Through its Phantom Works division, Boeing developed and flight-tested full-scale prototypes in secret, validating designs through digital engineering methods that dramatically accelerated development timelines. The aircraft features advanced broadband stealth technology and will serve as a command node controlling autonomous drones in combat, fundamentally changing air warfare doctrine. Meanwhile, the modernized Apache helicopter has found renewed relevance in NATO's Eastern flank defense strategy and counter-drone operations, securing production lines through 2032.
However, risks remain in execution. The KC-46 tanker program continues facing technical challenges with its Remote Vision System, now delayed until 2027. The F-47's advanced variable-cycle engines are two years behind schedule due to supply chain constraints. Industrial espionage, including cases where secrets were sold to China, threatens technological advantages. Despite these challenges, Boeing's defense portfolio provides counter-cyclical revenue streams that hedge against commercial aviation volatility, creating long-term financial stability as global rearmament enters what analysts describe as a sustained "super-cycle" driven by great power competition.

Another fake news on orders from Turkish AirlinesAnother round of “fake news”?
Headline: Boeing receives a major order from Turkish Airlines for up to 225 aircraft.
Reality check: Turkish Airlines currently operates just 387 aircraft in its fleet. Earlier this year, we saw the same script play out when reports claimed Pegasus Airlines — the low-cost arm of Turkish Airlines — placed “hundreds of orders.”
Once again, the numbers don’t add up...

Boeing ( $BA) Navigates Costs, Delays, and New Order MomentumBoeing (NYSE: NYSE:BA ) is working through one of its most challenging phases as production delays for the 777X have triggered a $4.9 billion cash charge. The pushback of the first 777X delivery to 2027 adds pressure to Boeing’s multi-year recovery plan and complicates its ability to stabilize cash flow. Heightened regulatory oversight and persistent technical hurdles continue to slow production, contributing to the stock’s decline of more than 25% since its July peak.
Even with these setbacks, Boeing remains a central force in global aviation. Its 5,900-plane backlog demonstrates resilient long-term demand, and recent airline agreements highlight confidence in Boeing’s future. Strong international partnerships reinforce the company’s competitive positioning despite near-term delays.
This week alone, Boeing secured major orders that could bolster its financial outlook. Emirates ordered 65 additional 777-9 jets—an estimated $38 billion deal—which expands its total Boeing order book to 315 aircraft. flydubai also signed an MoU for 75 Boeing 737 MAX aircraft valued at roughly $13 billion. These commitments strengthen Boeing’s medium-term pipeline and provide revenue visibility well into the next decade.
Boeing continues to expand its defense portfolio as well. The company recently secured an $877 million U.S. Department of Defense contract for MH-47G helicopters, supplementing ongoing deals with Ethiopian Airlines, Gulf Air, and Air Senegal. These diversified contracts help cushion Boeing from commercial-aviation volatility.
Technical Outlook
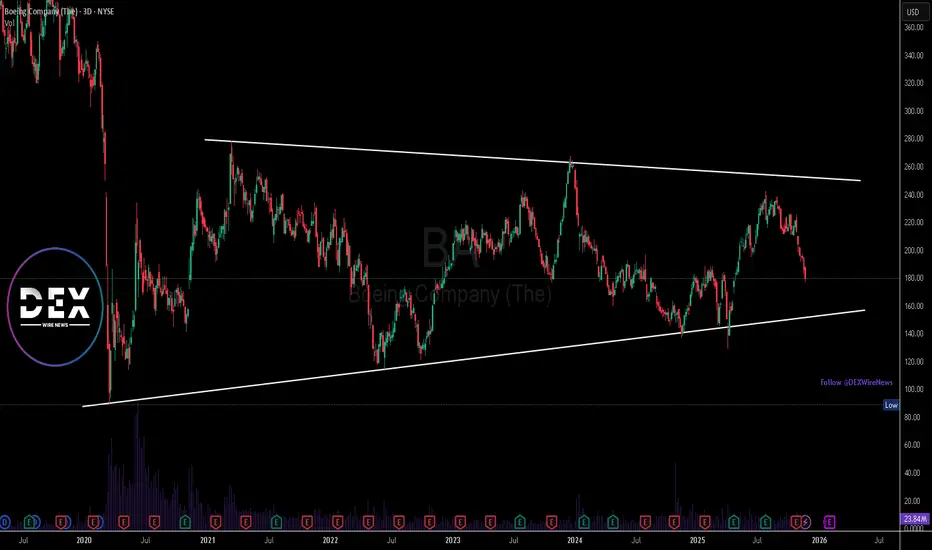
Technically, BA trades inside a multi-year bearish symmetrical triangle, reflecting uncertainty and long-term consolidation. Momentum remains bearish as price approaches the triangle’s base support zone. If the support holds, BA could stage a recovery bounce; however, a breakdown signals further downside.
Boeing Eyes Major T-7 Deal as Price Trades In a Falling Wedge Boeing is drawing renewed attention as it prepares to announce a new partnership tied to an international bid for its T-7 trainer jet. Executives confirmed that details should emerge within a week, signaling growing global demand for lightweight training aircraft. The move follows earlier reports that Boeing and Saab, already joint partners on the T-7 program, have been in discussions with BAE Systems.
Their potential collaboration is viewed as a strategic push to compete for Britain’s future trainer fleet, which is expected to replace the long-serving Hawk jets after the UK’s latest defense review recommended a next-generation solution. Boeing’s expanding interest in major markets across Europe and Asia reflects the rising need for advanced trainers as air forces modernize and prepare pilots for fifth-gen fighters. The news comes during the Dubai Airshow, where defense procurement momentum tends to accelerate.
Fundamentally, Boeing’s defense segment is becoming increasingly important as the commercial aircraft division continues navigating production and delivery challenges. A strong T-7 export pipeline could support better revenue diversification and stabilize long-term contracts. While the final structure of the upcoming partnership remains unknown, investor sentiment is likely to improve if Boeing secures a competitive position in the UK tender. However, integration, execution risks, and geopolitical uncertainty remain factors that could affect the program.
Technically, Boeing’s chart shows a long-term symmetrical wedge formation. Price is trading near $194, sitting in the midpoint of the structure. The upper trendline around $250 continues to cap bullish momentum, while the rising lower trendline near $150 provides multi-year support. Recent selling pressure has pulled price off the $240 region, but the long-term structure remains intact. A breakout above $250 could trigger a strong continuation move, while a breakdown below the rising base would shift sentiment bearish.

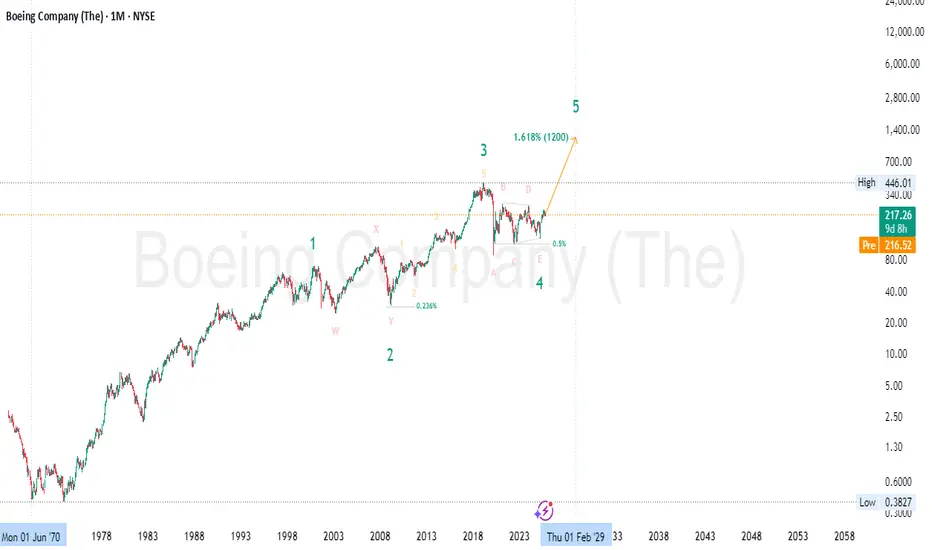
Boeing (BA) – Final Leg of Macro Bull Run✈️ Boeing (BA) – Final Leg of Macro Bull Run | Wave 5 to 1.618 Extension ($1200) 🚀
📅 Timeframe: Monthly (Macro Cycle Outlook)
📍 Current Price: $217
🎯 Wave 5 Target : ~$1200 (1.618 Extension)
🌀 Wave Theory Structure
Boeing appears to be entering Wave 5 of a long-term Elliott Wave cycle:
✅ Wave 1: Multi-decade rise until the early 2000s
✅ Wave 2: Complex correction (W–X–Y) into 2009 lows
✅ Wave 3: Powerful rally through 2019, completed with an extended 5-wave subdivision
✅ Wave 4: A large-scale triangle correction (ABCDE) — now completed, as price has broken structure upward
🚀 Wave 5: Projected move toward the 1.618 Fibonacci extension (~$1200) from the 1–3 wave distance
This is a textbook impulsive wave structure playing out on the monthly macro scale — with a final bullish leg now unfolding.
📐 Fibonacci Confluence
Wave 2 retraced ~0.236 of Wave 1 (shallow, bullish corrective behavior)
Wave 4 retraced ~0.5 of Wave 3 — typical for triangle patterns and expanded flats
Wave 5 target at 1.618 Fib extension measured from Wave 1–3 aligns around $1200 , completing the 5-wave macro cycle 🔺
🧠 Smart Money Concepts (SMC)
🔹 Accumulation Phase (2020–2024): After COVID crash and multi-year consolidation, price has shown strong accumulation characteristics
🔹 Final Sweep of Lows (E leg) flushed out late longs and retail stops before institutional re-entry
🔹 Break of Structure (BOS) confirms transition from reaccumulation to markup phase 📈
🔹 Price is now in a reprice phase — a classic SMC trait where value is rapidly adjusted after institutional positioning completes
📊 Price Action Analysis
Bullish breakout from triangle structure
Monthly higher low established at E-wave base
Strong bullish candle from demand zone — early confirmation of trend continuation
Break above $260 would open clean skies toward the next major resistance at ATH ($446) and beyond 🧭
💼 Fundamental Outlook
Boeing is regaining strength after multiple challenging years:
✈️ Rebound in global aviation demand
📦 Growing defense & aerospace contracts amid rising geopolitical tensions
💰 Expected recovery in cash flows, backlog, and profitability
🌐 Expansion in space and unmanned systems (future growth verticals)
Although regulatory and delivery risks remain, Boeing’s turnaround story is gathering steam — aligning with the technical forecast of Wave 5 acceleration.
🔍 Summary
Boeing is entering what could be the final and most explosive leg (Wave 5) of its macro Elliott Wave cycle. Key confluences include:
✅ Elliott Wave triangle completion
✅ Fibonacci 1.618 extension to ~$1200
✅ Institutional accumulation confirmed
✅ Price Action breakout from multi-year structure
✅ Improving long-term fundamentals
This setup favors long-term swing positions , with pullbacks offering buying opportunities until the final cycle target is approached. 🧠📈
⚠️ Disclaimer: This is not financial advice. For educational purposes only. Always do your own due diligence and manage risk responsibly. 🛡️
#Boeing #BA #ElliottWave #SmartMoney #PriceAction #Fibonacci #Wave5 #TriangleBreakout #TechnicalAnalysis #LongTermInvestment #MacroTrading #StockMarket #BullishOutlook #Aerospace #WaveTheory #SwingTrading #AviationRecovery #FibonacciTargets #TradingStrategy
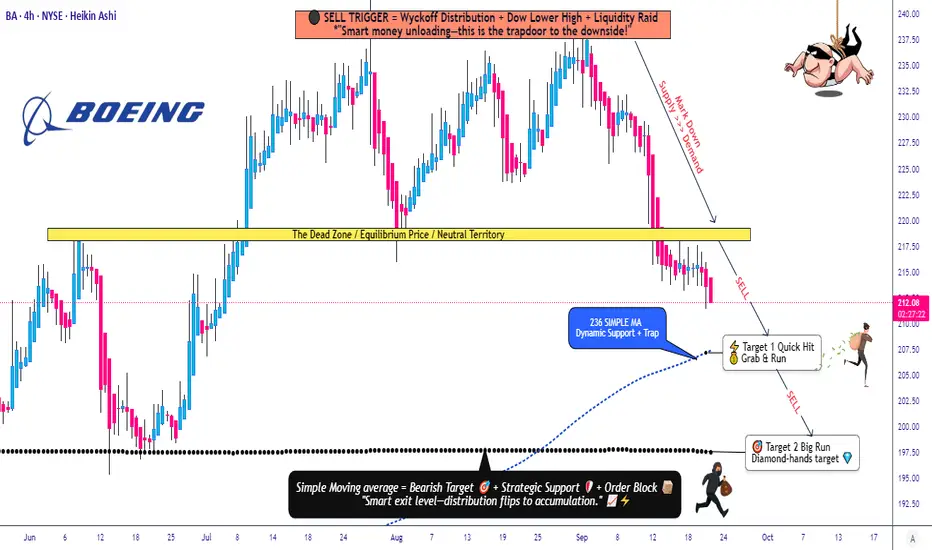
Boeing (BA) Technical Outlook: Is Downside Momentum Building?✈️ BA "BOEING COMPANY" | Cash Flow Management Strategy (Swing/Day Trade)
📉 Plan: Bearish Setup
This analysis follows the Thief Strategy 🕶️ — a layering method of multiple sell-limit orders across different levels.
🔑 Trade Plan
Entry (Layered Sell Limits):
220.00
218.00
216.00
214.00
(You can increase/decrease limit layers based on your own preference)
Stop Loss: 227.00 (⚠️ Thief SL)
Note: Dear Ladies & Gentleman (Thief OG’s) 🙌 this SL is just my own preference. Please manage your risk your own way.
Targets 🎯
TP1 → 207.00
TP2 → 197.00
Note: Targets are my reference points. You can book profits at your own choice, anytime.
📊 Key Points & Correlation
Boeing (BA) often reacts to aviation sector news ✈️ and macroeconomic cycles 📉.
Watch related pairs for correlation / sentiment clues:
AMEX:SPY (S&P 500 ETF) – BA is a Dow & SPX component.
TVC:DJI (Dow Jones Index) – Direct BA weighting.
NYSE:LMT (Lockheed Martin) – Sector peer correlation.
SKILLING:AIR.PA (Airbus SE) – Competitive aviation stock in Europe.
A slowdown in air travel demand, defense spending shifts, or broad market weakness may enhance bearish momentum.
🧠 Strategy Style Reminder
This is the Thief Layering Strategy → scaling into positions step by step with multiple limit orders, not rushing into full size at once. It’s a patient cash flow management approach.
✨ “If you find value in my analysis, a 👍 and 🚀 boost is much appreciated — it helps me share more setups with the community!”
⚠️ Disclaimer: This is Thief Style Trading Strategy — just for fun & educational purpose. Not financial advice. DYOR & manage risk.
#BA #Boeing #Stocks #DayTrading #SwingTrading #LayeringStrategy #ThiefStyle #SPY #DJI #LMT #Airbus #StockMarket
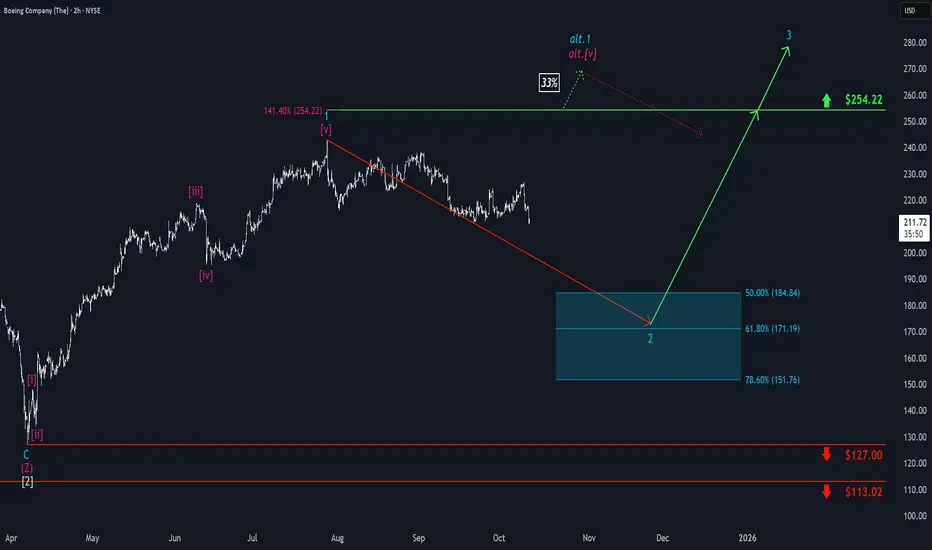
Boeing: Target Zone AheadOver the past two weeks, Boeing shares have seen several upward moves, but each rally was quickly met with selling pressure. In our primary scenario, we anticipate further declines as part of turquoise wave 2, which is expected to conclude within our turquoise Target Zone of $184.84 to $151.76. Looking ahead, wave 3 offers potential for gains above resistance at $254.22. A direct breakout above this level would initially signal a higher high within turquoise wave alt.1 before the anticipated correction occurs (probability: 33%).
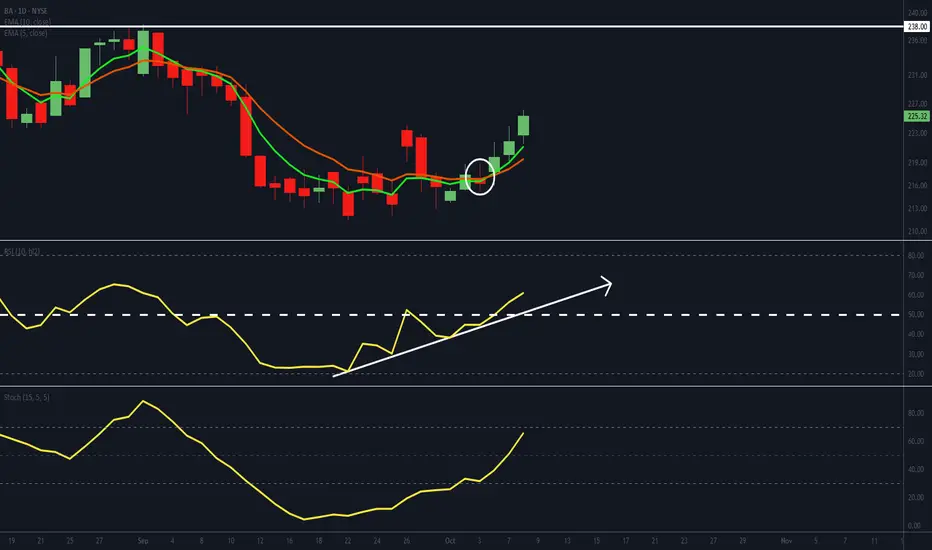
BA setting up for potentially strong move
- BA's EMAs have crossed bullishly and are developing angle and separation.
- Its RSI has popped above 50, suggesting a shift to positive momentum.
- Its stochastic is on the borderline to cross through 70. A move above, will add to the positive momentum argument. The longer it maintains above 70, the greater the likelihood of further price appreciations.
- Overhead resistance is at 238. A break above will be regarded as a bullish development.
Boeing (BA) Share Price Could Reach 2025 HighsBoeing (BA) Share Price Could Reach 2025 Highs
As the Boeing (BA) stock chart indicates, the price rose by 3.5% yesterday, while the S&P 500 index (US SPX 500 mini on FXOpen) gained only 0.4%. Boeing’s stronger performance reflects optimism driven by news (and market rumours) reported in the media suggesting that:
→ Korean Air has purchased more than 100 aircraft during the newly elected South Korean president’s visit to the White House;
→ Boeing is negotiating the sale of 500 aircraft to China;
→ the Trump administration may acquire stakes in companies linked to the defence sector (Palantir, Boeing, Lockheed Martin).
Technical Analysis of BA Stock Chart
BA’s price fluctuations have formed an upward channel (shown in blue). However, at the end of July, the rally encountered resistance around the $235 level:
→ following a volatility spike at the end of July (triggered by the quarterly earnings release), the price retreated towards the lower boundary of the channel;
→ in mid-August, the price turned downwards again from this level.
At the same time, we can observe a sequence of higher lows (1-2-3), emphasising that the lower boundary of the channel is acting as key support, setting the pace for BA’s growth trajectory in 2025.
It is worth noting that the stock’s oscillation between support (the lower boundary) and resistance around $235 is creating bullish patterns such as an Ascending Triangle and a Cup and Handle.
Should reports of a potential Boeing share purchase by the US government be confirmed, the BA stock price could advance to new annual highs. In such a scenario, several factors could be important:
→ the price may subsequently consolidate around the channel’s median;
→ historically, the $250–260 zone has acted as significant resistance during 2021–2023;
→ the $235 level may switch roles to become support, similar to the way $218 previously did.
This article represents the opinion of the Companies operating under the FXOpen brand only. It is not to be construed as an offer, solicitation, or recommendation with respect to products and services provided by the Companies operating under the FXOpen brand, nor is it to be considered financial advice.

Boeing Breakdown? $210 LEAP Put Trade Could Explode🚨 BA LEAP Put Play – Bearish Setup Into 2026 🚨
📉 Boeing (BA) is setting up for a long-term downside move. With monthly RSI < 45, negative momentum, and a macro headwind backdrop, this is a high conviction bearish LEAP trade.
📊 TRADE DETAILS 📊
🎯 Instrument: BA
🔻 Direction: PUT (SHORT)
🎯 Strike: $210.00
💵 Entry Price: $19.30
🎯 Profit Target: $45.00
🛑 Stop Loss: $11.28
📅 Expiry: 2026-09-18
📈 Confidence: 75%
⏰ Entry Timing: Market Open
🔥 Why This Works
✔️ Bearish momentum confirmed 📉
✔️ RSI < 45 = weakness 🚨
✔️ LEAP structure avoids rapid time decay ⏳
✔️ Macro headwinds = pressure on BA 🌍
⚠️ Risk: Macro or sector rebound could limit downside.
Quantum's BA Weekly Outlook 7/19/25🚀 G.O.D. Flow Certified Trade Blueprint – Boeing (BA)
1. 🧩 Summary Overview
Ticker: BA
Current Price: $229.34
Trade Type: Day Trade / 0–2 Day Swing
System: G.O.D. Flow (Gamma, Orderflow, Dealer Positioning)
2. 🔬 Flow Breakdown
🔵 GEX (Gamma Exposure):
Highest negative GEX at $230 = possible resistance or sticky zone.
However, +GEX2 at $235 and +GEX3 at $240 outweigh $230 → suggests dealer hedging will push price upward through gamma bands.
🟡 DEX (Delta Exposure):
+DEX peaks at $230 then fades toward $240 and reappears at $250 → bullish flow decay confirms momentum needs volume through $235–240 to continue upward push.
🟣 Vanna:
Flip zone at $232.50 → if IV rises and price pushes upward, dealers must buy, adding tailwind.
Major positive clusters at $240 & $250 = major squeeze potential if IV increases intraday.
🔴 Charm:
Flip zone at $227.50 = above this level, morning decay benefits bulls.
Negative charm at $240 & $250 = expect afternoon fade into these zones — ideal trim targets.
⚪ Volatility:
Volatility decreasing weekly = less explosive risk, more structured/predictable flow.
Dealers will likely have cleaner hedging paths without IV shocks.
🟢 Open Interest:
Stacked calls at $230, $235, $240, $250.
Aligns with GEX/Vanna targets → confirms upside skew.
3. 🧭 Chart Structure Setup
Daily: Consolidation breakout attempt.
Hourly: Bounce off support with bullish stochastics crossover.
10M OR: Mark OR High/Low — use reclaim of OR High + VWAP as entry signal.
Resistance: $235–240 (flow + OI + chart confluence) = ideal trim zone.
4. 🎯 Trade Plan
Bias: Bullish
Trigger Entry: Break and reclaim of $232.50 (Vanna Flip)
Contract Suggestion:
235c or 240c, 0–2 DTE (Friday expiry if early week)
Stop-Loss:
VWAP loss or break below $230
Target Zones:
🎯 T1: $235 (GEX2 + OI cluster)
🎯 T2: $240 (GEX3 + Vanna/Charm confluence)
5. 🔁 Intraday Adjustment Triggers
If This Happens: Then Do This:
GEX flips positive above $232.50 Strengthen conviction
Vanna clusters weaken + IV drops Trim / De-risk
Charm flips heavily negative by 12pm Expect fade into highs
Large sweeps hit 235c/240c strikes Ride momentum with size confidence

Boeing (BA, 1W) Falling Wedge + H-Projection TargetOn the weekly chart, Boeing has formed a classic falling wedge — a bullish reversal pattern that typically signals the end of a correction phase. After a sharp decline from $267.97 to $138, price action began to compress within a wedge, forming lower highs and higher lows on declining volume — a textbook setup for a breakout.
The structure remains active: a confirmed breakout above the upper wedge boundary, with a retest near $181.60 (0.618 Fibonacci retracement), would validate the pattern and trigger the next upward phase.
The projected move (H) equals the height of the previous impulse — $130.02. Adding this to the base of the wedge (~$138) yields a technical target of $268.00, aligning with the previous high and completing the structural recovery.
Technical summary:
– Multiple confirmations of wedge support
– Volume declining into the apex (bullish)
– Entry zone: breakout + retest at $181.60
– Mid-level resistance: $198.09 (0.5 Fibo)
– Final target: $267.97–$268.00 (H-projection complete)
Fundamentals:
Despite operational setbacks, Boeing remains structurally positioned for recovery as demand for commercial aircraft rebounds. Additional support could come from improving supply chains, increased defense contracts, and a more dovish outlook from the Federal Reserve heading into 2025.
A breakout above $181.60 and sustained momentum would confirm the falling wedge pattern and activate the H-measured move toward $268. This is a structurally and fundamentally supported mid-term recovery setup

Yesterday was bad for BOEING CompanyYesterday was bad for BOEING Company.
This stock has been fighting to recover from the many challenges it has faced lately, and here comes the India news.
The stock (BA) experienced about 5% drop before its recovered a bit.
It is trading at about $203, but if it breaks the trendline on the chart and the $200 support zone, we might see it go downhill a little more.
I will be happy to buy using DCA strategy from $193 - $186 zone.
Trade with care.
Please, if it is helpful, follow me, like, comment and share

Boeing (BA): Watching for a Break Above 218.80NYSE:BA has a strong chance of breaking above the 218.80 level , with a potential move toward 221.98 .
I plan to enter 1 tick above 218.80, with a stop-loss based on the 5-minute ATR (period 10).
🔍 Technical Outlook:
BA is currently moving within an upward ABCD channel. The projected upside is capped by a strong resistance zone at 221.98 – a level derived from the daily chart and previous price action. The market may or may not react to it, but it’s a logical target within a solid risk-to-reward setup.
One aspect I particularly like about this setup is the market’s inability to close significantly below the previous pivot high at 215.80. This suggests underlying strength. If we see a confident move above resistance, the trade could be triggered with momentum.

BA Weekly Options Play – 2025-06-10🧾 BA Weekly Options Play – 2025-06-10
Bias: Moderately Bearish
Timeframe: 5 trading days
Catalysts: Short-term exhaustion signals despite positive news
Trade Type: Single-leg PUT option
🧠 Model Summary Table
Model Direction Strike Entry Price Target Stop Loss Confidence
Grok Bullish 217.50C $0.79 $1.19 $0.40 65%
Claude Bearish 205.00P $0.95 $1.50–2.00 $0.50 72%
Llama Bearish 205.00P $0.95 $1.14 $0.48 70%
Gemini Bearish 202.50P $0.55 $1.00–1.10 $0.25 65%
DeepSeek Bearish 205.00P $0.95 $1.90 $0.47 60%
✅ Consensus: Moderately Bearish
📉 Setup: Tactical mean-reversion play from overbought RSI and MACD divergence
⚠️ Outlier: Grok sees bullish continuation toward $217.50 (minority view)
🔍 Technical & Sentiment Recap
Short-Term: 5-min RSI ~88 (overbought), price hugging upper Bollinger Band
Daily Chart: MACD bearish divergence or slowing momentum
Sentiment: Mixed headlines—China aircraft deliveries positive, but max pain at $207.50 acts as gravitational pull
VIX: Low (≈16.8), suggesting limited volatility but a stable short bias
✅ Final Trade Recommendation
Parameter Value
Instrument BA
Strategy Weekly naked put
Strike $205.00
Entry Price $0.95 (ask)
Profit Target $1.50 (≈58% gain)
Stop-Loss $0.50 (≈47% premium loss)
Size 1 contract (risk ≤2% of account)
Entry Timing At market open
Confidence 70%
🎯 Rationale: Consensus expects BA to retrace from short-term overbought condition back toward max pain zone (~$207.50). Four out of five models favor put option setups.
⚠️ Risk Factors
A strong gap above $211.50 invalidates short thesis → cut immediately
Strong fundamentals (China fleet growth, aviation sector strength) could support further upside
VIX staying low = slow downside → puts may decay rapidly
Use limit order on open to manage slippage risk
📊 TRADE DETAILS SNAPSHOT
🎯 Instrument: BA
🔀 Direction: PUT (SHORT)
🎯 Strike: 205.00
💵 Entry Price: 0.95
🎯 Profit Target: 1.50
🛑 Stop Loss: 0.50
📅 Expiry: 2025-06-13
📏 Size: 1 contract
📈 Confidence: 70%
⏰ Entry Timing: open
🕒 Signal Time: 2025-06-08 16:10:44 EDT

Hexcel CorporationKey arguments in support of the idea:
Hexcel Corp. (HXL) engages in the development, manufacture, and marketing of lightweight structural materials. It operates through the Composite Materials and Engineered Products segments. The Composite Materials segment includes carbon fiber, specialty reinforcements, resins, prepregs and other fiber-reinforced matrix materials, and honeycomb core product lines and pultruded profiles. The Engineered Products segment refers to the lightweight high strength composite structures, engineered core and honeycomb products with added functionality, and additive manufacturing.
As of the end of 2024, approximately 40% of Hexcel’s revenue comes from Airbus and 15% from Boeing (BA). The latest quarterly outlook signals flat revenue expectations, although we believe there are still identifiable growth drivers.
While Airbus delivered fewer aircraft in Q1 2025 compared to the same period last year, the company reaffirmed its commitment to expanding production capacity for the A320neo—one of Hexcel’s the most exposed programs. A resolution between the U.S. and EU on tariffs would represent a highly favorable scenario for the company.
Hexcel’s second- and third-largest programs are the Boeing 737 MAX and 787. Recent delivery data from April shows Boeing is gradually increasing production for both aircraft, suggesting that Hexcel’s revenue share from Boeing could rise in 2025 and beyond. For context, Boeing accounted for 25% of Hexcel’s revenue in 2019, 10 ppts higher than the current level.
Hexcel’s stock performance has closely tracked that of Boeing over the past year. However, HXL has yet to fully catch up to Boeing’s recovery. HXL is currently trading above its 50-day moving average and is gradually gaining momentum.
We expect HXL shares to reach $61 within the next 2 months. We recommend setting a stop loss at $49.70.

Strong Support, Bullish Setup – Boeing Poised to Reclaim $448Since the Monday, March 2, 2020 candle, Boeing's stock has been trading within a consolidation zone. The price action formed a critical double bottom around the $107.95 region, establishing this level as a strong support zone. This zone has been tested twice and held firmly, signaling robust buying interest and a base formation for a potential long-term uptrend.
🔵 Long-Term Trajectory
The stock is trending within a clearly defined upward price channel marked by two parallel blue trendlines.
The Lower Price Levels in Upward Trajectory have acted as reliable support since the early 2000s.
The Upper Price Levels in Upward Trajectory reflect long-term resistance where price has historically faced selling pressure.
The recent price action has respected the lower boundary of this channel, bouncing off it and heading upward, suggesting bullish momentum is returning.
🔴 Resistance and 🟢 Support Zones
Strong Support Region: $107.95
This is a historically defended level, with long-term demand and a significant reversal observed in past cycles.
Resistance for Shorter Timeframe: $273.93
Price may face selling pressure here. Conservative traders could aim for this TP1 level in the medium term.
Resistance for Higher Timeframe: $448.05
This is a major target (TP2) based on historical resistance levels. The breakout beyond this level would require strong bullish catalysts, but reaching this level is a likely scenario if the current upward channel continues to hold.
📌 Key Levels
• Current Price: $204.72
• Stop Loss: $130 (for long-term position)
This level is beneath the lower consolidation zone and still within the long-term channel—risk is managed accordingly.
• TP1: $273.93
• TP2: $448.05
For shorter-term traders, it's advised to set stop-loss levels based on individual Risk-to-Reward (RR) ratios and market volatility. The range between $130 and $273.93 provides sufficient space to capture shorter-term gains.
🔁 Consolidation Period & Momentum Shift
The "Last Candle Before Consolidation Period" noted in 2020 marked the beginning of prolonged sideways movement. This base-building phase typically precedes strong directional moves. The breakout from this zone and current monthly candle activity above $200 suggest a renewed bullish phase is underway.
💼 Boeing Fundamentals – A Strong Backing for Technical Setup
Boeing remains one of the world’s largest aerospace and defense companies, with a robust order book, government contracts, and recovering commercial aviation demand. Despite past setbacks, including the 737 MAX grounding and pandemic-related disruptions, Boeing has taken strategic steps to:
• Restore investor confidence
• Strengthen its balance sheet
• Increase aircraft deliveries
With increasing global air travel and heightened defense spending, Boeing’s fundamentals support the bullish technical outlook.
This chart analysis suggests a strong long-term bullish opportunity for Boeing (BA). With price bouncing off historical support, and currently respecting the long-term upward channel, the potential to reach TP2 at $448.05 is both technically and fundamentally supported.
🔒 Stop loss at $130 protects against downside while allowing room for volatility.
📈 TP1 at $273.93 for cautious traders, and TP2 at $448.05 for those holding long-term.
Always assess RR ratios and market conditions before entering trades, and adjust your stop-loss dynamically if you're trading short-term.

BOEING EARNINGS ABOUT TO PRINT Fundamental Outlook NYSE:BA
Boeing is heading into its Q1 2025 earnings with notable challenges. Ongoing quality-control issues, supply chain disruptions, and a reported negative profit margin are creating headwinds. Additionally, recent negative publicity surrounding production delays and regulatory scrutiny may further dampen investor sentiment. While potential defense contract wins or positive updates on 737 MAX production could provide a lift, the risk of a disappointing earnings report remains high, especially in a volatile aerospace sector.
Technical Analysis (Using Bollinger Bands Strategy)
On the 4-hour chart, Boeing’s stock price is currently trading at $175.46, as seen in the provided chart. Applying Bollinger Bands, the price has recently broken below the lower band, signaling a potential oversold condition but also confirming a strong bearish momentum. The price has been trending below the 20-period moving average within the bands, with the bands widening—a sign of increased volatility. This setup suggests a continuation of the downward move, especially with the recent sharp decline highlighted by the red arrow in the chart.
Target
Wait for bearish confirmation
Entry SHORT: Around $165.50, Targeting $152.00.
Secondary Target: $146.00.
Resistance Levels: $180.00, $185.00, $188.60.
Support Levels: $165.00, $155.00, $148.00.
The price is struggling to reclaim the 20-period moving average, and with earnings approaching, a breakdown below $170.00 could accelerate the decline toward $165.00 or lower. However, a positive earnings surprise—such as strong delivery numbers or improved guidance—could push the price back toward the upper Bollinger Band near $185.00.
QuantSignals.
Best AI news analysis and signals

BA Weekly Options Trade Plan 2025-04-15NYSE:BA BA Weekly Analysis Summary (2025-04-15)
Below is our synthesis of the various models, followed by our final trade conclusion and details.
──────────────────────────────
Comprehensive Summary of Each Model’s Key Points
• Grok/xAI Report – Technicals on BA show that the price (about $155.52) is below the short‐term (and even daily) moving averages with a 5‑minute RSI well into oversold territory (24.71). – The MACD is negative while Bollinger Bands show price near the lower edge. – Market sentiment (including bearish headlines and high put open interest) supports a view of further downside, despite a touch of potential mean‐reversion. – Recommendation: Buy a naked put at the $150 strike (premium ~$0.88) to play a moderately bearish view.
• Gemini/Google Report – Confirms that on a 5‑minute chart BA is trading below key EMAs and shows strong bearish momentum on MACD. – However, the extremely oversold 5‑minute RSI and the fact that the max pain is at $160 (well above current price) introduce a counter‐signal suggesting a possible bounce. – Conclusion: The directional bias is ambiguous; the risk of entering a short when a bounce may occur makes trade timing uncertain. No clear open‐trade setup is recommended.
• Llama/Meta Report – Also notes that BA’s price is below key short‑term moving averages and that the MACD is on the downside. – But Llama points out that the max pain level at $160 and relatively low call premium (e.g. $162.50 call at $0.54) might offer a speculative play on an upward move. – Recommendation: Buy the $162.50 call as a hedge/speculative play, citing the potential for a rally toward the max pain.
• DeepSeek Report – Reiterates the technical picture: BA is trading below its key MAs, the 5‑minute RSI is oversold, and there is strong bearish open interest in puts (notably at the $150 strike). – Their analysis supports a moderately bearish outlook despite the risk of a short‐term bounce. – Recommendation: Buy the $150 July (weekly) put at $0.88, with exit triggers set if BA regains short‑term resistance.
────────────────────────────── 2. Areas of Agreement and Disagreement
• Agreement: – All models agree that BA is trading below key short‑term moving averages and that the 5‑minute technicals (including an extremely low RSI and negative MACD) point to bearish momentum. – There is consensus that options data (with max pain at $160 and strong put open interest at $150) provides key reference points.
• Disagreement: – While Grok and DeepSeek lean into a bearish trade via the $150 put, Gemini highlights conflicting signals (oversold RSI versus bearish momentum) and recommends caution at the open. – Llama instead sees potential for a bounce upward towards max pain and recommends a call trade. – The conflict centers on whether the oversold condition could force a short-term bounce (favoring calls or no trade) versus the prevailing bearish trend (favoring puts).
────────────────────────────── 3. Clear Conclusion
Overall Market Direction Consensus: The majority of the analyses show that while BA has an oversold 5‑minute RSI hinting at a possible short-term bounce, the price action below key EMAs, the negative MACD, bearish news, and heavy put open interest largely indicate a moderately bearish outlook. The ambiguity in the immediate open (as noted by Gemini) is acknowledged, but overall the consensus leans toward further downside pressure.
Recommended Trade: Since we must trade single‑leg, naked options on weekly expiries and we choose one of the provided strikes/prices, we favor the moderately bearish stance. Hence our recommendation is to buy a naked put option.
Trade Parameters: • Instrument: BA • Trade: Buy weekly puts • Strike: $150.00 • Premium: $0.88 (as shown in the current options data) • Expiration: 2025‑04‑17 • Entry Timing: At open • Rationale: This put offers a bearish play that earns from continued downside momentum, even if there is a brief bounce. Liquidity is supported through high open interest and volume at this strike. • Confidence Level: Approximately 65% • Risk/Reward Guidelines: A target exit is set for a roughly 50% profit on the premium (aiming for an option price near $1.32), while a stop‐loss is triggered if BA recovers and breaches key short‑term resistance (around the $156 range) – roughly limiting losses to 50% of the premium.
Key Risks and Considerations: – There is a risk that the oversold condition (RSI at 24.71) could spark a swift bounce, forcing the trade into near‐term losses. – The max pain level at $160 could create upward pressure as expiration nears. – Volatility as indicated by the VIX (30.12) remains elevated, so sudden price swings are possible. – Traders should carefully size positions (not more than 2–3% of account capital) and defend profit targets and stops to limit risk.
────────────────────────────── 4. TRADE_DETAILS (JSON Format)
{ "instrument": "BA", "direction": "put", "strike": 150.0, "expiry": "2025-04-17", "confidence": 0.65, "profit_target": 1.32, "stop_loss": 0.44, "size": 1, "entry_price": 0.88, "entry_timing": "open" }
Disclaimer: This newsletter is not trading or investment advice but for general informational purposes only. This newsletter represents my personal opinions based on proprietary research which I am sharing publicly as my personal blog. Futures, stocks, and options trading of any kind involves a lot of risk. No guarantee of any profit whatsoever is made. In fact, you may lose everything you have. So be very careful. I guarantee no profit whatsoever, You assume the entire cost and risk of any trading or investing activities you choose to undertake. You are solely responsible for making your own investment decisions. Owners/authors of this newsletter, its representatives, its principals, its moderators, and its members, are NOT registered as securities broker-dealers or investment advisors either with the U.S. Securities and Exchange Commission, CFTC, or with any other securities/regulatory authority. Consult with a registered investment advisor, broker-dealer, and/or financial advisor. By reading and using this newsletter or any of my publications, you are agreeing to these terms. Any screenshots used here are courtesy of TradingView. I am just an end user with no affiliations with them. Information and quotes shared in this blog can be 100% wrong. Markets are risky and can go to 0 at any time. Furthermore, you will not share or copy any content in this blog as it is the authors' IP. By reading this blog, you accept these terms of conditions and acknowledge I am sharing this blog as my personal trading journal, nothing more.

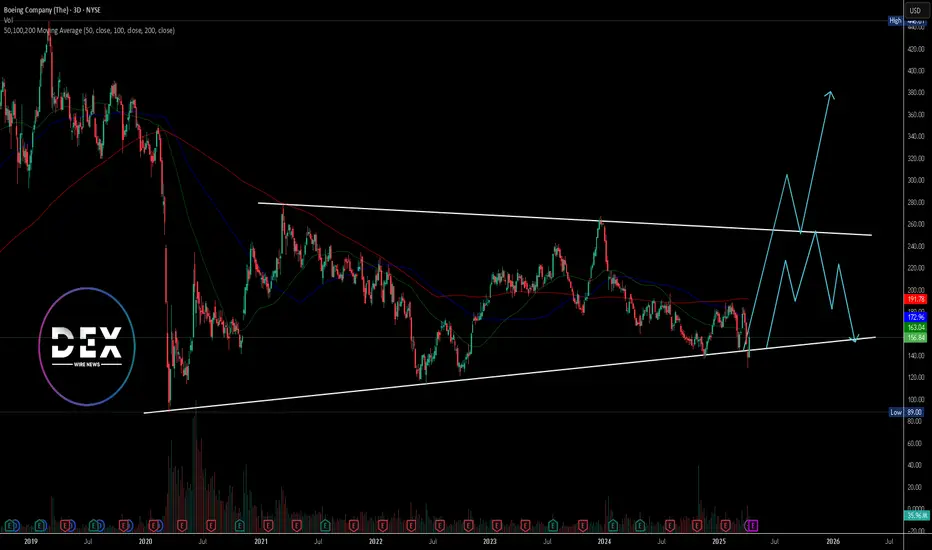
Boeing ($BA) Faces Renewed Scrutiny After Latest Safety ConcernsBoeing (NYSE: NYSE:BA ) stock closed at $156.84 on April 11, gaining 0.85% despite fresh concerns surrounding delayed aircraft deliveries. China's Juneyao Airlines recently postponed the delivery of a 787-9 Dreamliner, originally valued at $120 million. The decision comes amid renewed U.S.-China trade tensions driven by tariff escalations from President Trump’s administration.
This delay could disrupt Juneyao’s planned expansion into European routes this summer. The Dreamliner, known for its long-range capabilities, was central to these international plans. The incident signals how geopolitical strain continues to impact global aviation and commercial aircraft deals.
Boeing has already cautioned that additional tariffs may put more pressure on supply chains. These chains had only recently begun to stabilize following years of pandemic-related disruptions. The company remains exposed to evolving international policies, which can affect order fulfillment and investor sentiment.
Earnings for Boeing are expected on April 23, 2025. Investors are watching closely for guidance on production capacity, deliveries, and any fallout from global trade developments.
Technical Analysis
Boeing is trading within a broad wedge pattern marked by long-term support and resistance trendlines. Price recently bounced from the support, rising sharply to the current level of $156.84. The 50, 100, and 200-day moving averages sit at $163.04, $172.96, and $191.78 respectively.
These levels now act as dynamic resistance. Price remains below all three, signaling overall bearish pressure unless a breakout occurs. A breakout above the resistance trendline may lead to a rally. However, if price fails to gain momentum and breaks below the lower trendline, it could revisit the $89 low from 2020.