BRITANNIA – Weekly Rounding Bottom | Strength Building🟦 BRITANNIA – Weekly Rounding Bottom | Strength Building
Britannia Industries is forming a rounding bottom on the weekly chart, along with box-structure consolidation.
A pattern within a pattern often signals strong upside once breakout happens.
💰 Trade / Positional Plan
• CMP: ₹5980
• Stop Loss: ₹5298
🎯 Targets
• ₹6917
• ₹8088 (pattern projection)
📊 Technical View
• Weekly rounding bottom formation
• Box consolidation → absorption phase
• FMCG sector near 200-WMA (historically strong support unless extreme panic like COVID)
• Leaders bounce first – “strong gets stronger” setup
• Volatility likely till global cues stabilize
📌 Trading Approach
• Patience trade – avoid hurry
• Prefer staggered entry
• Strict position sizing control
• Expect short-term volatility
⚠️ Clarification:
This is an independent analysis. No part of Religare is involved in this view or recommendation.
📝 Important:
I am not responsible for any loss or profit incurred. No fees charged – shared for educational and informational purposes only.
📉 Disclaimer:
Not SEBI-registered. Please do your own research or consult a financial advisor before taking any investment decision.
✅ Leadership + structure = opportunity. Patience is the edge.
BOX

XAUUSD WXAUUSD is in an uptrend and may retest the marked area. After that, the trend is likely to continue. Key levels are important to monitor to see how the market reacts from this point.

FireHoseReel | TOTAL3 Consolidation Signals the Next Market Move🔥 Welcome To FireHoseReel !
Let’s dive into Crypto Total Market Cap Excluding BTC & ETH (TOTAL3) analysis.
👀 TOTAL3 4H Overview
TOTAL3 is currently moving inside a 4-hour range, and the top 10 coins in the market are also consolidating within this box. From a pure supply–demand perspective, a breakdown below the range low could apply further downside pressure to this index and trigger broader weakness across the top 10 coins.
✍️ TOTAL3 Trading Scenarios
🟢 Long Scenario:
A breakout above $900B can act as an alert zone for the first bullish wave in the market. Setting an alert around this level allows you to stay engaged if upside momentum starts for top-tier assets.
🔴 Short Scenario:
A breakdown below the range low could increase selling pressure across the market, leading to stronger capital outflows from the top 10 coins.
🧠 Protect your capital first. No setup is worth blowing your account. If risk isn’t controlled, profit means nothing. Trade with rules, not emotions.

BTC 1D: watching 64–73k box for Nov 25–26 FED weekBearish channel intact unless 80k is reclaimed. Map, not signal.
Key idea: the bearish channel guides price into 64–73k. If we drift there by Nov 25–26, FED could trigger the next major move.
Not advice: I act only if price respects the box and vol/volume confirm. Until then this is a roadmap, not a signal.
Which side of 64–73k breaks first?

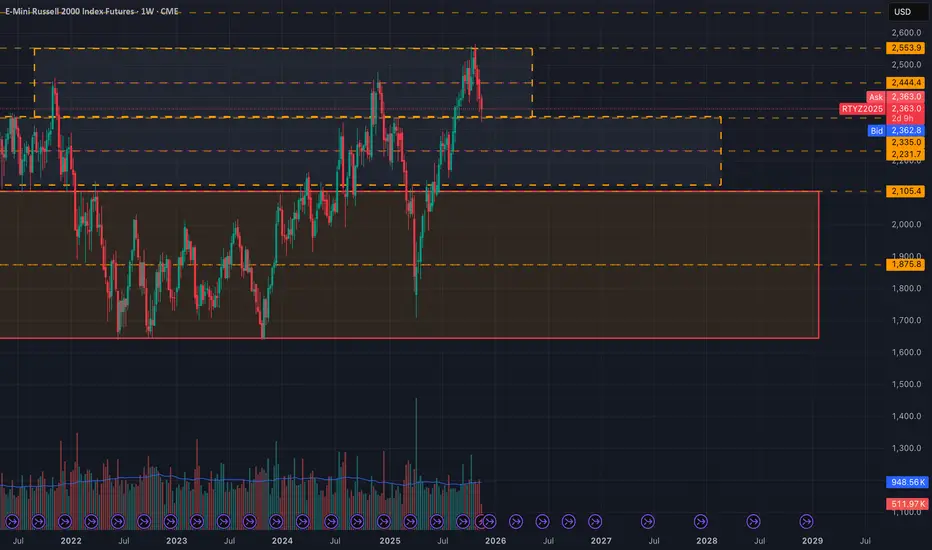
RTY Box LevelsI've taken some time to chart the Russell 200, and I have to say the box is looking quite excellent.
Nice and clean levels, makes a fella wanna put a bid in.
I am not used to trading this name(literally traded it the first time on Monday), but it seems like a good time so far.
I'll be on the look out for LBAFs and LAAFs, no directional bias just trading what is seen atm.
If a look below and fail occurs and is sustained at the upper box, then it is objectively a long (especially if we trade lower first w/a failure to go lower), otherwise if we trade through the level w/ continuation or trade higher first and fail, then a LAAF would take us within the middle box's range.
Trading higher first and failing is more bearish than trading lower first.
Trading lower first and failing to go lower is more bullish than trading higher first.
I like to keep these concepts in mind as I wait for the opening and initial balance ranges to form intraday, and from there, I can form an opinion and initiate a trade.
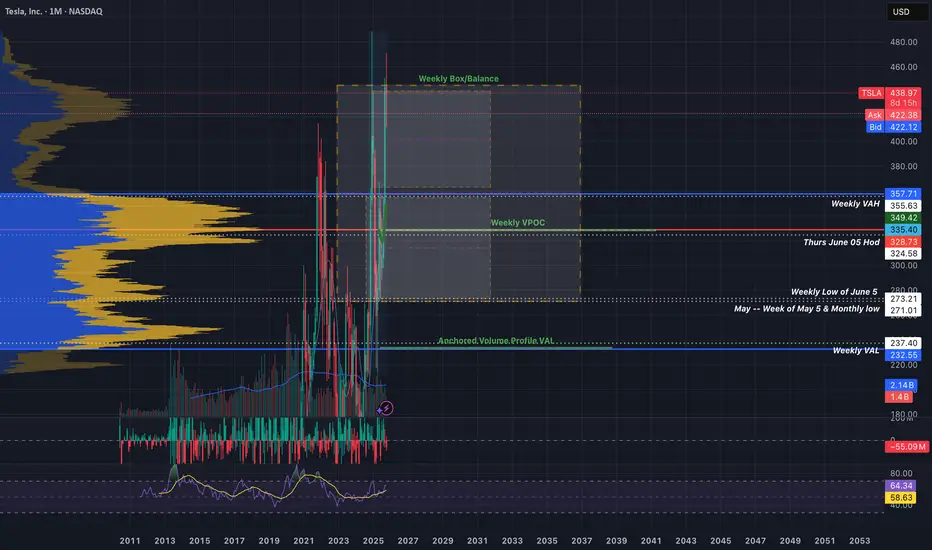
Tsla - Box is Box?I have what seems like a thousand tesla charts now...and they are all telling me tesla needs to have a seat soon.
Tesla has been consolidating on the daily timeframe for quite a while now.
What happens if we continue to see presistent failures at the top of box or a look above and fail on the weekly? I'd put my money on a return to value.
At some point, tesla should revert back to the mean and I will be there waiting to LEAP at the opportunity(get it?).
I would love tesla around the weekly volume point of control around $245 area (this may shift as the days go by). If tesla retests the weekly value area high around $314 and is rejected then we may take a trip down to VPOC town.
Granted, for any of this to happen, we would need technicals to cooperate, meaning a LAAF of box and failure to hold the midpoint($384ish), as well as a turn in sentiment.
This could happen this fall or next march, who knows, but I'll be there when it does.
~The Villain
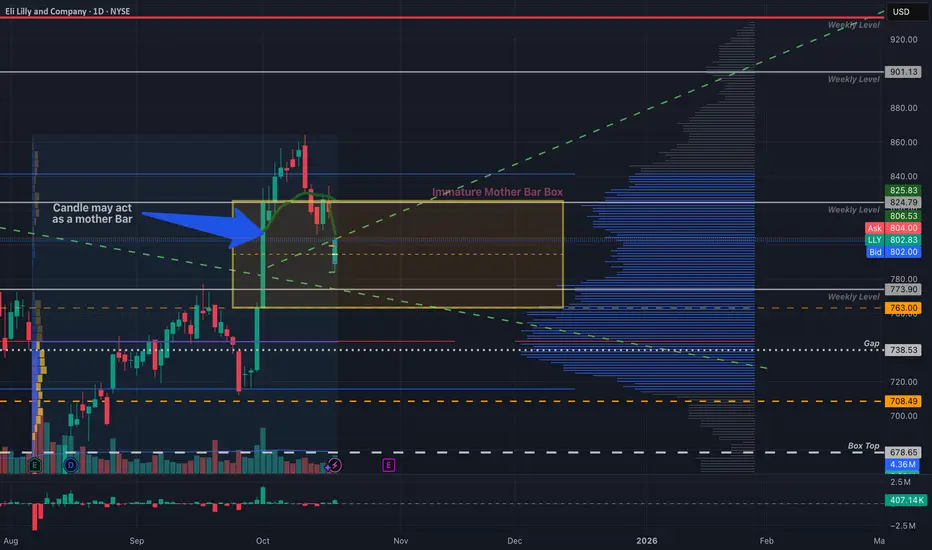
LLY - Beware the MotherbarTaking a closer look at the Eli Lilly chart and noticed that there is a box setup forming on the daily time frame. Specifically this box is the product of a mother bar.
If you take a look the last 4 daily candles have more or less traded within the body of the XXL green candle on the left.
I would be mindful of this mother bar/box in the coming week. Don't get too bulllish at the top or two bearish at the bottom.
I suggest also taking a look at SPY's chart as there is a similar pattern forming, albeit a much more defined motherbar.
A look above and fail of $824 could make a great short, or a look below and fail of $763(A+) or $773(B+) is a great long.
The trendline also sits near that low so if the LBAF plays out that is another supporting confluence for this trade.
Plug - Hear me outProposing a trade on a shit-co like plug may earn some laughs but hear me out for a second.
In the right light and with enough alcohol, she could pass for a strong six. I'd do her.
Jokes, aside, due to the frantic rush to solve AI datacenter energy problem, power companies have been getting a lot of play lately, some have real growth potential, while others may be the speculative dream of degenerates like myself.
A 25 year old company, about to hit the figurative wall (DiCapiro joke...slaps knee), has suddenly seen an influx of buying activity and what looks to be increasing volume following a look below and fail of a weekly box.
According to box rules, I can't ignore this trade. Plug has been in an area of consolidation for years. It's completed atleast two look above and look below and fails of the larger boxed range.
I'm not saying that this stock is going to the moon, but if It can reclaim the top of the mini weekly box and hold the midpoint of the larger box then $8 seems like a realistic target to me.
Now, this stock would easily revert back to the volume point of control (VPOC) around $2 or lbaf again or simply fail miserably below the boxes...then all you degens will be living in boxes.
If we do see 2.50 - $2 again, I'd love to take an entry there (a lbaf of vpoc would be nice too). Otherwise, I'll be monitor this name for the mentioned trades.
My posts are for shits and giggles. I'm just a guy with an interest and a celcius addiction.
~The Villain

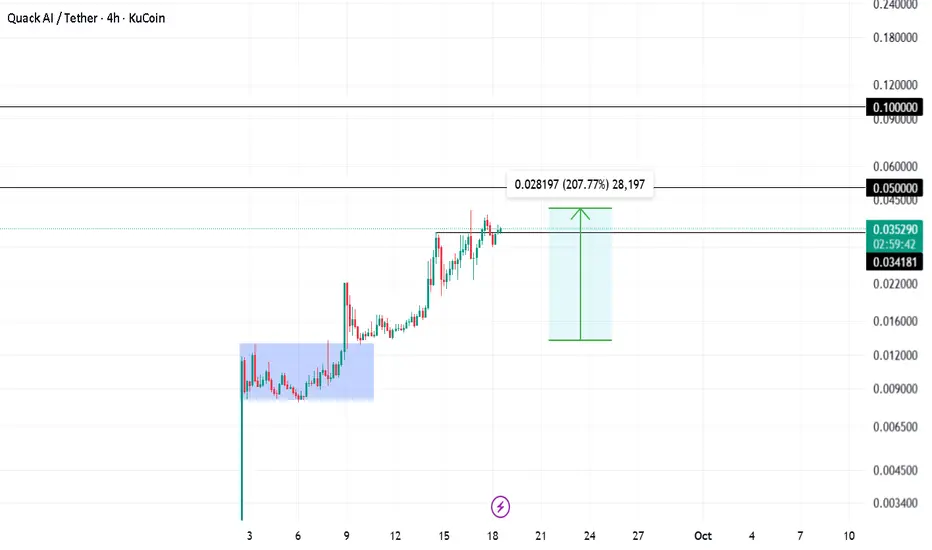
Q Pumped 207% Shared insights on Q trade a while ago. Been holding the trade for a while now and made easy 2x till now.
Hodling for 0.05 and 0.1 targets
Stop loss trailed!
Yes the chicken man - PPC Short?PPC is at the bottom of a monthly box and at VAL of the daily and weekly anchored volume profile. It could catch a bid here and retest $45.60s(VPOC).
If the retest ends in a rejection of that area, and a daily close below the previous low around $41.95 then I expect short continuation and validation of the H&S.
I would especially like this trade after a retest and rejection of box bottom around $43.41 - $43.30.
My targets would be 40.11, 38.98, 37.27,35.96 then 33.72.

ETH 4H Analysis – Key Triggers Ahead | Day 7💀 Hey , how's it going ? Come over here — Satoshi got something for you !
⏰ We’re analyzing ETH on the 4-hour timeframe timeframe .
🔭 In the 4-hour timeframe of Ethereum, we can see that after registering its all-time high, Ethereum was rejected downwards and then took support from the $4,273 area and moved upwards. We need to see how valid this support can remain in the new week. There is also an important resistance at the $4,515 area, and breaking this level could end Ethereum’s corrective trend.
⛏ The key RSI areas are 35 and 58. If the fluctuation passes these levels, Ethereum could enter a new phase of volatility and eventually start its movement.
💰 The size and number of red candles have almost decreased, and with increasing volume and larger candle sizes, Ethereum can start a good trend. Keep in mind that today is a holiday, so not much volume enters the market. On the other hand, there are rumors on Twitter about the death of Donald Trump, which could also prevent an increase in volume.
🪙 In the 4-hour timeframe of the ETHBTC index , we can see that this index broke its box at the 0.03946 area and registered an all-time high for Ethereum against Tether pair. Then it was rejected from this area and showed two rebound reactions at the 0.03946 support, which is the broken box top. With a breakout of the highlighted areas in this index analysis, both Bitcoin and Ethereum could see more liquidity, and this directly affects the ETH/USDT pair.
🔔 The alarm zones that can be considered for Ethereum in this timeframe are the $4,273 and $4,514 areas. The price action in these areas can be of high value, and with increasing volume, they could give us either a short or long trade opportunity.
❤️ Disclaimer : This analysis is purely based on my personal opinion and I only trade if the stated triggers are activated .

BTC 1H Analysis – Key Triggers Ahead | Day 25💀 Hey , how's it going ? Come over here — Satoshi got something for you !
⏰ We’re analyzing BTC on the 1-hour timeframe timeframe .
👀 On the 1H timeframe for Bitcoin, we can observe that BTC is ranging inside a box with a top around $113,000 and a bottom around $109,100. With a breakout from either side of the box, Bitcoin can experience a sharp and parabolic move.
⚙️ The key RSI zones are 70 and 45, and once the oscillation surpasses these levels, Bitcoin can experience a solid move with an increase in trading activity.
🕯 The size and volume of green candles are increasing, the underlying trend of the market is bullish, and we are at an important zone. With rising buying volume and larger green candles, Bitcoin could break out of the top of the box and move upward toward resistance levels.
📊 On the 1H timeframe for USDT.Dominance we can observe that Tether Dominance is slowly losing weight in the market after dropping below the 4.35% zone.
At the same time, Bitcoin.Dominance is also declining . This means that altcoins are providing more profit than Bitcoin .
🔔 The zones we have selected as alert zones are $113,200 and $109,000. By monitoring price behavior and recognizing breakouts, we can open our positions accordingly .
❤️ Disclaimer : This analysis is purely based on my personal opinion and I only trade if the stated triggers are activated .

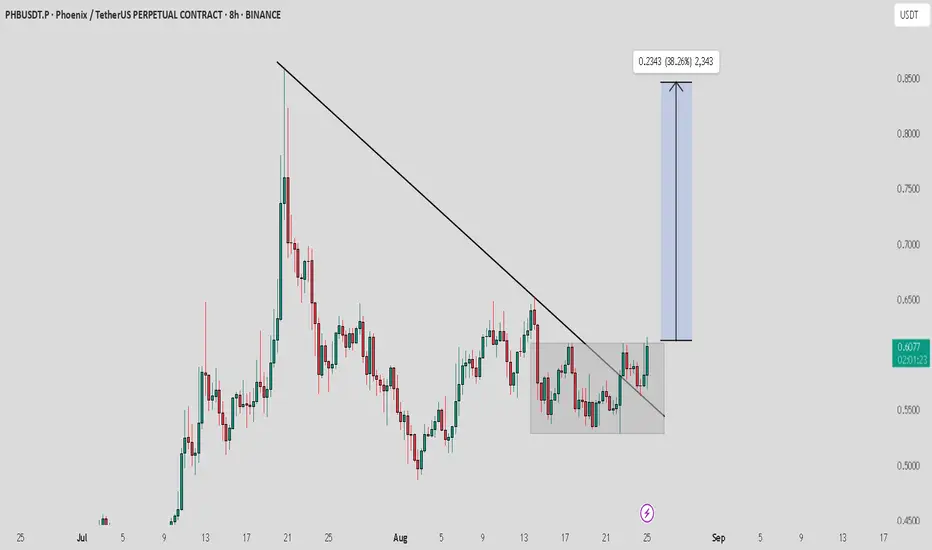
PHB / USDT : Looking bullish..Waiting for box breakoutPHB/USDT has broken above its trendline resistance after a period of consolidation. This breakout is showing strong potential, and if momentum sustains, price could rally toward the $0.80–0.85 zone.
Best approach: Wait for confirmation on retest or a strong bullish candle with volume before entering to avoid fake breakouts. Always manage risk properly.
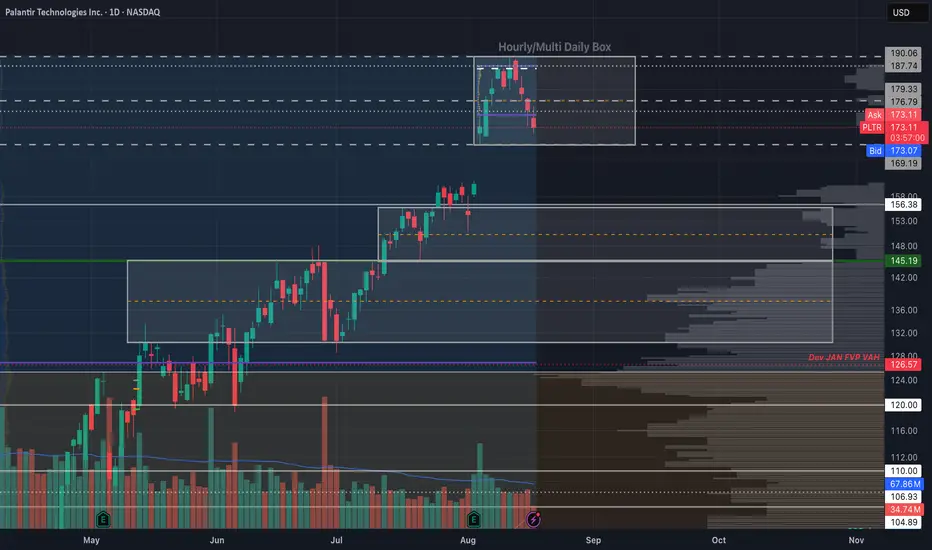
Palantir - The Box Calls The ShotsI recently posted a palatir chart with clean levels of where I'd look to DCA. While those dip-buy levels can easily be used to trade the name, I think it would also help to be mindful of the box ranges as we trade into them. As you'll see, Palantir loves to play with box as much as I do.
If you are familiar with how to trade box set-ups, you can take advantage immediately; otherwise, you may want to do some research on how to trade these.
~The Villain
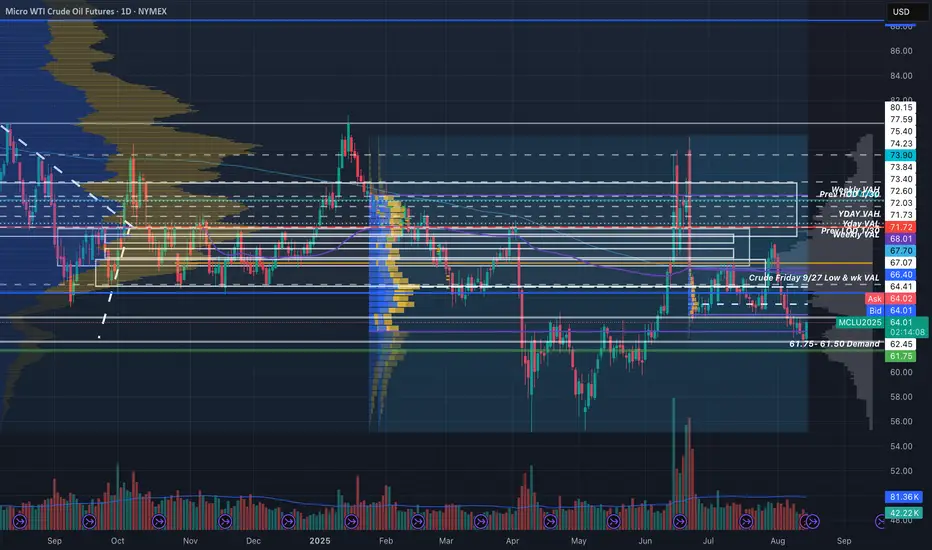
Crude Levels (Non-Updated but still reactive)Just wanted to share my crude levels. Drew alot of these months ago and haven't adjusted alot of them...especially the boxes but general areas identified still seem to be reactive.
~The Villain
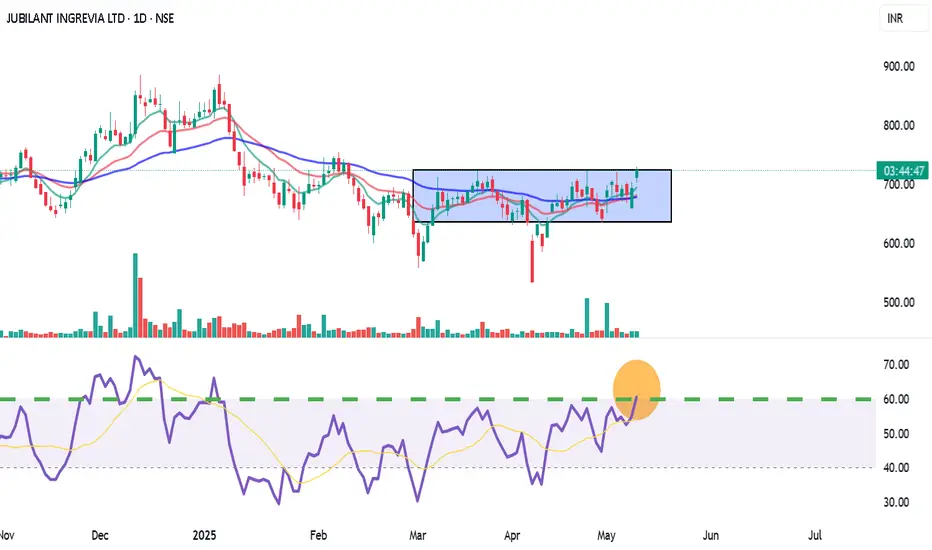
Jubilant Ingrevia (JUBLINGREA) – Short-Term Breakout Trade LTP: ₹726.30 | Recommended Entry: ₹722.00 – ₹723.00
Type: Short-Term Swing / Intraday MTF Trade
✅ Trade Setup:
Breakout above horizontal resistance near ₹725.75
9 EMA has crossed 26 EMA (bullish momentum)
RSI at 60.84 – strong trend, room for upside
BB %B: 0.96 – price pushing upper band = momentum buying
Good volume breakout on daily TF confirms buying interest
🟢 Buy Zone: ₹722 – ₹723
🔁 On retest or 15-min candle close above ₹725.75 with volume
🎯 Targets:
T1: ₹738
T2: ₹750 (supply zone / fib level)
T3: ₹765+ (if breakout sustains in 1H)
🛑 Stop Loss:
Conservative SL: ₹707 (below support + 9EMA)
Aggressive SL: ₹712 (tight SL for intraday)
For Education Purposes Only
Enterprise Products Partners L.P. 5 Day Long Swing IdeaI found a good stock, and I shared my target profit and stop loss in the video. Also, I shared the screener I use alongside in a kangaroo market.

EIGEN - Box is brokenBINANCE:EIGENUSDT (1h CHART) Technical Analysis Update
EIGEN is currently trading at $3.578 and showing overall bullish sentiment sentiment
Price was trading inside the box for couple days and expecting to breakout from the box soon. There is a good potential for long trade here.
Entry level: Candle close above $3.68
Stop Loss Level: $ Below 3.204
TakeProfit 1: $3.875
TakeProfit 2: $ 4.180
TakeProfit 3: $ 4.592
TakeProfit 4: $ 5.035
TakeProfit 5: $ 5.612
Max Leverage: 5x
Position Size: 1% of capital
Remember to set your stop loss.
Follow our TradingView account for more technical analysis updates. | Like, share, and comment your thoughts.
Cheers
GreenCrypto

MRPL - 45% down from its topOne of the follower has requested for the analyses of MRPL, hence publishing it, may be it would benefit remaining followers.
All details are given on chart. If you like the analyses please do share it with your friends, like and follow me for more such interesting charts.
Disc - Am not a SEBI registered analyst. Please do your own analyses before taking position. Details provided on chart is only for educational purposes and not a trading recommendation

Box (BOX) AnalysisCompany Overview: Box has successfully transitioned from its roots in enterprise storage to becoming a leader in cloud content management and automation. The company’s strategic focus on automation, evidenced by recent acquisitions such as Crooze (automation tools) and Alphamoon (intelligent document processing), has positioned it to capitalize on the growing demand for streamlined workflows and smarter document management in the cloud.
Key Catalysts:
Shift Towards Automation: Box’s move to expand its automation capabilities through strategic acquisitions underscores its commitment to enhancing cloud content management solutions. This shift is likely to drive increased customer adoption as companies seek to automate document-heavy processes and optimize workflows.
Margin Expansion & Buyback Program: Box is trading at around 20 times this year’s adjusted EPS estimates, offering strong growth potential driven by margin expansion. Additionally, the company’s board recently authorized a $100 million share repurchase program, reflecting confidence in Box’s growth trajectory and ability to return value to shareholders.
Strategic Growth: Box continues to innovate in cloud content management and automation, which positions it well to capture a larger market share as organizations increasingly prioritize cloud-based and automated solutions.
Investment Outlook: Bullish Outlook: We are bullish on NYSE:BOX if it holds above the $28.00-$29.00 range. Upside Potential: The upside target for BOX is set at $44.00-$45.00, fueled by its strategic focus on automation, margin expansion, and strong buyback activity.
📦 Box—driving the future of cloud automation! #BoxCloud #AutomationRevolution 🚀📈

CRWD potential pop?Reclaiming 260 and breaking 263.40 I like it long possibly back to 300. Closing below 257.00 more lows on 24HR timeframe

SPY 545 retestSPY 545.00 floor needs to hold if not we go below 540.00 possibly.
If it does hold I think we bounce hard and see ATH.

SPY ABOVE 564.00 ATH?SPY on 4HR still in range but closing outside of 564.00 we will see ATH. I think we can see 170.
