Market Structure 101: Navigating Price ActionMost traders jump directly into indicators, oscillators, or patterns. Yet every chart has a deeper foundation that determines direction long before any tool is applied. Market structure is that foundation. When you understand how price forms highs, lows, and transitions between them, you stop reacting to noise and start reading the market’s intent. It is the base layer that allows you to build a clear, consistent bias.
Price moves because buyers and sellers interact around key levels. Structure highlights where momentum strengthens, weakens, or reverses. By tracking how highs and lows evolve, you can identify trend, consolidation, and shifts in direction with far more clarity than any indicator can offer. Market structure is objective. It gives you a rule-based lens to interpret movement across all timeframes.
Understanding Highs and Lows
There are four structural components every trader must recognize.
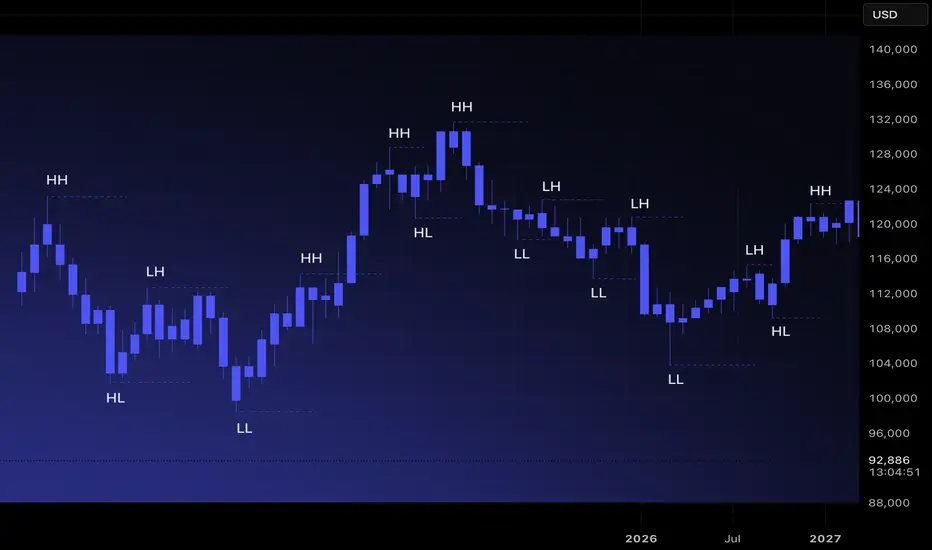
Higher High (HH): Price breaks above a previous high, showing buyers in control.
Higher Low (HL): Price pulls back but stays above the prior low, confirming trend continuation.
Lower High (LH): Price rallies but fails to reach previous highs, indicating weakening demand.
Lower Low (LL): Price breaks below the previous low, signaling sellers taking control.
These sequences are the building blocks of trend identification. When mapped correctly, they remove guesswork and reveal underlying momentum.
Identifying Uptrends and Downtrends
Uptrend: A sequence of HHs and HLs. Buyers consistently push price higher and defend higher floors.
Downtrend: A sequence of LHs and LLs. Sellers control direction, rejecting higher prices and driving the market downward.
A trend remains intact until structure breaks. This is why experienced traders avoid predicting reversals and instead follow structural evidence. When the market prints new HHs and HLs, the bias remains long. When LLs and LHs appear, the bias rotates short.
Ranges and Consolidation
Markets do not trend all day. Much of the time, they move sideways. A range occurs when highs and lows stay relatively equal, creating a horizontal zone with equal highs and equal lows. This is where compression happens. Liquidity builds above the range highs and below the range lows, and trend often resumes only after one side of the range is taken.
In ranges, structure becomes neutral. Bias is formed only when price breaks out and retests with confirmation.
Break of Structure(BOS) and Trend Shift
A break of structure occurs when the market violates the pattern of the existing trend. In an uptrend, a break occurs when price prints an LL. In a downtrend, a break occurs when price forms an HH. This signals a potential shift in momentum.
Breaks of structure matter because they identify turning points without relying on subjective signals. They show where one side loses control and the other gains traction. They also create clear invalidation points for risk management.
How to Read Structure Across Timeframes
Market structure becomes even stronger when used across multiple timeframes. The higher timeframe sets the primary bias. The lower timeframe provides entry precision.
Weekly or Daily: Structural trend and major zones.
4H or 1H: Execution windows and key shifts.
15m and 5m: Entry confirmation.
When all levels of structure align, the probability of a clean move increases significantly.
Avoiding Common Mistakes
Many traders misread structure by focusing on every small fluctuation. Structure is defined by meaningful swings, not micro noise. Another common error is assuming a single HH or LL immediately reverses a trend. Context matters. Breaks followed by continuation and retests confirm the shift. A disciplined trader waits for structure to become clear instead of acting on isolated candles.
Turning Structure Into a Bias
Structure simplifies decision-making.
If the market is printing HH and HL formations, you prioritize longs.
If it is printing LH and LL formations, you seek shorts.
If highs and lows are equal, you wait for a breakout.
Breakofstructure
Break of Structure (BoS): When the Trend Announces Itself“Structure is the language of the market. Learn it, and price speaks to you.”
Every trader looks at charts hoping for clues — and structure is the clearest one.
A Break of Structure (BoS) is a simple but powerful concept: it shows when the market confirms a continuation of the trend.
What is BoS?
When price breaks a previous high in an uptrend → confirms bullish continuation.
When price breaks a previous low in a downtrend → confirms bearish continuation.
BoS is different from ChoCH:
ChoCH signals potential reversal .
BoS signals trend continuation .
How to Spot BoS
Identify the key swing highs and lows.
Wait for price to decisively break them.
Confirm the break on the timeframe aligned with your bias (e.g., H4 for trend, M15 for setups).
Practical Tip
A BoS on M15 aligned with H4 bias is often where setups start forming.
Never assume a break is real without observing structure alignment and volume/confirmation.
Price doesn’t lie. Structure doesn’t cheat.
Once you see the break, the market has announced its intentions.
📘 Shared by @ChartIsMirror
If this resonated, comment below — which part of structure analysis should I break down next?

Break of Structure VS Liquidity Grab. How to Identify Valid BoS
The main problem with break of structure trading is that you can easily confuse that with a liquidity grab.
But don't worry.
There is a secret SMC price model that will help you to confirm a break of structure in a second.
Learn smart money concepts trading secrets and a simple strategy to trade break of structure on any forex pair.
Let's study a break of structure that I spotted on AUDUSD forex pair.
We see that the market is bullish on a daily time frame and the price has just violated a previous high with a break of structure.
The issue with that is the fact that such a violation can easily be a liquidity grab and a bullish trap .
Buying the market immediately after a BoS, we can incur a huge loss .
We need something that would help us to accurate validate that.
Fortunately, there is a simple price model in SMC that will help.
After you spotted a break of structure on a daily time frame,
use a 4h time frame for its validation.
After a BoS on a daily time frame, the market usually starts retracing , setting a new local high.
To confirm that it is not a trap, you will need a break of THAT structure on a 4H time frame.
It will increase the probabilities that the entire bullish movement that you see on a daily is not a manipulation.
Here is what exactly we need.
After the price violated a daily structure and closed above that, we see a minor intraday retracement on a 4h time frame.
A bullish violation of the last high there is our BoS confirmation and a clear indicator of the strength of the buyers.
You can execute a buy trade, following a simple strategy then.
Set a buy limit order on a retest of a broken high on a 4H,
a stop loss should be below the last higher low,
a take profit is based on the next supply zone on a daily.
To avoid the traps, a single time frame is not enough for profitable trading break of structure.
Learn to integrate multiple time frames in smart money concepts trading. It will help you make thousands of pips weekly.
❤️Please, support my work with like, thank you!❤️
I am part of Trade Nation's Influencer program and receive a monthly fee for using their TradingView charts in my analysis.
What Is a Change of Character (CHoCH) and How Can You Trade It?What Is a Change of Character (CHoCH) and How Can You Trade It?
Navigating the nuances of Smart Money Concept (SMC) trading requires a keen understanding of market signals like the Change of Character (CHoCH). This concept can help traders detect and react to potential trend reversals. Today, we’ll delve into the mechanics of CHoCHs, explaining how they manifest in different market conditions and how they can be strategically leveraged for trading decisions.
Understanding Breaks of Structure
Understanding Breaks of Structure (BOS) is essential for traders before delving into concepts like Change of Character (CHoCH). A BOS in trading signifies a continuation within the current trend and is marked by a clear deviation from established swing points that indicate previous highs and lows.
In the context of an uptrend, a BOS is identified when the price exceeds a previous high without moving below the most recent higher low. This action confirms that the upward momentum is still strong and likely to continue as buyers push the market to new heights.
Similarly, in a downtrend, a BOS occurs when prices drop below a previous low without breaking the prior lower high, suggesting that sellers remain in control and the downward trend is set to persist.
By recognising these points where the market extends beyond its former bounds, traders can confirm that the current trend is robust and act accordingly. This foundational concept of BOS not only helps in assessing trend strength but also sets the stage for understanding more complex patterns like CHoCH, where the focus shifts from trend continuation to potential trend reversals.
CHoCH Trading Meaning
In trading, a Change of Character (CHoCH) signals a potential shift in market dynamics, often indicating a reversal from the prevailing trend. This concept is particularly valuable as it helps traders discern when the momentum is shifting, offering a strategic point to consider adjusting their positions.
A CHoCH occurs when there's a noticeable deviation in the market's price trend. For example, in a bullish trend characterised by a series of higher highs and higher lows, a CHoCH is indicated by the price failing to set a new high and subsequently falling below a recent higher low. This suggests that buyers are losing control, and a bearish trend could be emerging.
Similarly, during a bearish trend marked by lower highs and lower lows, a bullish CHoCH would occur if the price unexpectedly breaks above a recent lower high. This break indicates that sellers are losing their grip, and a bullish trend may be starting.
The Significance of CHoCHs Across Timeframes
The fractal nature of financial markets means that patterns and behaviours recur across various timeframes, each providing unique insights and implications for trading. Understanding CHoCHs in different timeframes is crucial for traders to effectively align their strategies with both short-term opportunities and long-term trend shifts.
In intraday trading, where decisions are made on lower timeframes (like minutes or hours), a CHoCH can signal a possible short-term trend reversal. For example, if a currency pair in a downtrend on a 15-minute chart suddenly posts a higher high, this could indicate a weakening of the bearish momentum, suggesting a potential bullish reversal.
Traders might use this information to close short positions or to consider a long position, capitalising on the emerging upward trend. These short-term CHoCHs allow traders to respond quickly to market changes, potentially securing returns before larger market shifts occur.
Conversely, CHoCHs observed on higher timeframes, such as daily or weekly charts, are particularly significant because they can indicate a shift in the broader market trend that might last days, weeks, or even months. Such changes can then be used by both long and short-term traders to adjust their positioning and directional bias.
How to Identify a CHoCH
The initial step to identify a CHoCH in trading involves clearly defining the existing trend on a specific timeframe. This is done by marking the significant swing highs and lows that delineate the trend's progress. These points should represent somewhat meaningful retracements in the price, providing clear markers of trend continuity or potential reversal points.
According to the Smart Money Concept (SMC) theory, the integrity of an uptrend is maintained as long as the price does not trade through the most recent significant higher low. Conversely, a downtrend is considered intact if the price does not surpass the most recent significant lower high. Therefore, traders focus their attention on these critical points.
To identify a CHoCH, traders watch for a break in these crucial high or low points. For instance, in an uptrend, a bearish CHoCH is indicated when the price achieves a higher high but then reverses to descend below the previous significant higher low.
Similarly, in a downtrend, a bullish CHoCH occurs when the price drops to a lower low before reversing to break above the previous significant lower high, setting a new high. Both types of breaks signal a potential reversal in the trend direction.
How to Trade a CHoCH
When trading a CHoCH, it’s essential to recognise that it should be integrated with other aspects of the SMC framework to get the best results. This includes the use of order blocks and imbalances, which are key components in identifying potential reversals.
Order Blocks and Imbalances
An order block is essentially a substantial consolidation area where significant buying or selling has occurred, and prices often revisit these zones before reversing. These blocks can be seen as levels where institutional orders were previously concentrated.
An imbalance, also known as a fair value gap, occurs when the price moves sharply up or down, leaving a zone that has not been traded extensively. Price often returns to these gaps to 'fill' them, establishing equilibrium before a potential reversal happens.
In practice, traders can look for a sequence where the price first approaches an order block and begins to fill any existing imbalances. This setup increases confidence in a potential reversal. As the price meets these criteria and a CHoCH occurs, this indicates that the influence of the order block is likely to initiate a price reversal.
Practical Example on GBP/USD
Consider the 4-hour chart of the GBP/USD pair above. We see the pair encounter an order block on the left, one that’s visible on the daily chart. As the price interacts with this block, it begins to retrace, attempting to fill the imbalance but moves away. Eventually, the price completes the fill of the imbalance and meets the previously established order block.
Switching to a 1-hour timeframe, this scenario unfolds similarly. After reaching the order block on the 4-hour chart, another CHoCH occurs, signalling the start of a new uptrend. This lower timeframe CHoCH, following the meeting of the order block, corroborates the potential for a reversal initiated by the higher timeframe dynamics.
This example illustrates how CHoCHs can be effectively utilised across different timeframes, tying back to the fractal nature of markets discussed earlier. By recognising these patterns and understanding their interaction with order blocks and imbalances, traders can strategically position themselves to capitalise on potential market reversals, aligning their trades with deeper market forces at play.
CHoCH vs Market Structure Shift
A Market Structure Shift (MSS) is a specific type of Change of Character that includes additional signals suggesting a potential trend reversal. Unlike a straightforward CHoCH that typically indicates a trend is shifting but may also be a false break, an MSS can be seen as a higher confluence CHoCH. An MSS occurs after the market first makes a key movement contrary to the established trend—forming a lower high in an uptrend or a higher low in a downtrend—without plotting a higher high or lower low.
Following these preliminary signals, an MSS is confirmed when there is a decisive break through a significant swing point accompanied by a strong displacement (i.e. impulse) move, creating a CHoCH in the process. This sequence not only reflects that the prevailing trend has paused but also that a new trend in the opposite direction is establishing itself.
Due to these additional confirmations, an MSS can offer added confirmation for traders, indicating a stronger likelihood that a new, sustainable trend has begun. This makes the MSS particularly valuable for traders looking for more substantiated signals in their trading strategy.
The Bottom Line
The concept of a CHoCH is instrumental in navigating the complexities of SMC trading. By identifying these crucial market signals, traders may align their strategies to capitalise on market movements efficiently.
FAQs
What Is CHoCH in Trading?
In trading, CHoCH is a technical observation that signifies a change in the trend's character, where the price movement breaks from its established pattern of highs and lows, suggesting a potential reversal or substantial shift in the market's direction.
What Is CHoCH in SMC Trading?
In Smart Money Concept (SMC) trading, a Change of Character (CHoCH) refers to a clear shift in market behaviour that indicates a potential reversal of the prevailing trend. This concept is used by traders to detect early signs of a momentum shift that might lead to significant changes in price direction, enabling strategic adjustments to their trading positions.
What Is a CHoCH in the Market Structure?
A CHoCH in market structure is identified when there is an observable deviation from established price patterns — specifically when new highs or lows contradict the current trend. It signifies that the previous market sentiment is weakening, and a new opposite trend may be starting, prompting traders to reassess their strategies.
How Do You Identify a CHoCH?
Identifying a CHoCH involves monitoring significant swing highs and lows for breaks that are contrary to the existing trend. For instance, in an uptrend, a CHoCH would be indicated by a failure to reach a new high followed by a drop below the recent higher low, suggesting a shift to a bearish outlook.
What Is ChoCH vs BOS in Trading?
While both CHoCH and Break of Structure (BOS) are critical in assessing market dynamics, they serve different purposes. CHoCH indicates a potential trend reversal by highlighting a significant change in the price pattern. In contrast, a BOS indicates a continuation of the current trend by showing the price surpassing previous significant highs or lows, reinforcing the ongoing direction.
This article represents the opinion of the Companies operating under the FXOpen brand only. It is not to be construed as an offer, solicitation, or recommendation with respect to products and services provided by the Companies operating under the FXOpen brand, nor is it to be considered financial advice.

Mitigation Block in Forex Trading: What It Is and How to Use It?What a Mitigation Block Is, and How You Can Use It When Trading Forex?
Understanding specific market mechanisms like mitigation blocks may enhance strategic decision-making. This article delves into the concept of mitigation blocks, detailing their definition, function, and practical application within forex.
Definition and Function of a Mitigation Block
A mitigation block in forex trading refers to a specific order block on a chart that indicates where previous movements have stalled and reversed, marking it as a potential area for future market turns. This concept within the Smart Money framework is crucial for traders looking to manage their positions by taking advantage of strategic entry and exit points.
The idea behind these areas is rooted in the dynamics of supply and demand within forex. When a currency pair reaches a level where buyers or sellers have previously entered the market in force, causing a reversal, it suggests a potential repeat of such actions when the price returns to the area.
Characteristics and How to Identify a Mitigation Block
Mitigation blocks can be bullish or bearish, each with distinct characteristics:
- Bearish Mitigation Block: This type forms during an uptrend and is identified by a significant peak followed by a decline and a failed attempt to reach or surpass the previous high, creating a lower high. When prices drop below the previous low, the order block above the low becomes mitigation. It may be characterised by an increase in selling volume as the price approaches the level, signalling resistance and a potential downward reversal.
- Bullish Mitigation Block: Conversely, a bullish type is established during a downtrend. It is characterised by a significant trough, followed by a rise to form a higher low, and a failure to drop below the previous low. As the pair moves up, the order block below the high marks mitigation one. This area often shows an increase in buying volume as the price approaches, indicating support and a potential upward reversal.
Mitigation Block vs Breaker Block
Mitigation and breaker blocks are both significant in identifying potential trend reversals in forex trading, but they have distinct characteristics that set them apart. A mitigation block forms after a failure swing, which occurs when the market attempts but fails to surpass a previous peak in an uptrend or a previous trough in a downtrend. The pattern indicates a loss of momentum and a potential reversal as the price fails to sustain its previous direction.
On the other hand, a breaker block is characterised by the formation of a new high or low before the market structure is broken, indicating that liquidity has been taken. This means that although the trend initially looked set to continue, it quickly reverses and breaks structure.
In effect, a breaker appears when the market takes liquidity beyond a swing point before reversing the trend. A mitigation appears when the price doesn’t move beyond the trend’s most recent high or low, instead plotting a lower high or higher low before reversing the trend.
How to Use Mitigation Blocks in Trading
Areas of mitigation in trading can be essential tools for identifying potential trend reversals and entry points. When they align with a trader's analysis that anticipates a reversal at a certain level, it can serve as a robust confirmation for entry.
Traders can effectively utilise these zones by simply placing a limit order within the area once it is considered valid. Validation occurs after a new peak or trough is established following the initial failure swing that forms the mitigation area.
If a liquidity void or fair-value gap is present, the trader may look for such a gap to be filled before their limit order is triggered, potentially offering a tighter entry. Stop losses might be placed beyond the failure swing or the most extreme point.
Furthermore, if a mitigation block is identified on a higher timeframe, traders can refine their entry by switching to a lower timeframe. This approach allows for a tighter entry point and potentially better risk management, as it offers more granular insight into the momentum around the area.
Common Mistakes and Limitations
While these blocks are valuable for forex trading, they come with potential pitfalls and limitations that traders should know.
- Overreliance: Relying solely on mitigation blocks without corroborating with other trading indicators can lead to misjudged entries and exits.
- Ignoring Context: Using these zones without considering the broader market conditions may result in trading against a prevailing strong trend.
- Misinterpretation: Incorrect identification can lead to erroneous trading decisions, especially for less experienced traders.
- False Signals: Mitigation blocks can sometimes appear to signal a reversal but instead lead to a continuation of the trend, trapping traders in unfavourable positions.
The Bottom Line
Understanding mitigation blocks offers traders a strategic edge in navigating the forex market. They can be vital for recognising potential price reversals and improving trading outcomes.
FAQs
What Is a Mitigation Block?
A mitigation block in forex trading is an order block that identifies potential reversal points. It signals where a currency pair has previously stalled, indicating strong buying or selling pressure, suggesting a potential for similar reactions in future encounters with these levels.
How Do You Identify a Mitigation Block?
Mitigation blocks are identified by analysing charts for areas where previous highs or lows were not surpassed, leading to a reversal. Traders look for a sequence of movements, including a swing high or low followed by a retracement that fails to exceed the previous swing.
What Is the Difference Between a Breaker Block and a Mitigation Block?
While both indicate potential reversals, a breaker block forms when the price makes a new high or low before reversing, suggesting a temporary continuation of the trend. In contrast, a mitigation block forms without creating a new extreme, indicating a direct loss of momentum and an immediate potential for reversal.
This article represents the opinion of the Companies operating under the FXOpen brand only. It is not to be construed as an offer, solicitation, or recommendation with respect to products and services provided by the Companies operating under the FXOpen brand, nor is it to be considered financial advice.

Market Structure Shift Meaning and Use in ICT TradingMarket Structure Shift Meaning and Use in ICT Trading
In ICT (Inner Circle Trader) trading, understanding Market Structure Shifts (MSS) is crucial for accurately interpreting market trends and making informed trading decisions. This article delves into the significance of MSS, its distinct indicators, and how it integrates with other trading elements like Breaks of Structure and Changes of Character.
Understanding Breaks of Structure and Change of Character
Comprehending the dynamics of Breaks of Structure (BOS) and Change of Character (CHoCH) can be crucial for analysing market trends. A Break of Structure occurs when price levels move beyond established support or resistance areas, indicating a potential continuation or acceleration of the current trend. For example, in an uptrend, a BOS is identified when prices break above a previous resistance level, suggesting further upward movement.
Conversely, a Change of Character signifies a possible shift in the market's direction. This occurs when the price action breaks against the prevailing trend, challenging the recent high or low points that served as market barriers. A CHoCH often raises a red flag about the sustainability of the current trend. For instance, in a sustained uptrend, a CHoCH would be marked by a significant downward breach that violates a previous low point, hinting at a weakening of bullish momentum.
Both BOS and CHoCH are pivotal in the ICT (Inner Circle Trader) methodology, where they are used to gauge market sentiment and potential shifts in trend dynamics. Traders monitor these patterns to adjust their strategies, whether to capitalise on the continuation signalled by a BOS or prepare for a trend reversal suggested by a CHoCH.
What Is a Market Structure Shift?
MSS, meaning a Market Structure Shift, is an indicator of a significant change in the prevailing trend, marked by a series of patterns that suggest a reversal is imminent. An ICT MSS is more than a simple Change of Character (CHoCH); it includes additional signals that strengthen the case for a directional change.
The process begins with a shift in market structure that fails to sustain the ongoing trend. For example, during an uptrend, the market might fail to make a new higher high, instead forming a lower high. This initial deviation raises a caution flag about the trend’s strength.
The confirmation of an MSS in trading occurs when there is a decisive break of a significant swing point, accompanied by a strong impulse move that deeply penetrates through this point, known as a displacement. This displacement is critical—it’s not merely a slight breach but a robust move that clearly indicates a shift.
In essence, an MSS signals that the current market momentum has not only paused but is likely reversing. For traders, this is a pivotal moment: the lower highs in an uptrend or the higher lows in a downtrend prior to the break suggest that a new opposite trend is starting to take shape.
How to Use a Market Structure Shift in Trading
An MSS ultimately serves as a directional tool. It helps traders understand when a potential trend reversal is underway, enabling them to align their strategies with the new market direction.
To effectively use an MSS in trading, traders often follow these steps:
- Observing Current Market Structure: They start by analysing the existing trend direction and key price levels. Understand whether the market is in an uptrend, downtrend, or sideways movement by identifying patterns of higher highs and higher lows or lower highs and lower lows.
- Watching for a Break in Key Levels: The core of an MSS is the break of an important high or low, combined with a sharp price movement that breaches a significant swing point (displacement).
- Confirming with News Releases: MSS often coincides with major economic announcements or news releases that can affect market sentiment significantly. For example, if there's a report indicating unexpectedly high US inflation rates, and this correlates with a sharp downward movement in EURUSD, it provides additional confirmation of the MSS. A stronger dollar against the euro, in this case, would signal a clear shift in market direction towards favouring the dollar.
By recognising these elements, traders can more confidently anticipate and adapt to changes in market direction. A well-identified MSS not only indicates a pause in the current trend but also the establishment of a new trend.
Using Market Structure Shifts With Other ICT Components
Using Market Structure Shifts with other Inner Circle Trader methodology components like break of structure, order blocks, and fair value gaps may enhance a trader's ability to interpret and react to market dynamics.
Integrating MSS with ICT Market Structure
An MSS identifies a potential reversal in the market’s direction. When an MSS occurs, it often leads to the formation of a new high-low range in the direction of the new trend. For example, if a bearish MSS results in a new lower high and lower low, traders can watch for a BOS of this range. A retracement back inside of the new range can signal a decent area to search for an entry to ride the trend that’s just beginning.
Utilising Order Blocks and Fair Value Gaps
However, there are scenarios where the price doesn’t establish a new high-low range but instead returns to the area where the original displacement occurred. This displacement often leaves behind a fair value gap and an order block.
- Fair Value Gap: This is a price range that the market skips over quickly during a displacement, leaving it untested by typical market trading. It often acts like a vacuum, drawing the price back to fill in the gap at a later stage.
- Order Block: An order block is typically a consolidation area that precedes a strong price move and is considered a footprint left by institutional traders. It represents levels where significant buying or selling occurred, potentially acting as support or resistance in future price movements.
If the price returns to fill a fair value gap and enters the order block, this scenario can provide a potent setup for a reversal. Traders might look for confirmatory signals at these levels to enter trades that anticipate the market returning to its previous course or extending the reversal initiated by the MSS.
The Bottom Line
The insights provided on MSS and its application within the ICT trading framework can be instrumental for any trader seeking to navigate the complexities of the market effectively. To put these strategies into practice and potentially improve your trading outcomes, practice a lot and learn more about ICT trading.
FAQs
What Is a Market Structure Shift?
A Market Structure Shift (MSS) indicates a potential reversal in market trends, marked initially by a lower high in an uptrend or a higher low in a downtrend, followed by a displacement—a significant and rapid price movement that decisively breaks through a key market level.
How to Identify Market Structure Shift?
Identifying an MSS involves observing for early signs of trend weakening (lower highs or higher lows) and waiting for a subsequent displacement that confirms the shift. This displacement should significantly penetrate a key swing point, clearly indicating a new direction in market momentum.
What Is the ICT Method of Trading?
The ICT (Inner Circle Trader) method of trading is a comprehensive approach that utilises various trading concepts such as market structure, order blocks, and fair value gaps, focusing on how institutional traders influence the market. It emphasises understanding and leveraging these components to align trading strategies with probable market movements.
What Is the Difference Between MSS and BOS in ICT?
In ICT, a Market Structure Shift (MSS) refers to a potential trend reversal, confirmed by a lower high/higher low followed by a displacement. A Break of Structure (BOS), however, simply indicates the continuation or acceleration of the current trend without necessarily suggesting a reversal, marked by the breach of a key high or low point within the ongoing trend direction.
This article represents the opinion of the Companies operating under the FXOpen brand only. It is not to be construed as an offer, solicitation, or recommendation with respect to products and services provided by the Companies operating under the FXOpen brand, nor is it to be considered financial advice.

Simple Break of Structure BoS Trading Strategy Explained
One of the best and reliable strategies to trade break of structure BoS is to apply multiple time frame analysis.
In this article, I will teach you my break of structure gold forex trading strategy. You will get a complete step-by-step guide with examples.
Let's start with a quick theory and let me explain to you what is break of structure BoS in Smart Money Concept SMC trading.
In a bullish trend, break of structure BoS is an important event that signifies a continuation of an uptrend. It is based on a violation and a candle close above the level of the last higher high (HH).
After a breakout, the broken level becomes the first strong support for trend-following buying.
Check multiple examples of confirmed breaks of structure BoS on GBPNZD forex pair on a weekly time frame.
In a downtrend, Break of Structure BoS means a bearish trend continuation . Break of Structure is considered to be confirmed when a candle closes below the level of the last lower low (LL).
The broken key level becomes the closest strong support for buying.
That's the example of a healthy downtrend on USDJPY forex pair on a daily. Each break of structure BoS pushed the prices lower, providing a strong signal to sell.
What newbie traders do incorrectly, they trade break of structure without a confirmation strategy, and it leads to substantial losses.
Though GBPCHF is trading in a bullish trend and though each BoS provided a trend-following signal. The price retraced significantly lower below the broken structure before the growth resumed.
When the price retests a broken structure after BoS in a bullish trend, start lower time frame analysis.
If you identified a break of structure on a daily, analyze 4h/1h time frames.
If on a 4H, then 30/15 minutes.
After the price sets a new higher high with BoS in uptrend, it usually starts trading in a minor bearish trend on lower time frames.
With our strategy, your signal to buy will be a retest of a broken structure and a consequent bullish Change of Character CHoCH . That will provide an accurate bullish signal.
In a bearish trend, analyze the lower time frames after a retest of a broken structure. Your signal to sell will be a bearish Change of Character CHoCH.
Look at a price action on EURCHF on a daily.
We see a strong bullish trend and a confirmed Break of Structure BoS.
According to the rules of our trading strategy, we start analyzing 4h/1h time frames after a retest of a broken level of the last Higher High.
Our signal to buy is an intraday bullish CHoCH. We open a long trade after that with the stop loss below the intraday lows and take profit being a current high.
That's how simple this strategy is.
Multiple time frame analysis provides the extra level of security.
Strong lower time frame confirmation substantially increases the win ratio of a trading setup.
❤️Please, support my work with like, thank you!❤️
I am part of Trade Nation's Influencer program and receive a monthly fee for using their TradingView charts in my analysis.

How to Find a High Probability Trade in an Uptrend Hey Traders,
We'll show you how you can find an easy trade with a high risk-to-reward ratio using some basic concepts.
- Step One: Spot an uptrend where you have higher highs and higher lows.
- Step two: Spot the last break of structure.
- Step three: Use the Fibonacci tool and connect it from the recent lows to the recent highs.
- Step Four: Watch prices coming back to the broken structure that lines up with any Fibonacci level. ( Focus on the 50% - 61.8% - 78.6% Levels )
- Step Five: Wait for a clear bullish candle and then enter with stoploss structure
- Step Six: Take partial profits at the recent highs and the Fibonacci extensions ( - 0.27 & -0.618 )

A guide to Profitable Scalping (why waste a price action)In the world of trading, many participants find themselves constantly waiting for the perfect confirmation for swing positions or entries, often missing out on the rapid movements that characterize financial markets. This is where the art of scalping comes into play, a strategy vastly different from swing trading, yet equally, if not more, compelling for those who master it because it offers way more opportunities to make money. In this blog post, I'll guide you through the essentials of becoming an effective scalper, focusing on market structure theory, the significance of Break of Structure (BOS), and the nuances that set scalping apart from swing trading.
Understanding Market Structure Theory
To excel in scalping, one must first be well-versed in market structure theory. This theory is the backbone of understanding how markets move and why they behave in certain patterns. It involves analyzing price highs and lows, trends, and ranges to predict future price movements. For a comprehensive understanding of market structure theory, this resource offers an in-depth explanation, it's not complete, but the best one freely available so I suggest you understand the content properly.
www.youtube.com
The Role of Break of Structure (BOS)
A critical concept in scalping is the Break of Structure (BOS). When we observe a confirmed BOS to the upside or downside, it indicates a significant shift in market sentiment. The order block that caused this break becomes a focal point of interest. This is because, in the realm of scalping, these points often act as magnets for price, offering high-probability entry points.
Capitalizing on Order Blocks
Once a BOS is identified, scalpers must pay close attention to the order block that instigated this shift. When the price returns to this order block, a reaction is typically expected. This reaction is the bread and butter of scalping. Unlike swing traders who seek to capture larger market moves over extended periods, scalpers thrive in these quick, precise moments.
Scalping vs. Swing Trading: A Different Focus
The primary difference between scalping and swing trading lies in their respective focuses and timeframes. Swing trading involves holding positions for several days to weeks, aiming to profit from substantial price moves. Traders in this domain often focus on potential targets for a trade, analyzing broader market trends and economic factors.
Conversely, scalping is a short-term strategy where trades last from a few minutes to hours. The focus here is not on the potential extent of a price move but, on the risk, -to-reward ratio. Scalpers typically aim for a 1 to 3 risk-reward ratio, meaning they risk one unit to gain three. This approach requires quick decision-making so it's much more involved than swing trading.
Before we go on to see some examples following are the key things to remember to be effective in scalping
To be an effective scalper, you need to:
1. Develop a proper Understanding of Market Structure
2. Identify High-Probability Order Blocks
3. Master Risk Management: Given the high-speed nature of scalping, managing risk is paramount. This involves setting strict stop-loss orders and having a clear risk-to-reward ratio for each trade.
4. Stay Disciplined and Agile: Scalping requires discipline to follow your trading plan and agility to adapt quickly to changing market conditions.
Examples: Scalable OBs with results.
This happened today: on SPX and NAS100
NAS100:
SPX:
How to pick an order block to trade for scalping:
Entry for Scalping should be between 0.25 to 0.5 level inside the Order Block, you can use FIB tool to get these levels, this is highlighted in the Images above.
1. Do not go above 4h TF for this strategy.
2. Make sure Order block is caused a BOS
3. Notice the time frame of BOS, Pick the Order block in relation to the BOS timeframe.
4. Makes sure Prior to BOS the Order block resulted in FVG
5. Make sure the Order Block is not too big as it will result in greater risk, which I do not prefer.
6. If price does not hit your entry do not chase price, move on to next one.
I want to emphasize here again , the goal of scalping is to capture the small move , not the whole move , so your focus should be one getting 2X or max 3X of your trade once , you do you get out and move on to next one , the good thing about this strategy is you can always find multiple assets where BOS is happening on anywhere from 1h to 4H TF.
Finally, nothing in the world of trading is 100% so it's possible this may not work sometimes, which you should be okay with as long as it works more than 50% of the time. I
n my experience it works more than 80% of the time.
Conclusion
Scalping is a dynamic and potentially lucrative trading strategy that requires a unique skill set, distinct from swing trading. By understanding market structure theory, focusing on order blocks following a BOS, and maintaining a disciplined approach to risk management, traders can exploit the rapid movements of the market for steady income. Remember, the key to successful scalping lies in quick, informed decisions and an unwavering commitment to your strategy.
Like and Leave comment to this post to seek further clarifications if needed.
Happy trading!

📊 Market Structure: BOS VS CHOCH📊What is market structure?
Market structure is the levels that are created by the price of any currency as it moves up and down.
Price never moves in a single direction for too long. It always takes a few steps in one direction, then moves a few steps back, then a few more steps, then a few steps back.
Over time, these steps form distinct structures in the market: zones of consolidation, zones of support, zones of resistance, and zones where price impulses up and down.
Market structures that form in the past are often respected in the future, and analyzing previous market structure can form a basis for a trading plan.
BoS carries on in the same direction it was initially heading in where as a CHoCH can be viewed as the Markets turning point
🔷BOS - Break of structure forms in the direction of the trend creating continuation patterns.
Break of recent Lower Low when bearish or break of recent Higher High when bullish.
🔶CHOCH - Change of character form at the end of a trend. For example, if we see an uptrend in the market, characterized by higher highs and higher lows,
this means that the overall trend remains bullish. However, when a new high is formed and then impulsively broken to the downside,
this could signal that the bullish trend might be coming to an end, and that a possible choch transition may be happening.
👤 @algobuddy
📅 Daily Ideas about market update, psychology & indicators
❤️ If you appreciate our work, please like, comment and follow ❤️

GBPUSD Case StudyWatch this clip to see how I found and executed this GBPUSD Sell Idea and how you could have as well. ENJOY.

CHOCH vs BOS ‼️WHAT IS BOS ?
BOS - break of strucuture. I will use market structure bullish or bearish to understand if the institutions are buying or selling a financial asset.
To spot a bullish / bearish market structure we should see a higher highs and higher lows and viceversa, to spot the continuation of the bullish market structure we should see bullish price action above the last old high in the structure this is the BOS.
BOS for me is a confirmation that price will go higher after the retracement and we are still in a bullish move
WHAT IS CHOCH?
CHOCH - change of character. Also known as reversal, when the price fails to make a new higher high or lower low, then the price broke the structure and continue in other direction.

ORDERFLOW & LIQUIDITYPlease like, share & comment on my educational post.
--------------
After a BOS we expect price to pullback and
mitigate a significant zone in the previous
range before continuing
to break structure again.
If we do not get this mitigation it is likely that the
high/low that failed to mitigate will become liquidity.

Bullish Order FlowThis weeks price action was phenomenal on EURUSD. We had a clear bullish run respecting the order flow of the move.
After each break of structure, price was mitigated back to the order block that caused the breakout.
Over and over like clockwork.
If you can understand and grasp concepts like this, you can trade and stack positions when we have clear trending weeks.

Eg.2: Viewing Break of Market Structures as Broken Expectations Another example of how market structure breaks can be viewed from a perspective of broken expectations of either parties (buyers or sellers). If you were a buyer or seller, where would you be getting involved? Had you gotten involved, would your expectations have been met? If not, how violently were they broken?

Viewing Break of Market Structures as Broken ExpectationsBreak of expectations is a perspective from which I look at market moves a lot of the time. Broken expectations manifest in the form of broken structures. It's the same thing, but just another way of looking at such moves which makes the liquidity story a bit clearer thereby inducing more confidence in taking trades off these zones. Obvious trend continuation zones, when broken, catch many a trader offside. These make for high probability trade locations (for trades in the opposite direction).

Market Structure - The Chart analysis (simplified!!!)Using Market Structure to identify entries in the FX market has been a life changing technique for me. Through this video, i described my process of entering trades using MS without a single indicator in sight!!!
You'll see the following :
1. How to draw support and resistance.
2. How to identify the trends in a market ? What is a Break of Structure ?
3. Avoiding fake outs using the Law of 2's (by waiting for two consecutive HH's and HL's | LH's and LL's).
4. What is a Major Level ? Is it really useful to my analysis?
5. How to determine Take Profit using MS.....etc

Backtesting retest Break of Market Structure on Multi TimeframeStrategy
Create a zone from the order block which created break of market structure on 1D timeframe
Wait for it to be tested on 4H timezone => which will create new 4H order block
Trade the retest of that 4H order block
Color coding & icon use
Green boxes : 1D order block zone
Yellow boxes : 4H order block zone
Tick icon : Trade won on 4H
Cross icon : Trade lost on 4H
Circle with cross icon : Trade in breakeven
Win / loss assumptions
Win : 3R movement without breaking -1R
Loss : -1R movement
Breakeven : 1R movement, followed by -1R movement
Risk Management
50% TP @ 1R
25% TP @ 2R
25% TP / Trade closure @ 3R
RR achieved = 3R
Net R achieved = 1.75R
Strategy results
Testing duration : Jan 2020 - Jan 2021
Wins = 16
Loss = 7
Breakeven = 4
Non-losers = 74%
Absolute Winners = 59%
Net RR = 21
Avg R/Win = 1.31R
Avg R/Trade = 0.78R

Determine Trend Reversal Using RSI Indicator With Price Action1. Price created lower low and RSI higher low (tight divergence - oversold).
2. Reversed on demand zone with candlestick pattern.
3. Broke down trend structure with retest as confirmation.
4. Price went above 200 EMA and used it as support.
