XAUUSD Long: The 4,160 Support Holds – Path to 4,260 is OpenHello, traders! The price action for XAUUSD is currently developing within a well-defined ascending trend structure, supported by a rising major Trend Line from the lows. The market previously showed multiple rejections from the Triangle Supply Line, each marked by clear breakout attempts followed by corrective pullbacks. These reactions formed a sequence of higher lows, confirming that buyers remain in control of the broader structure.
Currently, after the last strong impulsive move upward, Gold reacted from the Supply Zone around 4,260, forming a short-term corrective phase while respecting the rising Triangle Demand Line near the 4,160 demand level. Price is now compressing between the descending supply line and the ascending demand line, creating a tightening triangle structure that signals growing pressure for a directional expansion. This compression reflects a balance between profit-taking sellers at resistance and aggressive dip-buyers along demand.
My scenario for the further development is bullish continuation as long as price holds above the Triangle Demand Line and the 4,160 demand zone. I expect a rebound from current levels, followed by a renewed attack on the 4,260 Supply Zone. If buyers manage to produce a clean breakout above this resistance, Gold may accelerate toward higher targets with strong momentum continuation. However, if the supply zone holds and price breaks below the demand line, a deeper corrective pullback toward the main rising Trend Line could develop. For now, the structure favors buyers, with the key focus on a breakout attempt toward 4,260. Manage your risk!
Breakout!

EURUSD: Buyers Push Toward the 1.1680 Triangle Resistance BreakHello everyone, here is my breakdown of the current EURUSD setup.
Market Analysis
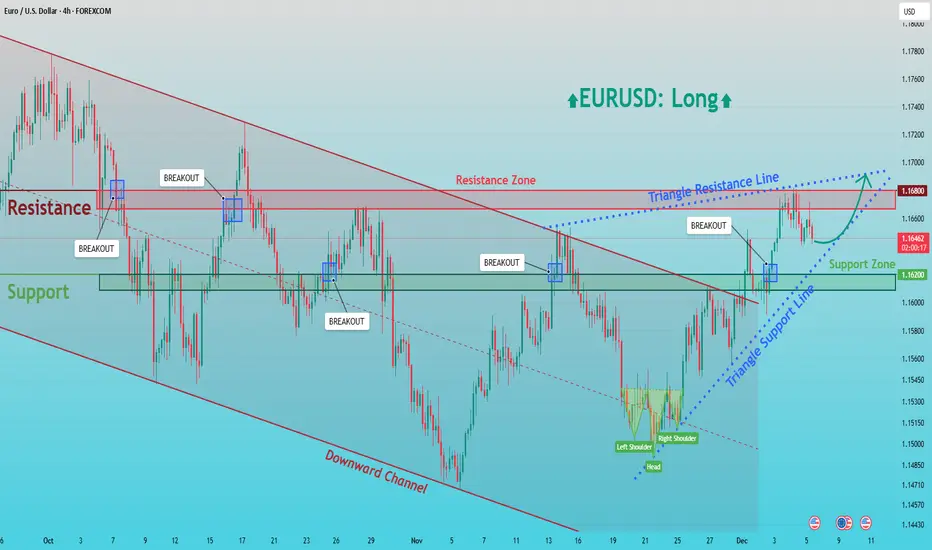
EURUSD is transitioning out of a prolonged bearish phase that previously unfolded inside a well-defined downward channel. After forming a major swing low in early November, the pair initiated a recovery and gradually shifted into a corrective bullish structure. Price is now trading inside a developing triangle formation, defined by the ascending Triangle Support Line and the descending Triangle Resistance Line. During the decline, the market repeatedly respected the key Support Zone around 1.16200, which acted as a strong demand area and triggered bullish reactions on multiple occasions. Most recently, EURUSD completed a clear Head and Shoulders reversal pattern near the lower boundary, signaling exhaustion of sellers and the start of buyer control. Following this structure, price broke above the support zone and is now consolidating above it, confirming the zone as a valid demand base.
Currently, the pair is approaching the major Resistance Zone at 1.16800, which also aligns with the descending triangle resistance. This area remains the key upside barrier for buyers and represents a critical decision point for the market.
My Scenario & Strategy
My scenario is bullish, as long as price remains above the 1.16200 Support Zone and continues respecting the ascending Triangle Support Line. I expect EURUSD to maintain upward pressure and attempt a breakout toward the 1.16800 resistance, which is the next major supply area. A clean breakout above this zone would confirm bullish continuation and open the way for further upside toward higher targets.
However, if price reaches the resistance and shows strong rejection, a corrective pullback back toward the 1.16200 demand may occur. Still, the overall bullish structure remains valid as long as the support zone holds. For now, market conditions favor a long bias with focus on a breakout attempt toward the 1.16800 resistance zone.
That's the setup I'm tracking. Thank you for your attention, and always manage your risk.
BTCUSDT: Failed Recovery Opens Path to 87,000 SupportHello everyone, here is my breakdown of the current BTCUSDT setup.
Market Analysis
BTCUSDT is trading inside a broader ascending channel, but the recent price action shows clear signs of weakness near the upper structure. Price previously attempted a breakout above the 90,000 Resistance Zone, however this move turned into a fake breakout, confirming strong seller pressure in that area. After the rejection, the market shifted into a corrective phase and formed a descending triangle structure, defined by the Triangle Support Line and repeated failures near resistance.
Currently, price is consolidating just below the 90,000 resistance, while gradually sliding along the descending support of the triangle. The 87,000 Support Zone remains the key downside buffer where buyers previously stepped in. The overall structure now suggests that bullish momentum is weakening, and sellers are gaining short-term control as long as price remains below the 90,000 resistance level.
My Scenario & Strategy
My scenario is bearish, as long as BTCUSDT stays below the 90,000 Resistance Zone and continues to respect the descending triangle structure. I expect price to attempt another breakdown toward the 87,000 Support Zone, which aligns with the lower channel support and previously active demand area. A clean break below 87,000 would confirm bearish continuation and open the path toward deeper downside targets.
However, if price once again reclaims the 90,000 resistance with strong volume and holding strength, the bearish scenario would be invalidated and a renewed push toward the upper channel could follow. For now, the market supports a short bias, with the main focus on a potential move toward the 87,000 support area.
That’s the setup I’m tracking. Thank you for your attention, and always manage your risk.

XAUUSD Bullish Trend in Play — Path Open Toward 4,300 TargetHello traders! Here’s my technical outlook on XAU/USD (Gold) based on the current market structure. Gold remains in a broader bullish trend, supported by a clearly defined rising Trend Line that has guided price action since the beginning of the impulsive move. After the initial breakout from the Support Level, the market formed a well-structured range, followed by a corrective pullback and another consolidation phase, confirming healthy bullish rotation. Price is currently trading above the key Support Level near 4,140, while attempting to stabilize above the rising Support Line, which keeps buyers in control of the short-term structure. The recent breakout from the second range indicates renewed bullish momentum, with price now approaching the major Resistance Level around 4,260–4,270. As long as Gold holds above the support zone and respects the ascending trendline, the bullish scenario remains valid. The structure suggests continued pressure toward the upside, with TP1 positioned near 4,300, which aligns with the next key resistance area. A clean breakout above this level could open the door for further trend continuation and higher upside targets. However, a failure to hold the Support Line could lead to a deeper pullback toward the lower support zone. For now, the technical structure favors the buyers, with bulls aiming for a retest and breakout of the 4,260–4,300 resistance zone. Please share this idea with your friends and click Boost 🚀

EURUSD Uptrend Structure Intact — Path Toward 1.1700 ResistanceHello traders! I want to share my view on the current EURUSD setup. After a corrective decline, the pair formed a solid local bottom around the Support Level near 1.16200–1.16400, where buyers stepped in and stopped the downward momentum. As shown on the chart, price is now trading inside a clear ascending structure, supported by the rising Support Line and guided by a parallel Resistance Line, forming a well-defined upward channel. Inside this structure, the Buyer Zone has played a key role, serving as the base for multiple impulsive breakouts in the past. Several breakdown attempts turned into fake breakouts, confirming that buyers continue to defend this area and maintain short-term trend control. After these rebounds, EURUSD pushed into the upper part of the channel, reaching the Resistance Line and forming a local rejection that caused a pullback back toward the Buyer Zone. Currently, price is hovering near the ascending support line, and as long as EURUSD stays above the 1.16400 support area, the bullish scenario remains intact. If buyers successfully defend this zone and maintain structure inside the rising channel, I expect the market to move toward TP1 → 1.17000, which aligns with the major Resistance Level highlighted on the chart. A clean breakout above this level would open the way for further continuation, potentially driving the pair deeper into the higher resistance zone. However, if the price breaks below the Buyer Zone and violates the ascending Support Line, the bullish scenario becomes invalid, and the pair may revisit lower support levels around the 1.16000 area. For now, the structure remains moderately bullish as long as demand holds and EURUSD continues respecting the rising channel. Please share this idea with your friends and click Boost 🚀

Gold completes its corrective phase and heads toward $4,250OANDA:XAUUSD is moving within a remarkably well-structured ascending channel, and the overall market structure clearly highlights the strength of the buying momentum. Each swing produces higher highs and higher lows, confirming that the bullish dynamic remains intact despite a few natural pauses along the way. The recent pullback looks more like a healthy technical breather than a sign of weakness, often the kind of pause that sets the stage for a new upward acceleration.
The price is now approaching a key support zone, where the lower boundary of the channel aligns with a previously proven demand area. If the market reacts here, buyers could find a highly favorable re-entry opportunity that aligns perfectly with both the channel structure and the logic of the current trend. In that scenario, the natural upside target is around 4,250 dollars, a level that combines the channel’s midline with a historical resistance, giving even more weight to this objective.
The bullish outlook remains valid as long as the price holds above the support zone and the ascending trendline. A decisive break below these levels would redefine the market context and open the door to a deeper correction, but for now, market conditions continue to favor long positions.
Stay disciplined in your market reading, validate your setups carefully, and protect your capital with strict risk management. Good luck.

BTCUSDT Long: Buyers Defend 91K Zone – Targeting 96K ExpansionHello, traders! The current BTCUSDT price action is developing within a strongly structured bullish environment after a prolonged decline driven by the Descending Channel. Earlier, the market broke down from the upper supply region and continued to move lower while respecting the descending channel boundaries. After reaching a pivot low near the demand zone around 91,000, buyers stepped in, initiating a reversal and shifting momentum to the upside. Following this, Bitcoin formed a clean Ascending Channel that confirmed growing bullish pressure. Price then entered a Range phase, indicating temporary equilibrium before the next impulsive move. After completing this consolidation, BTCUSDT created a clear Head and Shoulders reversal structure near demand, signaling a strong bullish reversal. Buyers took control and pushed price sharply upward, breaking through the range and reclaiming higher structure levels.
Currently, BTCUSDT is trading inside a new Ascending Channel, steadily climbing toward the 96,000 supply level, where sellers previously reacted. As long as price remains above the 91,000 demand zone and continues to respect the ascending channel structure, the bullish scenario remains valid. The next upside target is the 96,000 resistance area, aligned with the upper channel boundary.
My scenario is a continuation toward 96,000 as long as buyers maintain control of the channel. However, a strong rejection from this supply zone may trigger a corrective pullback back toward demand before buyers attempt another move upward. Manage your risk!

BTCUSD Pauses at Structure Top — Bulls Aim for 95,500 RetestHello traders! Here is my breakdown of the current BTCUSD setup. After a strong bearish phase, Bitcoin found support near the major Support Level around $89,100. Before reaching this zone, price was trading inside a broad descending channel, where both the Resistance Line and Support Line guided the downtrend. A fake breakout occurred near the lower boundary, showing early buyer interest, but overall momentum remained bearish until price reached the support. From there, BTC formed a clear sideways Range, signaling accumulation before a reversal attempt. Once buyers gained strength, price broke out of the range and shifted into a bullish structure. BTC began climbing within a rising wedge-like channel, respecting both the ascending Support Line and the diagonal Resistance Line. Along the way, the market formed multiple breakouts and fake breakouts, confirming active participation from both sides. However, buyers consistently defended the rising trendline, maintaining higher lows while approaching the key horizontal Resistance Level near $95,500. Currently, BTCUSD is pulling back slightly after touching the wedge resistance. As long as price holds above the ascending support and stays above $89,100, the bullish structure remains intact. My scenario suggests a potential continuation toward TP1 → $95,500 upon a successful rebound from the local support. If the market breaks below the rising structure, however, a deeper correction may unfold before any further upward attempt. For now, buyers are favored while the price remains inside the ascending channel. Please share this idea with your friends and click Boost 🚀

EURUSD Bullish Continuation After Expected CorrectionQuick Summary
A short term corrective move may occur on EURUSD to retest the Bullish trendline where the 61 Fibonacci level aligns with a clean orderblock. This confluence strengthens the likelihood of a bullish continuation once the correction is complete.
Full Analysis
The EURUSD is still maintaining an overall bullish structure, but the current price action suggests that a corrective decline could develop before the pair continues its upward movement. This expected pullback is not a sign of weakness but rather a healthy retracement within an established uptrend.
The key area to watch lies around the Bullish trendline, or slightly above it, where multiple elements converge to form a high probability demand zone. The 61 Fibonacci retracement level aligns almost perfectly with this Zone, providing a strong technical base for buyers to re enter the market.

AUD-USD Bullish Continuation Expected! Buy!
Hello,Traders!
AUDUSD taps into the reclaimed demand zone, showing a clean breakout and bullish displacement. Price is likely to retest the broken structure before expanding toward the target level. Time Frame 7H.
Buy!
Comment and subscribe to help us grow!
Check out other forecasts below too!
Disclosure: I am part of Trade Nation's Influencer program and receive a monthly fee for using their TradingView charts in my analysis.

EURUSD Early Week Bullish Outlook After Tokyo SweepQuick Summary
EURUSD remains strongly bullish, and the recent corrective decline is healthy for bullish continuation. Price is expected to dip early in the week to sweep the previous Tokyo low and go deeper into the hourly orderblock that aligns with the ascending trendline before resuming its upward move.
Full Analysis
The EURUSD continues to show strong bullish momentum, and the recent pullback is completely in line with a healthy trending market. Despite the strength of the prior upward move, the pair produced a controlled correction
This corrective move is particularly meaningful because price tapped into a clean hourly orderblock that aligns perfectly with an ascending trendline. Such confluence typically provides a strong foundation for buyers, showing that the market structure remains intact and supportive of further upside.
As we head into the new week, the expectation is that EURUSD may continue to dip slightly to sweep the previous Tokyo low. This potential sweep is important because the liquidity resting below that level can act as fuel for the next bullish expansion. Once the liquidity beneath Tokyo is taken, price is likely to react strongly from the same hourly orderblock zone and resume its upward trajectory.

XAUUSD: Triangle Breakdown Setup Points Toward $4,160 SupportHello everyone, here is my breakdown of the current Gold setup.
Market Analysis
Gold has recently moved out of a strong upward channel, where price previously showed consistent bullish momentum supported by higher lows and clean breakouts. After breaking out of the first channel, XAUUSD formed a consolidation range, signaling temporary equilibrium between buyers and sellers. This range acted as a base for the next impulsive bullish leg, which drove price back into a new upward channel. However, after the strong rally, gold formed a fake breakout near the $4,240 resistance area, which coincides with the upper boundary of the triangle resistance line. This false breakout indicated weakening bullish pressure and exhaustion near the top of the structure. Once price failed to hold above the resistance, it rotated downward and began forming a tightening triangle pattern between the descending resistance line and the rising support line.
Currently, XAUUSD is trading inside this triangle structure, with price gradually compressing. The $4,160 support level remains a key reference point, as it previously acted as a major demand zone during the last correction and is now aligned with the triangle’s lower boundary.
My Scenario & Strategy
My scenario is bearish as long as gold stays below the triangle resistance line and continues to respect the lower highs forming within the pattern. If price maintains this structure and fails to reclaim $4,240, I expect a downward move toward the $4,160 support zone.
Therefore, a clean breakdown below the triangle support line would confirm bearish continuation and could open the door for a deeper correction. On the other hand, if price rejects the support and breaks above the triangle resistance, the bearish setup becomes invalid, and buyers may attempt another retest of the $4,240 level. For now, the structure favors a short bias with the main objective being a move toward the $4,160 support level, which remains the next significant target for sellers.
That's the setup I'm tracking. Thank you for your attention, and always manage your risk.

Bullish Breakout Still Intact but Showing First Signs of ExhaustCAD/JPY 1H – Bullish Breakout Still Intact but Showing First Signs of Exhaustion at 111.95–112.00 Supply
Quick Professional Update & Current Status
Pair: CAD/JPY
Timeframe: 1-hour
Current Price: ≈111.78–111.83 (pulling back slightly from the 111.95 intraday spike)
What Has Changed in the Last ~13 Minutes:
Price spiked aggressively to 111.953 (new 2025 high) → hit the exact top of the annotated Strong Supply Zone (112.00–112.40).
Immediate sharp rejection with a long upper wick (shooting star–style candle) and a fast 15–20 pip drop.
Volume spiked on the rejection — clear evidence of heavy supply entering at that level.
Current Technical Picture:
The ascending triangle breakout remains 100 % valid — we are still above the former resistance (now support) at 111.40–111.60.
First real test of the breakout’s strength is happening right now.
Momentum indicators (RSI 1H) are rolling over from overbought territory for the first time since the breakout.
Key Levels Right Now (as of this candle):
Immediate support cluster: 111.60–111.70 (must hold for bulls)
Stronger support: 111.40–111.50 (breakout zone — critical)
Resistance overhead: 111.95–112.00 (today’s spike high + supply)
Next upside targets still in play: 112.20 → 112.70–112.80 (only if 112.00 is cleared decisively)
Updated Bias & Trade Management (Professional View)
Bias: Still bullish / LONG, but caution warranted — no longer “aggressive buy-the-dip” mode.
Active Scenarios:
Bullish continuation (70 % base case):
Healthy 30–50 pip pullback into 111.50–111.70, consolidates, then resumes higher toward 112.20+.
→ Add or hold longs on a successful retest of 111.60–111.70.
Failed breakout / bearish trap (30 % risk):
If we lose 111.40 on a closing basis → high probability of a fast drop back into the prior range (111.00–110.60).
→ Tighten stops or take partial/full profits.
Immediate Actionable Levels (next 1–4 hours):
Protective stop for fresh breakout longs: 111.38 (just below breakout zone)
Aggressive re-entry / add zone: 111.58–111.68
Take-profit scaling: 50 % off at 112.00, trail the rest

EURUSD Short: Supply Holds — Pullback to 1.1610 in FocusHello, traders! The price action on EURUSD is unfolding within a well-defined technical structure shaped by an ascending Trend Line, with the market transitioning from consolidation into a corrective pullback. After a prolonged bullish advance, the pair formed a Head and Shoulders pattern near the upper Supply Zone around 1.16660, signaling exhaustion of buying momentum. Following this distribution phase, price broke below the neckline and started moving lower, showing a clear shift in short-term control toward sellers.
Currently, EURUSD spent time consolidating inside the highlighted Range, where multiple false breakouts occurred before bullish continuation resumed. However, the recent rejection from supply and the breakdown from the pattern suggest that upside momentum is weakening. Currently, the price is trading below the former range support and is approaching the Demand Zone near 1.16100, which also aligns with a key horizontal support level.
My scenario for the next move is a continuation toward the 1.16100 demand area, where buyers may attempt to slow the decline. A strong bullish reaction from this zone could trigger a corrective rebound back toward the broken structure. However, if the price fails to hold this demand, the bearish pressure may intensify and open the door for a deeper pullback. As long as the market remains below the 1.16660 supply, the short-term bias stays bearish. Manage your risk!

XAUUSD: A new rise is possible after the pullbackXAUUSD has climbed strongly along a steep uptrend, and based on what I’m seeing on the chart, I expect the price to continue pushing toward the 4,265 area.
This zone could become a decision point where the price either finds support and bounces higher or breaks below and allows the move to extend deeper.
If I had to choose a direction right now, I’d lean toward more upside. But price action will always decide what comes next because the chart always speaks last.
When the price breaks below the trendline with real conviction, the bullish scenario loses validity. That could signal a pause in the uptrend or even a short-term reversal.
This is not financial advice, only my personal thoughts based on what I see on the chart.

EURUSD Outlook Ahead of the New WeekQuick Summary
EURUSD is showing strong bullish intent heading into the new week as all downside levels have already been tested. With no clear reason for deeper correction, price is expected to continue upward, targeting the break of the descending trendline and the liquidity resting above it. A clearer entry setup will likely form during the London session, but the zone around 1.15852 can be considered as a potential buy area.
Full Analysis
The EURUSD is preparing for a bullish continuation as the new week opens. The structure shows no meaningful catalysts for further downside movement. All previously relevant levels beneath current price have already been tapped, meaning liquidity to the downside has been consumed. This removes incentive for the market to seek lower prices and instead shifts the focus toward the areas above.
With this context, EURUSD is likely aiming to push upward toward the descending trendline that has been guiding price action over recent sessions. Breaking this trendline and reaching for the liquidity positioned above it appears to be the next logical target for the market.
The cleanest entry signal is expected during the London session when volatility and direction become more defined. However, you can also keep an eye on the 1.15852 level as a potential early buy zone. If the market forms a strong reaction from this area, it could provide a solid opportunity to position for the anticipated upside move

Gold Awakens: Sharp Pullback but Outlook Remains BrightFrom a technical perspective, gold is currently moving within a parallel ascending channel, showing a clear bullish momentum with a rhythm that is hard to ignore. The price recently bounced away from the resistance area, indicating a typical overbought reaction. At the moment, the market is approaching the lower boundary of this projected channel, an area considered important. The convergence of several technical support levels in this zone is likely to attract renewed buying interest.
I expect the price to rebound toward the 4,250 area, which aligns with the mid-channel region. The bullish momentum may not appear immediately. The situation could develop into a consolidation phase, a false decline, or even a sudden acceleration.

AUDUSD BULLISH BREKAOUT|LONG|
✅AUDUSD has broken through the demand ceiling, leaving a clean displacement and forming a fresh FVG. A controlled pullback into the breakout imbalance is likely before the next liquidity sweep toward the target zone. Time Frame 7H
LONG🚀
✅Like and subscribe to never miss a new idea!✅

NML (PSX) – Bullish Setup on 4H Chart📈 Nishat Mills (NML) – 4H Bullish Reversal Setup with Multi-High Divergence
📍 Entry Zone: 148.96 – 150.75
🛑 Stop Loss: Below 140.93
🎯 Targets: TP1 @ 156 | TP2 @ 164 | TP3 @ 172+
✅ Key Trigger: Bullish RSI Divergence + Higher Lows (LL) forming after sharp decline
✅ Confirmation: Price reclaiming key trendline & breaking descending structure
✅ Risk-Reward: > 1:3 (Conservative entry near support)
Disclaimer:
*This idea is for educational and research purposes only, based on technical patterns. It is not investment advice. Always conduct your own analysis (DYOR) and manage your risk carefully before entering any trade.*

CRUDE OIL Bullish Breakout! Buy!
Hello,Traders!
CRUDE OIL price executed a clean SMC breakout above the descending trendline, shifting structure into bullish order-flow as liquidity above recent highs was taken and demand stepped in. Time Frame 10H.
Buy!
Comment and subscribe to help us grow!
Check out other forecasts below too!
Disclosure: I am part of Trade Nation's Influencer program and receive a monthly fee for using their TradingView charts in my analysis.

ETH — [2D] WEEK 49 TREND REPORT | 12/05/2025ETH — WEEK 49 TREND REPORT | 12/05/2025
Ticker: BINANCE:ETHUSDT
Timeframe: 2D
This is a reactive structural classification of ETH based on the weekly chart as of this timestamp. Price conditions are evaluated as they stand — nothing here is predictive or forward-assumptive.
⸻
1) Current Trend Condition [ Numbers to Watch ]
Current Price @ 3,030
• Trend Duration @ +70 Days ( Bearish )
• Trend Reversal Level ( Bullish ) @ 3,689
• Trend Reversal Level ( Bullish Confirmation ) @ 3,534$
• Pullback Resistance @ 3,914
• Correction Support @ 3,096$
• Structural Support @ 1,946$
⸻
2) Structure Health
• Retracement Phase:
Testing Structure (approaching 38.2%)
• Position Status:
Unstable (price below both structural layers)
⸻
3) Temperature :
Cooling Phase
⸻
4) Momentum :
Bearish
⸻
Author’s Note
DOWNWARD STRUCTURAL ALIGNMENT
This mark identifies a moment where the market showed clearer alignment with downside direction. It does not predict future movement, but acknowledges where weakness became more evident within the prevailing structure. Its relevance remains only while price continues to hold beneath key structural boundaries.
⸻
Methodology Overview
This classification framework evaluates directional conditions using internal trend-interpretation logic that references price behavior relative to its structural layers. These relationships are used to identify when price movement aligns with the framework’s criteria for directional phases, transition points, or regime shifts. Visual elements or structural labels reflect these internal interpretations, rather than explicit trading signals or preset indicator crossovers. This framework is observational only and does not imply future outcomes.

EURUSD in strong bullish trendEURUSD remains in a clear long-term uptrend, forming higher highs and higher lows. The next key target is 1.17259, which could see a potential sweep of liquidity before any reaction. After reaching this level, a short-term corrective pullback is possible. The daily candle close will be crucial to confirm the pull back movement.

EURUSD Long: The 1.16200 Support Holds – Path to 1.17000 is OpenHello, traders! The price action for EURUSD is unfolding inside a corrective structure after a prolonged bearish phase that was guided by the descending Triangle Supply Line. The market previously formed a consolidation Range on the left side of the chart before breaking down and continuing lower. Price respected both the descending supply line and the ascending Triangle Demand Line, creating a compression phase that ultimately resulted in a bearish breakout to the downside. After forming a pivot low, EURUSD initiated a strong bullish recovery, breaking back above the former structure and confirming a shift in short-term momentum. The market then formed a clear Head and Shoulders reversal pattern near the Triangle Demand Line, reinforcing buyers’ strength. Following this, price successfully broke through the key Demand Zone around 1.16200, confirming the transition from corrective to bullish conditions.
Currently, EURUSD is retesting this demand area after the breakout, showing signs of support holding. As long as price remains above the 1.16200 demand zone, the bullish scenario remains valid. The next upside objective is the 1.16650–1.17000 Supply Zone, where sellers previously showed strong activity.
My scenario is a clean continuation toward Supply 2 at 1.17000 becomes likely if buyers maintain control. However, a rejection from this supply region could trigger a corrective pullback back toward demand before any further upside continuation. Manage your risk!
