GOLD 1H - flag breakout confirms bullish momentumOn the 1H chart, gold has completed a bullish flag formation and already broken out to the upside. Key retest levels sit at 3748 and 3730, where buyers may confirm control. With EMA50 and EMA200 holding below, structure remains bullish. RSI has cooled off, supporting a potential continuation move.
Fundamentally , dollar weakness and Fed uncertainty sustain safe-haven demand.
Tactical plan: watch for price reaction on a possible retest of 3748–3730, as buyer interest here could launch a push toward 3820–3830.
The breakout has already happened - now gold needs confirmation to extend the rally.
Breakout!

ARKK: when a breakout isn’t just a breakout-it’s a runway to $91On the weekly chart, ARKK has broken out of a long-standing ascending channel, ending a year-long consolidation phase. The breakout above $71.40, with a confident close and rising volume, signals a transition from accumulation to expansion. The move came right after a golden cross (MA50 crossing MA200), further confirming institutional interest. Price has already cleared the 0.5 and 0.618 Fibonacci retracements — and the 1.618 extension points to $91.40 as the next technical target.
Momentum indicators like MACD and stochastic remain bullish with room to run. Volume profile shows low supply above $75, which could fuel an acceleration toward the target zone.
Fundamentally, ARKK remains a high-beta, high-risk vehicle — but one with focus. The ETF is positioned around next-gen tech: AI, robotics, biotech, and automation. Assets under management now exceed $9.3B with +$1.1B net inflow in 2025. YTD return stands at 37%, and its top holdings (TSLA, NVDA, COIN) are back in favor. This isn’t just a bet on innovation — it’s diversified exposure to a full-blown tech rally.
Tactical setup:
— Entry: market $69.50 or on retest
— Target: $80.21 (1.272), $91.40 (1.618 Fibo)
Sometimes a breakout is just technical. But when there’s volume, a golden cross, and billions backing it — it’s a signal to buckle up.

IMX ABOUT TO BREAK MAIN LEVEL ON WAY - UPDATE 27-09-2025📊IMX/USDT Update
IMX has successfully moved above the low time frame zone, showing early signs of strength.
Price is now approaching the main trend level (around 0.708 – 0.715). This is the critical zone where confirmation could trigger the next bigger move.
Key levels:
0.708 – 0.715 → main trend resistance. Breakout here would confirm strength.
0.654 → cycle support. As long as this level holds, the bullish structure remains valid.
0.969 – 1.00 → breakout target zone.
Upside scenario:
If IMX clears the main trend zone, probability increases for a breakout rally toward $0.95 – $1.00.
Downside risk:
If IMX fails to break the main trend and falls back below 0.708, sideways consolidation could continue, with 0.654 as the must-hold support.
📌 Summary
IMX is above the low time frame zone → momentum is improving.
Main trend breakout above 0.715 = increased probability of rally.
Target: $0.95 – $1.00 if breakout is confirmed.
Support: $0.654 remains the cycle base.

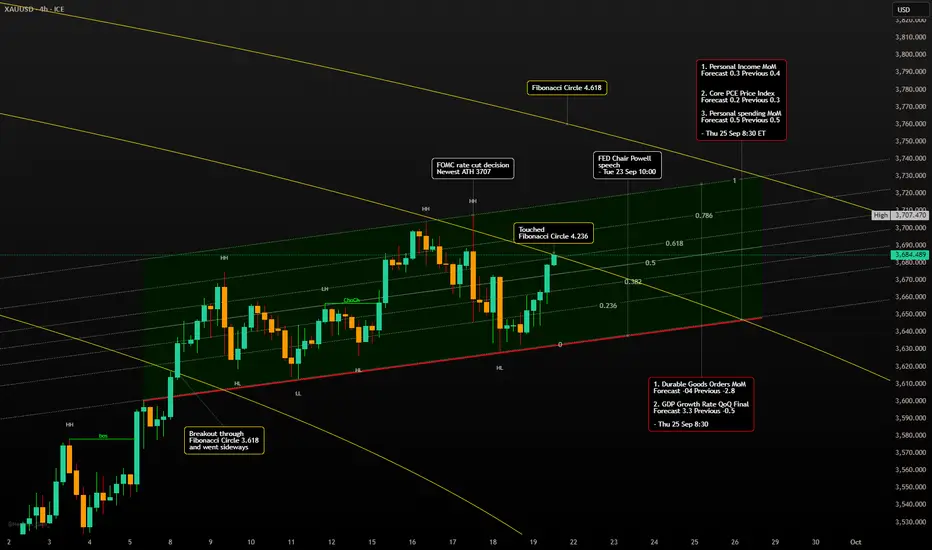
Gold Week Sep 22 - Sep 26 - Fibonacci Circles Breakout?🎢 Last Friday was a rollercoaster, and not the fun kind for me. 😅 My trading plan went completely haywire, and I'm pretty sure everyone reading was like, "What is this noob doing? 😂" But hey, we learn from our mistakes, right? So let's break down what happened.
FX_IDC:XAUUSD Crazy Friday 💥
I usually trade during the European session, and everything was going smoothly. Gold was behaving just as I expected, dropping to $3643. Then, chaos! 😱
First, it shot up to $3659, and just when I thought it was done, it decided to fall back down to $3643. But wait, there's more! At the start of the US session 🇺🇸, it went on a bullish rampage, soaring to $3685, the high of the day. 🚀 I was totally caught off guard! My bias was short because of the recent highs after the FOMC and rate cut news. That was a big lesson learned. 😩
What's Up Next? A Big Week Ahead! 🔮
Get ready, because this week is going to be HUGE! 🎉 My analysis shows that Gold is in a **super important spot** right now. It's in the perfect position to try and make a big move higher! 📈
You might not believe me, but my Fibonacci circle analysis is screaming "breakout!" 📢 If you draw a Fibonacci circle on the daily chart from **$3500.200 (April 21, 2025)** to **$3246.550 (June 29, 2025)**, you'll see a pattern of breakouts. And guess what? We're on one of those circles right now! It's no joke, you should totally try it yourself. 🤯
As long as Gold holds this level, it's primed for a surge. 🌊 I even drew an image showing that Gold is sitting right on the 4.236 Fibonacci circle level from Friday's close. This is serious stuff! 🧐
I'm expecting a sideways "ping pong" 🏓 kind of week until Thursday, bouncing around the 0.382 and 1 Fibonacci levels. The ascending parallel channel gives us a clue on where it might go in the short term.
Heads Up: This Week's Economic Events 📅
Keep an eye on these key events, as they can really shake things up! 🔔
Thursday, September 25th, 8:30 AM EST
- Durable Goods Orders MoM: Forecast -0.4% (Previous -2.8%)
- GDP Growth Rate QoQ Final: Forecast 3.3% (Previous -0.5%)
Friday, September 26th, 8:30 AM EST
- Personal Income MoM - Forecast 0.3 Previous 0.4
- Core PCE Price Index - Forecast 0.2 Previous 0.3
- Personal spending MoM - Forecast 0.5 Previous 0.5
My Two Cents: A Word of Caution 🙏
Things can change in the blink of an eye, so be careful! I don't know what the next Asian and EU session will bring, but I have a feeling the US session is gearing up to buy Gold again. 💰
Remember, different trading sessions (Asia 🌏, Europe, and the US) have different biases. Don't make the same mistake I did last Friday! 😔 Stay sharp and happy trading! 🚀
-------------------------------------------------------------------------
This is just my personal market idea and not financial advice! 📢 Trading gold and other financial instruments carries risks – only invest what you can afford to lose. Always do your own analysis, use solid risk management, and trade responsibly.
Good luck and safe trading! 🚀📊
God Candle on SQD Entering Its Next Era
After a massive breakout from sub-$0.10 levels, $SQD has rallied over 100% in 24h, fueled by growing adoption news and upcoming staking/rewards utility.
Chart Setup
Strong parabolic move with volume confirming trend.
Local top printed around $0.28 before sharp rejection → healthy cooling phase now around $0.20 support zone.
Key support: $0.20 psychological + breakout retest.
Resistance: $0.25–$0.28 range (previous rejection zone).
Scenarios
Holding above $0.20 could set up a higher low → continuation toward $0.30+.
Failure to hold $0.20 may trigger a deeper retrace into $0.16–$0.18 accumulation zone before the next leg.
Narrative Catalyst
SubSquid isn’t just hype – it’s solving blockchain data infra across Solana, Ethereum, Polkadot & more. With 100M+ daily API calls, 70+ projects, and staking about to go live, token demand could accelerate alongside ecosystem adoption.
📌 Outlook
Near term → consolidation after vertical run.
Mid term → continuation likely as adoption narrative + staking kick in.
Long term → if SubSquid becomes the “AWS of Web3 data,” today’s moves may just be the beginning.

AUD-USD Bullish Confirmation! Buy!
Hello,Traders!
AUDUSD confirms breakout above neckline, shifting order flow bullish. SMC structure suggests price will expand toward liquidity resting at 0.6555. Time Frame 1H.
Buy!
Comment and subscribe to help us grow!
Check out other forecasts below too!
Disclosure: I am part of Trade Nation's Influencer program and receive a monthly fee for using their TradingView charts in my analysis.

Is this a platinum breakout?Using a weekly chart of a platinum ETF.
Breaking out above it's triangle pattern. Needs confirmation though or retrace in the next coming months

GUTS - Fractyl Health - $1.38 Breakout - $2.55 PTNASDAQ:GUTS broke above a $1, hitting $1.38 before consolidating. NASDAQ:GUTS is currently breaking a long-term downward channel it's been trading in since Apr 2024. We need to see support above $1.14 to push past the $1.37 - $1.47 Resistance Levels, looking for a $2.55 PT / Retest based on the comany stated: Trial Results Support Revita as First Therapy for Post-GLP-1 Weight Maintenance; Shares Rise Pre-Bell

CHFJPY: Trend ContinuationI see another trend continuation opportunity over on the CHFJPY pair. One thing to note is that rollover is in a few hours so consider exiting and re-entering this position to avoid getting stopped out.
Daily Timeframe:
Price crossed above HTL and the fakeout was invalidated quickly as price crossed back above HTL
H1 Timeframe:
I see quite a bit of confluence here with the following signals observed in the subsequent bullets
Price is moving out of EMA band again
Price crossed above DTL so that signals a likely end to the intraday counter-trend move
EMA20 remains above EMA60 to show overall uptrend confluence with the daily timeframe

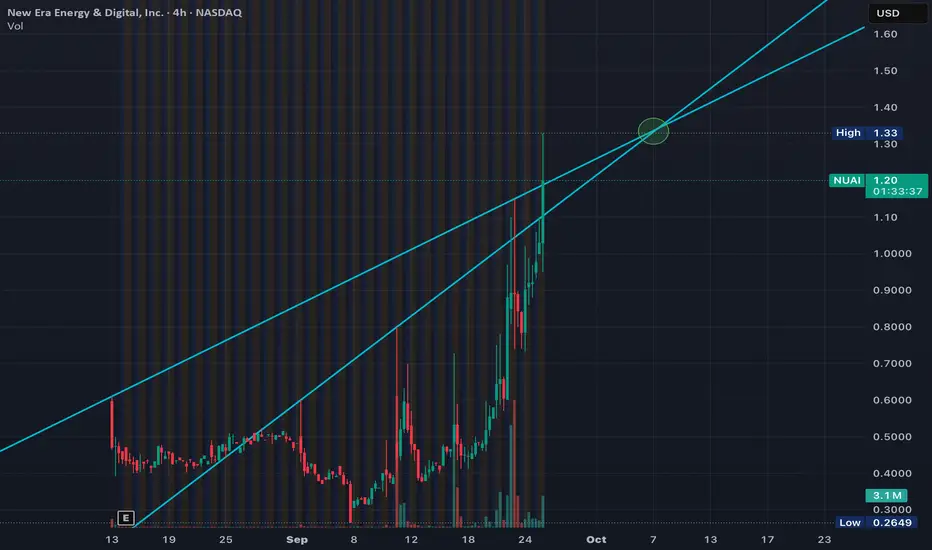
$NUAI - New Era Energy - $1.33 Breakout PointNASDAQ:NUAI broke $1 this morning, hitting $1.33 before slightly consolidating after Market Open. Looking for a continuation into a $1.33 retest and breakout after the company announced that its advancing its development of its Texas Data Center Venture for 1 Gigawatt Power Capacity.
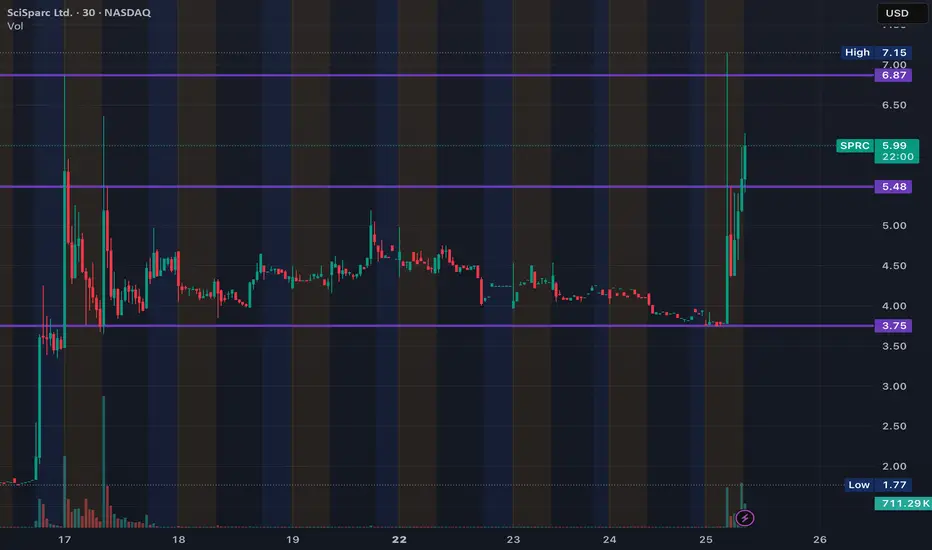
$SPRC - SciSparc - $5.47 Breakout - $10.45 RetestNASDAQ:SPRC bounced off the $3.75 support and hit $7.15, retesting the $6.87 levels of resistance. Looking to find support on the $5.47 levels to continue breaking that $6.87 and pus to retest the $10.45s after announcing plans to launch a quantum computer ting 3D protein modeling initiative.
$EVAX - Evasion - $5.52 Resistance? $8.92 Retest?NASDAQ:EVAX broke out this morning $5.52 and is showing signs of potentially consolidating after announcing licensing for its EVX-83 Vaccine Candidate to Merck for $7.5 Million Cash Payment, up to $592 Million in Milestones and Royalties on Sales.
If we could get past that $5.52 Level of Resistance and blow through $6, we would be targeting an $8.92 Retest and consolidation at that point.

US100 M30 – Sideway at the Top - Short OpportunityThe CAPITALCOM:US100 index has experienced a strong upward move on the 30-minute chart, pushing price to a new high around the 24,800 – 24,850 zone. However, recently, price has been moving sideways within a narrow range, forming a consolidation phase near this key resistance area. This sideways action signals a potential short-term correction or trend reversal.
📉Technical Analysis:
Current Sideways Zone: Price is consolidating between approximately 24,800 and 24,850, repeatedly testing this resistance but failing to break through decisively.
Key Support Level: The 24,650 – 24,700 zone is acting as critical support, holding price during this consolidation.
Support Break Signal: A close below the 24,650 – 24,700 support range would confirm the start of a downtrend and signal a likely bearish move.
📊 Trading Plan
Sell on Support Break: If price closes below the 24,650 – 24,700 support zone, consider entering a short position targeting the next strong support area near 24,400 – 24,350 .
Sell on Retest of Sideways Zone:
After breaking support, if price pulls back to retest the sideways zone (24,800 – 24,850) and shows bearish rejection signals (e.g., pin bar, bearish engulfing), this provides a good opportunity to enter or add to short positions.
⚠️Risk Management:
Stop-loss: Place above the sideways resistance area, around 24,860 – 24,870 , to avoid false breakouts.
Take profit: Consider partial profit-taking near 24,650 – 24,700 and final targets around 24,400 – 24,350.
Wait for Confirmation: Avoid entering trades without clear support breaks or bearish rejection signals to minimize risk.
Please like and comment below to support our traders. Your reactions will motivate us to do more analysis in the future 🙏✨

AUDCAD: Trend ContinuationThere's a trend continuation opportunity present on the AUDCAD pair. Here's my breakdown by timeframe.
Daily Timeframe:
Price pulled back and held supported at EMA20, which isn't a strong indication of support
Strong uptrend is indicated by EMA20 above EMA60
H1 Timeframe:
There's confluence here where Price is exiting the EMA20/60 band
EMA20 also remains above EMA60 for a strong uptrend
Pricing breaking DTL also remains valid as there was upside momentum

XAUUSD Setup: Overbought Conditions Signal a Potential Pullback!OANDA:XAUUSD Price is approaching a key resistance zone at the upper boundary of the ascending channel. This boundary often acts as a natural barrier where the market tends to slow down or reverse. As price reaches the channel top, the probability of a correction increases as profit-taking pressure builds.
If a correction unfolds, the 3,715 USD level will be the key support to watch. The resilience of buyers around this zone will determine whether the uptrend can extend further and push prices beyond previous highs. On the other hand, if 3,715 is broken, the market could shift direction with price sliding deeper toward the lower boundary of the channel and temporarily putting buyers at a disadvantage.
What matters most now is not rushing into trades but observing carefully. The market always leaves clues through price action, candlestick formations and trading volume. When these elements align, confirmation becomes stronger and that is the moment when a setup carries real weight. Above all, risk management remains essential because it is the shield that allows traders to withstand uncertainty and seize opportunities with confidence.
Good luck and trade safe!

BITCOIN Bullish Breakout! Buy!
Hello,Traders!
BTCUSD reclaims key horizontal level after liquidity sweep, signaling strength. Breakout confirms bullish intent with Smart Money driving price toward 114,341 target to fill imbalance overhead. Time Frame 3H.
Buy!
Comment and subscribe to help us grow!
Check out other forecasts below too!
Disclosure: I am part of Trade Nation's Influencer program and receive a monthly fee for using their TradingView charts in my analysis.

ETH Analysis: Deeper Pullback in PlayETH is still trading within a broader uptrend channel, but recently, the price has started to pull back after a significant rally. After pushing up too far, the market is now taking a breather and recalibrating.
From a technical standpoint, this pullback is completely normal and healthy after such a strong move. Pullbacks like this are part of any bullish trend, providing the market a chance to reset. If the pullback continues, the next target could be the 3,600 support area, where multiple key factors converge: horizontal support, trendline support, and the 0.618 Fibonacci retracement level.
The 3,600 level is crucial. If ETH holds strong here and shows signs of a reversal, it could be a solid entry point for the next leg up. However, if the price breaks below this level, we may see deeper downside, and the current bullish structure could start to break down.
As always, confirm your setups before entering and make sure your risk management is solid. Stay alert for the next opportunities!

EUR/USD is poised for a significant moveHey everyone, it's Ken here!
Looking at the EUR/USD chart on the H2 timeframe, I have to say, things are looking pretty solid. The price is moving around, but notice how it's climbing slowly and steadily. This tells me the buyers are getting active and feeling bullish.
That said, I'm not jumping in just yet. I'm waiting for confirmation before making a move. My target is a buy towards 1.1880, but I want to see the price pull back to the level I’ve marked first.
Once it does, I’ll be keeping an eye out for volume increases and a solid candlestick pattern to confirm it's go-time.
What do you guys think? Drop your thoughts in the comments, I’d love to hear what you think!

NZD_CHF SWING BEARISH BREAKOUT|SHORT|
✅NZD_CHF broke the key
Structure level of 0.4640
While trading in an local
Downtrend, which makes me
Bearish biased, and and I think
That after the retest of the
Broken level is complete,
A bearish continuation will follow
SHORT🔥
✅Like and subscribe to never miss a new idea!✅

NZD_USD BEARISH BREAKOUT|SHORT|
✅NZD_USD price breaks key support zone, confirming bearish orderflow. Smart Money shows breakout with liquidity run, targeting lower demand near 0.5810 as sellers take control after structure shift.
SHORT🔥
✅Like and subscribe to never miss a new idea!✅

$JZXN - Jiuzi Holdings - $4 PTNASDAQ:JZXN jumped from $0.78 to $3.13 going into today's trading session. Looking for support at the $2.53 to push and hold above the $3 Price Levels to push on to our $4 PT.
This comes after announcing a new Chief Financial Officer and beginning a $1B Investment Strategy into Crypto

NZD_JPY FREE SIGNAL|SHORT|
✅NZD_JPY is going down currently
As the pair broke the key structure level around 86.600
Which is now a resistance, so we are bearish
Biased and therefore we can enter a following short trade:
Entry: 86.500
Stop Loss: 86.700
Take Profit: 86.100
SHORT🔥
✅Like and subscribe to never miss a new idea!✅

GBPNZD Trade AnalysisCMCMARKETS:GBPNZD
---
📊 GBPNZD Trade Analysis
**Technical Outlook (Weekly & Daily):**
* **Resistance Zone:** 2.30 is a major pivot, coinciding with a resistance that dates back to Nov 2009 continuation cell.
* **Support Levels:**
* Immediate: 2.22 (near-term take-profit level).
* Stronger: 2.18–2.14 (historical resistance turned support in 2016).
* Extended: 2.09, 2.02, 1.97 (if bearish momentum sustains).
* **Alternative Upside Scenario:** If price decisively breaks above 2.30, the path opens to 2.36 → 2.46 → 2.52 (previous highs).
**Psychological Levels:**
* **2.30:** A psychological round number where markets tend to slow before breaking direction. Either strong rejection → sell-off, or breakout → bullish continuation.
* **2.20 handle:** Also a magnet level if bearish continuation gathers steam.
**Fundamental Outlook:**
* **GBP:** Weak momentum; growth and inflation concerns may keep GBP capped. BoE stance likely cautious.
* **NZD:** Relatively stronger outlook if RBNZ maintains hawkish bias or data surprises positively. NZD strength supports downside in GBPNZD.
* **Macro Risk:** Any global risk-off event could weigh on NZD (commodity-linked, risk currency), which would blunt the bearish bias.
---
### 🎯 Playbook (Your Setup)
* **Entry:** 2.30 (short bias at rejection).
* **Stop Loss:** 2.33 (clear invalidation above resistance).
* **Take Profit 1:** 2.22 (short-term support).
* **Take Profit 2:** 2.18 (historical breakout retest).
* **Extended Targets:** 2.09 → 2.02 → 1.97 (if momentum sustains).
**Alternative Scenario (Bullish Breakout):**
* Above 2.30 → upside targets at 2.36 → 2.46 → 2.52.
* This would invalidate immediate short bias.
---
### 🧮 Risk–Reward
* From 2.30 short to 2.22 → **Risk 300 pips / Reward 800 pips ≈ 1:2.6 R\:R**.
* Extended to 2.18 → **1:4 R\:R**.
* Extended downside to 2.09+ → >1:7 R\:R.
* Attractive skew provided resistance holds.
---
✅ **Summary:**
* Strong bearish case if 2.30 holds as resistance.
* Fundamentals lean slightly in favor of NZD, which supports bearish GBPNZD bias.
* Psych level 2.30 is the battleground — rejection = bearish play, breakout = bullish extension.
