$SLE - Super League - $13.97 Retest?NASDAQ:SLE broke out from $3.20 in yesterday’s trading session and continued to $13.98 after announcing a private placement and investment from Evo Fund
Breakout!

NZDCAD: Weak Bearish SignalThis pair is interesting, but must be approached with caution.
Daily Timeframe:
Price crosses below HTL, but the overall daily price action is quite chaotic so should proceed with caution
H1 Timeframe:
Price fails to make a new higher high on the intraday timeframe, which is a good sign that this uptrend is weakening
There's also greater confluence with the overall downtrend as price crosses below ATL
Another indication of downtrend is price below EMA20 and EMA20 is pushing below EMA60

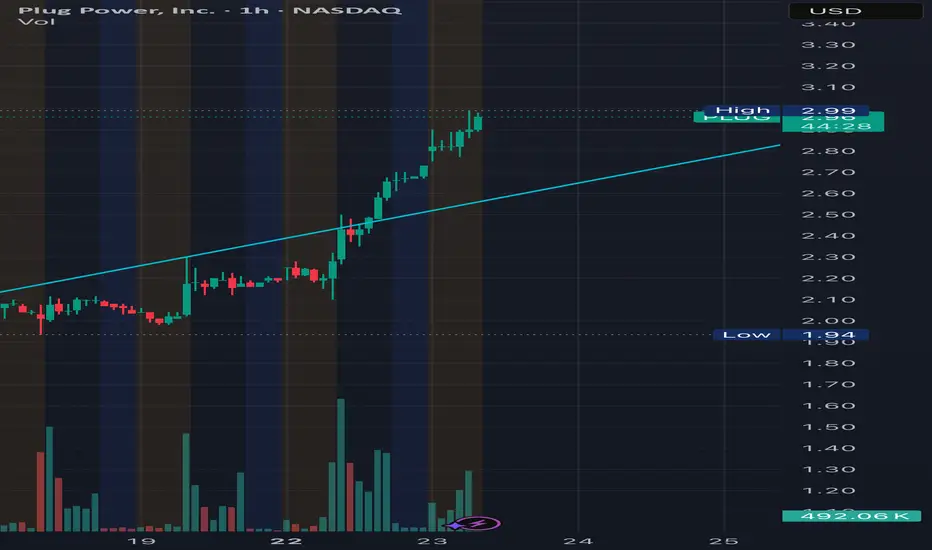
$PLUG - Plug Power - $3.49 PTNASDAQ:PLUG broke out from $1.41 and currently projecting a $3.40 PT after announcing it will be offering over 185 million shares at a $2.00 exercise price, will remain valid until March 2028.
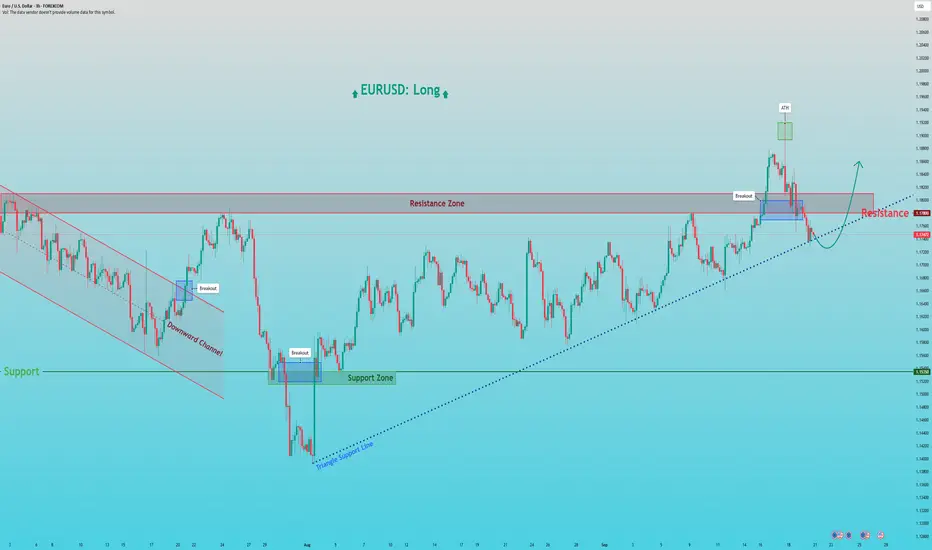
EURUSD: Dip and Bounce from Triangle SupportHello everyone, here is my breakdown of the current Euro setup.
Market Analysis
After reversing from a prior Downward Channel, EURUSD has been consolidating in a large Upward Triangle. This pattern is typically bullish and is defined by a flat horizontal Resistance at the 1.1780 level and an ascending support line, showing that buyers are becoming progressively more aggressive on each dip.
An interesting part of this pattern's history is the 'fake breakout' we saw previously, where the price spiked to a local ATH at 1.1920 before falling back inside. Currently, the price is again in a corrective pullback, heading towards the ascending Triangle Support Line for another test.
My Scenario & Strategy
My scenario is based on the expectation that this Upward Triangle will eventually resolve to the upside. I'm looking for the price to complete its downward movement and find strong support on the ascending Triangle Support Line. A confirmed bounce from this line would be the key signal that buyers are stepping in to defend the trend.
Therefore, the strategy is to watch for this bounce. A successful rebound that finally leads to a decisive breakout above the Resistance Zone would validate the long scenario. The primary target for the subsequent expansion is 1.1860, a logical objective for the move that would follow.
That's the setup I'm tracking. Thank you for your attention, and always manage your risk.
Bitcoin will Retest Support Before the Next Leg UpHello traders, I want share with you my opinion about Bitcoin. The market structure for Bitcoin has seen a significant shift from bearish to bullish, following a strong reversal from the 109300 - 110000 buyer zone. This pivotal move led to a breakout from a prior downward wedge, invalidating the bearish trend and establishing the current, well-defined upward channel. The price action for BTC has since been constructive, creating a series of higher highs and higher lows within the boundaries of this new channel. Currently, the asset is undergoing a healthy corrective phase after being rejected from the highs, and the price is now trading at a critical inflection point, close to the ascending support line of the channel. In my mind, this pullback represents a classic trend-continuation opportunity. I expect that the price will bounce from the channel's ascending support line. I think this rebound will have enough momentum to break through the 117500 Resistance Level and continue its rally towards the major seller zone. Therefore, I have placed my TP at 119500. Please share this idea with your friends and click Boost 🚀
Disclaimer: As part of ThinkMarkets’ Influencer Program, I am sponsored to share and publish their charts in my analysis.

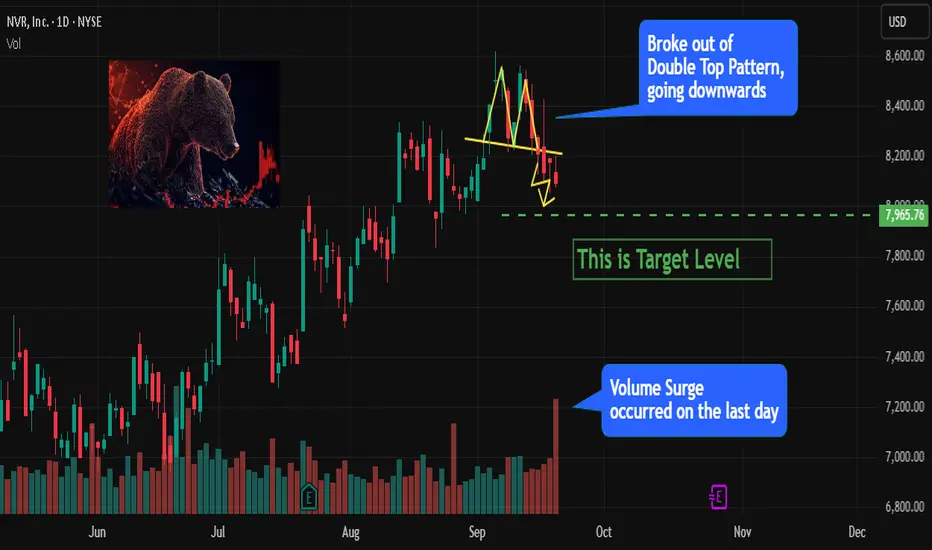
NVR Breaks Down from Double Top - Bearish Outlook Ahead1. Double Top Breakdown
NVR has recently broken down from a Double Top pattern .
This classic reversal structure indicates a shift from bullish to bearish sentiment.
2. Volume Confirmation
The breakdown was accompanied by a strong surge in volume on the last trading day .
High volume confirms strong selling interest and increases the reliability of the move.
3. Bearish Momentum Building
Sellers have taken control after the failed attempt to sustain recent highs.
Price action shows increasing downward momentum with little sign of reversal yet.
4. Downside Potential
With breakdown of the Double Top pattern and heavy volume, NVR shows strong downward potential .
Further weakness is likely if selling pressure continues in the next sessions.
5. Technical Confluence
Breakdown of a major reversal pattern (Double Top).
Strong volume confirming the bearish move.
All factors point toward extended downside.
GBPNZD: Trend ContinuationMomentum is picking again on the GBPNZD pair. Here are my observations on the daily and H1 timeframes.
Daily Timeframe:
HTL marks a resistance turned support
Price is also exiting the EMA areas, which is an indication of momentum
H1 Timeframe:
Price shows momentum as it crossed above the DTL
Price shows confluence with higher timeframe trend as it holds above EMA20
Uptrend is signaled by EMA20 remaining above EMA60

AVAX — 220-Day Range Broken, Next Stop $35?After 220 days of consolidation, AVAX has finally broken out of its trading range. The key resistance at $27 was cleared, and price quickly pushed into the $30 psychological level, where it faced rejection. Currently, AVAX is consolidating just below, around $29.
So, what’s next? Now all eyes are on the retest to confirm $27 as the new launchpad.
Support Confluence (Long Entry Zone)
3M/Quarterly level: $27.71 → major support
0.382 Fib retracement: $27.65 (low $23.87 → $30)
0.5 Fib retracement: $26.93 → perfectly aligned with $27 zone
Swing High: $27.38 → could be retested
4H 21 EMA: $27.71
4H 21 SMA: $27.41
Weekly VWAP: $27.41
Fair Value Gap (FVG): imbalances in this zone
📌 With all these layers of confluence, the $27.7–$27.4 zone is the ideal long entry area.
Resistance Confluence (Take Profit Zone)
0.5 Fib retracement of the entire downtrend: $35.22
15B Market Cap resistance: $35.5
Yearly Open: $35.7 → major target
3M/Quarterly level: $35.71
TPO resistance cluster: $35.22–$37.28
📌 Together, these levels form a stacked resistance zone at $35–$37, making it both the ideal take-profit area and a potential short setup.
Zoomed-Out View:
TPO Chart Reference:
🟢 Long Trade Setup
Entry Zone: $28.0 → $27.4 (DCA best approach)
Stop-Loss: Below $26 (to be adjusted after reversal confirmation)
Take Profit: $35
Potential Gain: +25%
R:R: 1:4+
Technical Insight
After 220 days of sideways compression, the breakout above $27 marks a shift in market structure.
A retest of this level would validate it as new support and provide a high-probability swing long setup.
The $35–$37 zone, reinforced by the yearly open at $35.7, stands out as the major resistance cluster, making it both the ideal profit target and a potential reversal area.
Key Levels to Watch
Support Zone: $28–$27
Resistance Zone: $35–$37
🔍 Indicators used
DriftLine — Pivot Open Zones → For identifying key yearly/monthly/weekly/daily opens that act as major S/R reference points
Multi Timeframe 8x MA Support Resistance Zones → to identify support and resistance zones such as the 4H 21 EMA/SMA.
➡️ Available for free. You can find it on my profile under “Scripts” and apply it directly to your charts for extra confluence when planning your trades.
_________________________________
💬 If you found this helpful, drop a like and comment!

GBP-JPY Bearish Breakout! Sell!
Hello,Traders!
GBP-JPY made a bearish
Breakout of the rising
Support line and now
Made a retest of the new
Rising resistance and made
A pullback so we are
Bearish biased and we
Will be expecting a
Further bearish move down
Sell!
Comment and subscribe to help us grow!
Check out other forecasts below too!
Disclosure: I am part of Trade Nation's Influencer program and receive a monthly fee for using their TradingView charts in my analysis.

Hype's path to $55BYBIT:HYPEUSDT.P is currently forming a wedge shape pattern, is it indicating that it will break out and follow Path A, the blue path? I'm not so sure, I am sure we'll hit $55 either way.
If we take the red path, Path B, we'll come down to some heaviy support which could give us the fuel needed to get to $55
Out of all of the oscillators I was using, all except the chop zone on the daily mind you, were in bearish mode. So logically one would choose the red Path B right?
I can't wait to see how this plays out, shall we dip some and buy some more BYBIT:HYPEUSDT.P on Path B or experience more of a continuation of the current trendline to $55?
Let me know what you think in the comments, that'ls all for today, let's go HYPE!!! straight to $55!

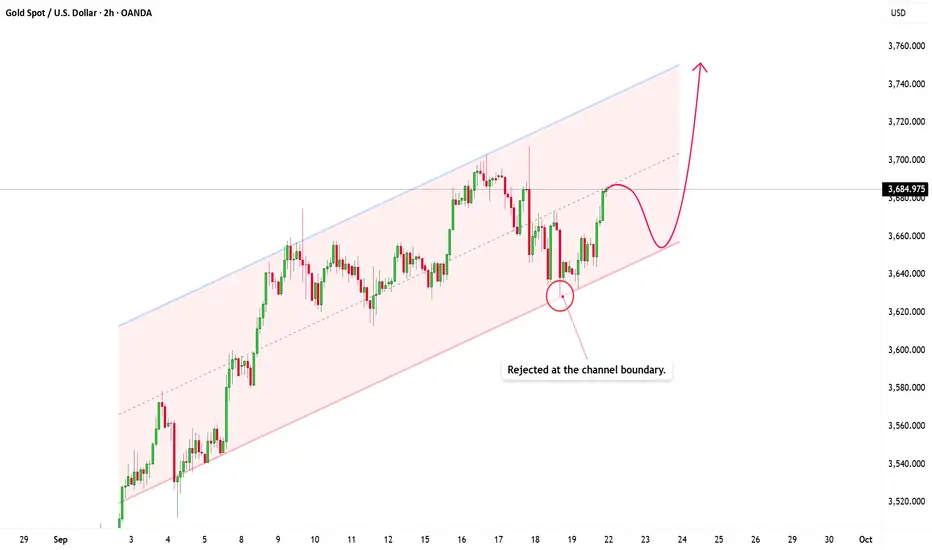
Gold's Next Move: Is a Breakout Imminent?Looking at the XAUUSD chart, I’m finding it quite fascinating.
Here’s the situation: XAUUSD is moving within an upward parallel channel, respecting the market structure perfectly, and we’re starting to see early signs of renewed buying interest right after a strong rejection from the support zone.
Currently, price is trading near a key resistance zone, and this is where the market gets interesting. At this resistance zone, there's a high likelihood of a short-term correction within the price channel. If price holds within the channel, the uptrend could continue, and the upper channel boundary might even be broken, extending the upward momentum further.
I’m targeting the upper boundary of the channel, and given the market context, this is entirely possible.
Keep in mind that, in a channel like this, trading with the trend is generally more favorable than fighting against it. Until the channel is broken, the bulls are still in control.
Do you agree? Feel free to share your thoughts in the comments below!
BTCUSD Short Setup After Trendline BreakBTCUSD just made a decisive break below the main trendline, a clear signal that bearish momentum is building. Sellers have stepped up, and the tone of the market has shifted — control is now in their hands.
In the short term, I’m watching for a retest of the broken level. What used to be support may now act as resistance. If buyers can’t push price back above that zone, it confirms weakness and opens the door for continuation lower, with 112,000 as the next key target.
Traders should keep an eye on bearish signals like rejection wicks, bearish engulfing candles, or strong sell volume. A clean reclaim above resistance would invalidate the bearish bias, but until then, sellers remain in control. Let’s see how this unfolds.

EURUSD Long: Rally Continues in Ascending ChannelHello, traders! The prior price auction for EURUSD was dominated by a wide consolidation range, bounded by the demand zone 2. Within this range, a new bullish structure began to form as an ascending channel, which eventually gathered enough momentum to break out and confirm a new uptrend, shifting market control to the buyers.
Currently, the price action continues to be guided by this ascending channel. Following a recent test of the upper price levels, the market has entered a corrective phase. The auction is now pulling back towards a significant confluence of support, located near the 1.1740 DEMAND level, which also aligns with the channel's dynamic support line.
My scenario for the development of events is a continuation of the uptrend after this correction completes. I expect the price to find strong support at the confluence of the channel's demand line and the 1.1740 - 1.1760 DEMAND ZONE. In my opinion, a confirmed bounce from this area will signal the end of the pullback and trigger the next impulsive move higher. The take-profit is therefore set at 1.1865, an intermediate target within the channel's structure. Manage your risk!

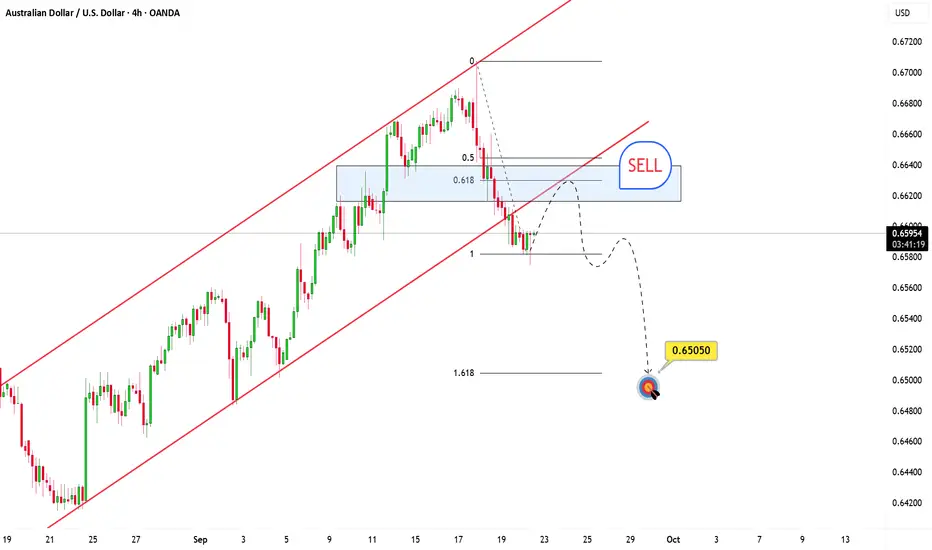
AUDUSD keeps showing weakness after that latest dropHey everyone, Ken here!
Right now, AUDUSD is shaping up into a textbook bearish setup. Price has broken through a key support level and is already showing early signs of selling pressure taking control. Following the breakdown, the market is pulling back to retest that broken zone, a classic move that often confirms continuation to the downside.
Given this technical backdrop, I don’t expect price to reclaim that old support, which now acts as resistance. A clean rejection from this area could trigger the next leg lower, with a projected target around 0.65050, perfectly aligned with the 1.618 Fibonacci extension.
What’s your take on this setup?
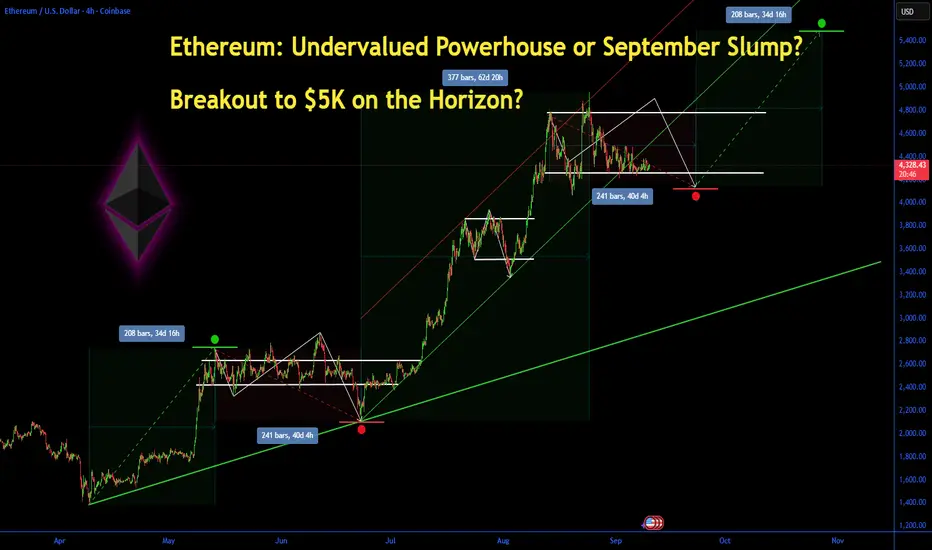
Ethereum: Undervalued Powerhouse or September Slump? Ethereum: Undervalued Powerhouse or September Slump? Breakout to $5K on the Horizon?
Ethereum (ETH) has held steady around $4,300 this month amid a choppy crypto market, down about 15% from its August all-time high but showing resilience with a modest 0.52% gain today to $4,328.5. Early September saw over $500 million in outflows from spot Ethereum ETFs, reversing summer inflows and fueling doubts about institutional appetite.
Yet, with analysts eyeing a potential rally to $9,000–$12,000 by year-end 2025 driven by ETF rotation and broader adoption, is ETH the undervalued blue-chip crypto ready for a rebound, or will seasonal weakness cap its upside? Let's dive into the fundamentals, charts, and key levels to navigate this pivotal moment.
Fundamental Analysis
Ethereum's core drivers remain tied to its ecosystem growth and macroeconomic tailwinds, but recent ETF flows have introduced volatility. As the backbone for DeFi, NFTs, and layer-2 scaling, ETH benefits from rising staking rewards and network upgrades like Dencun, which have boosted efficiency.
Analysts project ETH could hit $5,194 by late September, with long-term forecasts up to $12,000 in 2025 if institutional demand surges via ETFs. However, sticky inflation and Fed policy uncertainty could delay rate cuts, pressuring risk assets like crypto.
- **Positive:**
- Record ETF inflows in July–August signal growing institutional interest; recent positive territory returns hint at rotation back to ETH.
- Staking growth and adoption in DeFi (e.g., Aave, Uniswap) underscore undervaluation, with ETH's market cap at ~$520 billion versus Bitcoin's dominance.
- Broader trends like AI-blockchain integration and regulatory clarity (e.g., potential spot ETFs for challengers like Sui) bolster ETH's utility.
- **Negative:**
- $500M+ ETF outflows in early September reflect profit-taking and risk-off sentiment amid U.S. labor market weakness.
- Seasonal September weakness in crypto, compounded by geopolitical risks, could extend the correction if Bitcoin falters.
Technical Analysis
On the daily chart, ETH is coiling in a tight symmetrical triangle pattern after bouncing from the $4,320–$4,325 support base, with volume picking up on the upside. This consolidation follows a descending channel breakdown, but the hold above key EMAs suggests building momentum for a potential impulse wave higher. Current price: $4,328.5, with VWAP at $4,300 providing intraday support.
Key indicators:
- **RSI (14-day):** Hovering at 48, neutral but nearing oversold territory— a dip below 40 could signal a strong bounce. 📈
- **MACD:** Histogram in negative territory, but the signal line crossover is imminent, hinting at bullish divergence if volume confirms. ⚠️
- **Moving Averages:** Price above the 21-day EMA ($4,280) but testing the 50-day SMA ($4,350)—a sustained hold here avoids short-term bearish pressure.
Support/Resistance: Firm support at $4,320 (recent low and 200-day EMA), with major resistance at $4,500 (August high). Patterns/Momentum: The triangle apex nears; a bullish breakout above $4,500 could target $4,800–$4,952, while failure risks a retest of $4,200. 🟢 Bullish signals: Accumulation on hourly charts. 🔴 Bearish risks: Death cross if 50-day SMA flips below 200-day.
Scenarios and Risk Management
- **Bullish Scenario:** A clean break above $4,500 on ETF inflow news or positive macro data (e.g., softer PCE) targets $4,800 initially, then $5,000–$9,000 by Q4. Buy on pullbacks to $4,320 support for optimal entry.
- **Bearish Scenario:** Drop below $4,320 eyes $4,200 (psychological level); a full death cross could accelerate to $3,800. Avoid longs if Bitcoin slips under $60K.
- **Neutral/Goldilocks:** Range-bound $4,200–$4,500 if data remains mixed, ideal for scalping or options plays.
Risk Tips: Set stops 2–3% below support ($4,200) to cap losses. Risk no more than 1–2% of portfolio per trade. Diversify with BTC or stablecoins to hedge crypto correlations—avoid overexposure in this volatile September.
Conclusion/Outlook
Overall, a bullish bias emerges if ETH reclaims $4,500 and ETF flows reverse, positioning it as an undervalued play with 100%+ upside potential into 2025 amid institutional rotation.
But watch today's crypto volatility and upcoming Fed signals for confirmation—this fits the classic September Effect of weakness before Q4 rallies. What's your take? Bullish on ETH's rebound or sitting out the slump? Share in the comments!
SEI — Triangle Pattern Breakout Ahead?SEI has been consolidating in a symmetrical triangle for the past 78 days, now reaching the apex, signaling that a big move is coming soon.
Price has been trading between two anchored VWAPs:
From the $0.13 low → acting as support (currently ~$0.27)
From the ATH → acting as resistance (currently ~$0.365)
The POC of the 280-day trading range sits at $0.287, a key pivot level to watch.
Support Confluence
Anchored VWAP (from $0.13 low): ~$0.27 (long entry zone already tested)
POC (280-day range): $0.287 → key stop-loss reference
Symmetrical triangle breakout retest: ~$0.33 → potential re-entry after breakout
Fib Speed Resistance Fan 0.618: ~$0.27 → reinforcing support at the anchored VWAP
Resistance Confluence
0.618 Fib retracement: $0.5044 → aligns with $0.5 key level
3B Market Cap resistance: ~$0.505
Fair Value Gap (FVG): sitting around $0.5
Trend-Based Fib Extension 1.0: $0.5 → major target confluence
🟢 Long Trade Setup
Entry Zone: Retest around $0.33 after breakout
Stop-Loss: Below $0.287 (POC), to be adjusted after seeing a clear reversal sign.
Target (TP): $0.50
Potential Gain: ~+50%
Timeframe: Could take ~1 month to play out
Technical Insight
SEI has been compressing for over two months, and volatility is about to expand.
The ideal entry at $0.27 (anchored VWAP support) has already triggered.
The next opportunity lies in a triangle breakout + retest around $0.33.
The $0.50 level stands out as a high-confluence target, combining Fib levels, market cap, FVG, and extension symmetry.
_________________________________
💬 If you found this helpful, drop a like and comment!
AEVO — 230 Days of Accumulation, Breakout AheadAEVO has been consolidating for the past 230 days in what looks like a Wyckoff accumulation between the 100M–150M market cap range. AEVO is now on the verge of breaking its long-term bear trend.
🟢 Long Setup Idea
Entry Zone: $0.13–$0.12
Stop-Loss: Below $0.11
Target: ~$0.35
Key Resistance Levels
Yearly Dynamic VWAP → $0.1384 → current resistance / key S/R zone
Anchored VWAP (Dec 7, 2024 high at $0.6549) → ~$0.17 → key resistance in confluence with the key highs → A clean break above this = bullish
150M Market Cap → $0.164 → major breakout level
Once cleared, significant upside potential opens up.
Higher Timeframe Targets
$0.35 Zone → Primary long target (POC of the 2024 trading range, yearly Open at $0.3614, 0.5 Fib retracement of the downtrend at $0.359)
$0.43 Zone → 0.618 Fib retracement of the downtrend, in confluence with the 400M market cap
$0.50 Zone → Anchored VWAP resistance + psychological level
$0.53 Zone → 0.786 Fib retracement
$0.55 Zone → 500M market cap resistance
Key Levels
Support → $0.12–$0.13
Resistance → $0.1606–$0.17 → $0.35 → $0.43–$0.55
🔍 Indicators used
DriftLine — Pivot Open Zones → For identifying key yearly/monthly/weekly/daily opens that act as major S/R reference points
➡️ Available for free. You can find it on my profile under “Scripts” and apply it directly to your charts for extra confluence when planning your trades.
_________________________________
💬 If you found this helpful, drop a like and comment!

EURAUD: Counter-Trend TradeNot my conventional signal as this one is looking to trade in the opposite of the trend.
Daily Timeframe:
EMA20 is barely below EMA60 > downside momentum might pick up
Price is barely crossing below EMA20 > another indication of downside momentum
Price crossed below ATL, pulled back, and now seems to be continuing lower
H1 Timeframe:
Price crosses below ATL > first indication of uptrend failing to continue
Note that EMA20 is above EMA60 still > there is a risk that this will trap sellers

XAUUSD Long: Path to $3715 After Successful RetestHello, traders! The price auction for XAUUSD has been developing within a well-defined upward wedge for some time. This bullish structure has guided the price higher through a series of higher highs and higher lows, with the demand zone 2 at 3575 acting as a key pivot point low for the formation, establishing the underlying uptrend.
Currently, the auction has reached a critical stage after a strong impulse resulted in a breakout above the key horizontal demand level at 3665. This move shows strong bullish initiative, but such breakouts are often followed by a retest to confirm their validity before the next major leg up.
My scenario for the development of events is based on this breakout being successful. I expect the price to make a corrective pullback to retest the broken 3665 demand level from above. In my opinion, if this former resistance holds as new support, it will be a strong confirmation of the bullish trend. This should trigger a continuation of the rally towards the upper resistance line of the wedge. The take-profit is therefore set at 3715, just below this upper boundary. Manage your risk.

EUR_NZD BULLISH BREAKOUT|LONG|
✅EUR_NZD is going up
Now and the pair made a bullish
Breakout of the key horizontal
Level of 2.0000 and the breakout
Is confirmed so we are bullish
Biased and we will be expecting
A further bullish move up
LONG🚀
✅Like and subscribe to never miss a new idea!✅

ACE ANALYSIS🔮#ACE Analysis 💰💰
#ACE is trading in a symmetrical triangle in a weekly time frame and breakouts with high volume and we could see a bullish momentum in #ACE. Before that we will see little bit retest and then bullish movement
🔖 Current Price: $0.5745
⏳ Target Price: $0.8548
⁉️ What to do?
- We can trade according to the chart and make some profits in #ACE. Keep your eyes on the chart, observe trading volume and stay accustom to market moves.💲💲
#ACE #Cryptocurrency #Pump #DYOR

Archer (ACHR) Bullish Pennant Breakout?I love this chart setup so wanted to share. It has a little bit of everything from market structure, fib levels, pattern recognition, falling wedges.. a bullish backdrop for tech, speculative plays, and the air transportation sector in particular.
Archer's top competitor is $JOBY. They have been performing amazing as of late, experiencing all time highs, even. During the last few months though I have watched NYSE:ACHR closely looking for an opportunity to diversify and buy up some real estate. Now is looking like a decent time to start accumulating for a swing trade in my humble opinion.

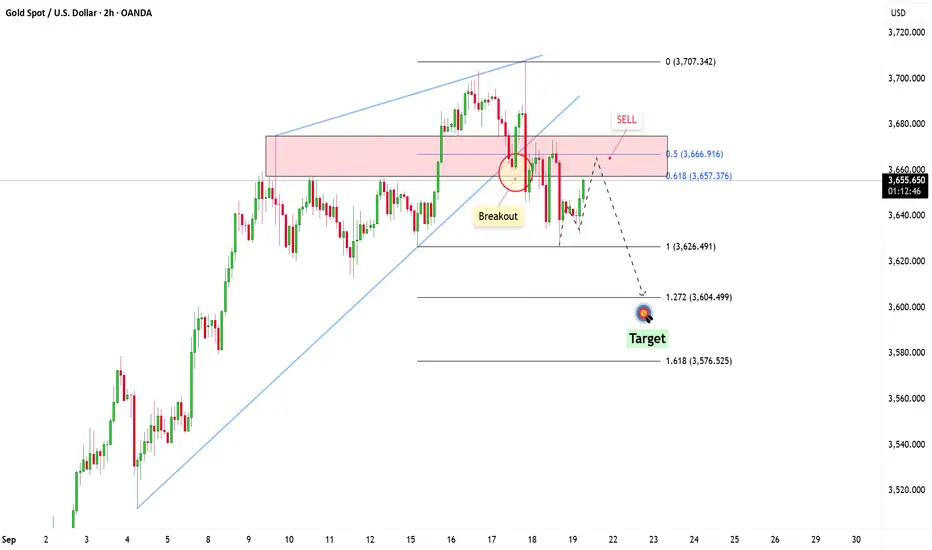
Gold Faces Major Resistance: Is a Sharp Decline Imminent?Hey everyone, looking at XAUUSD today, I noticed something quite interesting. Gold has reached an important resistance level, one that in the past has acted as a strong barrier, pushing the price down. This area has also been a strong supply zone, where sellers have previously taken control of the market. Therefore, it becomes a "hot" spot for those looking for shorting opportunities.
If the price starts showing bearish signals, such as rejection wicks, bearish candlestick patterns, or signs of weakening buying pressure, I think there's a good chance we could see a drop towards 3,604, and possibly even lower to 3,5XX if the selling pressure remains strong. However, if the price breaks this resistance clearly, the bearish outlook might be invalidated, and we could see a further rally.
This is just my personal view on the support and resistance levels, not financial advice. Always double-check your signals and ensure proper risk management.
Good luck with your trades!