BTCUSD: Bullish Pressure Targets the $94,000 Resistance AreaHello everyone, here is my breakdown of the current BTCUSD setup.
Market Analysis
Bitcoin remains in a broader recovery phase after breaking out of the descending wedge structure that previously guided price lower. The initial breakout from the wedge led to a strong bearish continuation, but once BTC reached the major $90,200 Support Zone, selling pressure weakened and buyers stepped in aggressively. This support area has now been defended multiple times, confirming it as a key demand zone. From this base, price formed a clear Upward Channel, signaling a short-term bullish structure with higher lows respected along the channel support.
Currently, BTC attempted to break above the $93,700 Resistance Zone, but this move resulted in a fake breakout, showing that sellers are still active at this level. After the rejection, price pulled back toward the channel support and the $92,000–$90,200 support cluster, where buyers once again defended the market. Currently, BTC is trading back inside the ascending channel and attempting to resume the upward swing toward the upper boundary. The overall structure suggests a recovery trend as long as the price holds above the main support zone.
My Scenario & Strategy
My scenario is bullish, as long as BTC holds above the $90,200 Support Zone and continues to respect the ascending channel structure. I expect price to continue climbing toward the $93,700 Resistance Zone, which remains the key short-term target for buyers. A clean and confirmed breakout above this resistance would open the way for a continuation toward higher levels near the top of the channel.
Therefore, if price reaches the resistance again and produces another strong rejection, we may see a temporary pullback back toward the mid-channel area or even a retest of support. The bullish structure remains valid as long as BTC stays above $90,200. For now, the market supports a long bias with focus on a renewed attempt toward the $93,700 resistance zone.
That's the setup I'm tracking. Thank you for your attention, and always manage your risk.
Breakout!

EURUSD BEARISH BIAS|SHORT|
EURUSD price broke structure and is now poised for a corrective retest of the inefficiency sweep before displacing lower into the target zone as liquidity beneath recent lows becomes the draw. Time Frame 1H.
SHORT🔥
✅Like and subscribe to never miss a new idea!✅

EUR-USD Bearish Breakout! Sell!
Hello,Traders!
EURUSD price broke structure inside the premium zone and is now rejecting the supply block, signalling distribution and a likely continuation lower as liquidity beneath the breakout wick becomes the next draw on price. Time Frame 3H.
Sell!
Comment and subscribe to help us grow!
Check out other forecasts below too!
Disclosure: I am part of Trade Nation's Influencer program and receive a monthly fee for using their TradingView charts in my analysis.

RIVN Massive base breakout incomingAbove 19 this will possibly enter into a massive squeeze mode,
The weekly base is enormous and we are finally breaking it.
Worth the watch

Bullish Expansion from Demand to Supply Zone .The chart shows a clean price delivery sequence moving from a Demand Zone Area toward a Strong Supply Zone, following a classic market-structure progression of trend → range → breakout → mitigation → target.
Price initially declines through a DTA (Downtrend Area) before stabilizing inside a range, where liquidity builds up. After multiple tests of the demand zone, buyers gain control, causing a strong upward trend acceleration (UTA).
A breakout occurs above the mid-range, confirming a shift from accumulation to upward expansion. Price then revisits the Buyer Zone, mitigating previous imbalances and validating the breakout. From this retest, the market rallies cleanly toward the Strong Supply Zone, where sellers finally step in.
The chart identifies two potential targets—one at the upper supply reaction level and another at the lower seller zone—showing both bullish continuation and possible pullback scenarios. Overall, the structure reflects efficient price movement with well-defined institutional levels, trend phases, and liquidity points.
If this chart helped you understand the market structure more clearly, show some support! Like the post, drop a comment, and follow the profile to get more consistent updates, smart money concepts, and high-quality trade setups.

XAUUSD Long: Channel Support Holding — Buyers Target 4,300 ZoneHello, traders! The price auction for XAUUSD has been unfolding within a clearly structured bullish progression after a period of heavy distribution inside the Supply Zone. Earlier, gold established a wide Range between the Supply and Demand areas, with multiple sharp rejections forming the top of the structure. Eventually, sellers pushed the price lower, initiating a corrective decline that developed into a well-defined Triangle Pattern, marked by a descending Triangle Supply Line and a rising Triangle Demand Line. This compression ended with a clean breakout to the upside, signaling the beginning of a new bullish phase. Following the breakout, XAUUSD formed a Pivot Point near the mid-range level, where price briefly rejected before continuing its upward trajectory. Another notable phase was the formation of an inverse Head-and-Shoulders structure, confirming buyer strength after a fake breakout below the neckline. This reversal pattern provided the foundation for the current bullish continuation.
Currently, gold is trading inside a strong Ascending Channel, respecting both channel boundaries with consistent higher highs and higher lows. The latest breakout from the mid-channel zone has kept the bullish structure intact, and after a corrective pullback to the lower channel boundary, price is attempting to resume upward movement. As long as price holds within this channel, the market dynamics favor a continuation toward the 4,300 resistance target, which aligns with the upper boundary of the channel and the previously broken structure.
My scenario for the development of events is bullish, with expectations of a rebound from the lower channel boundary followed by a continuation toward the 4,300 resistance level. In my opinion, maintaining structure within the ascending channel supports further upside as long as buyers defend the 4,110 support region below. Manage your risk!

Gold Bulls Smash Through the Flag PatternGold has climbed sharply, and after that sudden burst of momentum, the market naturally shifted into a cooling phase, forming a descending flag.
This pullback does not reflect weakness; instead, it represents a controlled pause as the market resets after a strong advance.
Sellers are attempting to push prices lower, yet the decline remains shallow. That limited retracement reveals that buyers are still firmly positioned and ready to defend the trend at every dip.
At this stage, price is breaking out of the flag with clear conviction, signaling that bullish strength is returning to the market. The breakout candle, supported by increasing volume, highlights strong market intent and renewed confidence from buyers.
With momentum building again, the next impulsive move is likely to extend toward the 4,300 target.

GBPCAD — Potential Breakout Zone / Support‑Resistance BattleGBPCAD is currently approaching a key horizontal support zone that has historically acted as a strong reversal area. Price has respected this level multiple times, indicating potential for a bullish bounce.
Bullish Scenario: If the support holds, the pair could start a significant upward move targeting recent swing highs. Traders should look for bullish candlestick patterns such as pin bars, engulfing candles, or strong rejections at the support level as confirmation of buying interest.
Momentum & Confirmation: Supporting indicators like RSI, MACD, or moving averages may provide additional confirmation of a bullish trend continuation. A rising momentum or positive divergence could strengthen the probability of a successful long setup.
Trade Considerations: Entry near the support zone can provide a favorable risk-to-reward ratio, while stops can be placed just below the support to manage risk. Monitoring volume and price action around the support can help filter false breakouts and validate the strength of the bounce.
Outlook: A confirmed bullish bounce from this zone could lead to a continuation toward higher resistance levels, offering short-term and medium-term trading opportunities. Traders should watch for any signs of trend reversal, but the current structure favors long positions.
Summary: GBPCAD shows a clear bullish setup near a critical support area. With proper confirmation and risk management, this level could offer a high-probability long trade opportunity.

SEAMEC LTD - Weekly Falling Trendline Breakout📊 SEAMEC LTD – Weekly Falling Trendline Breakout Attempt 🚀
📅 Updated: Dec 03, 2025 | ⏱️ Timeframe: 1W
CMP: ₹987.85 (+2.81%)
Ticker: NSE:SEAMECLTD
🔍 Technical Overview
SEAMEC is showing strong bullish momentum on the weekly timeframe, attempting a breakout above a 1.5-year falling trendline drawn from 2024 highs.
A strong base formation is also visible:
🟦 Demand Zone (Support Block): ₹830–₹870
Price has respected this demand zone multiple times, creating a rounded accumulation base.
📈 Current Move:
Breakout candle touching the trendline
Higher lows forming since August 2025
Volume expansion on recent bullish candles indicating accumulation
A confirmed breakout above the falling trendline could mark the beginning of a fresh medium-term uptrend.
🎯 Chart Summary
SEAMEC is showing signs of reversing its prolonged downtrend.
Breakout confirmation above ₹1,030 may open the path toward:
🎯 Targets:
₹1,120 (supply zone)
₹1,210 (swing high)
A close above the trendline with volume would validate the reversal.
⚠️ Disclaimer
This analysis is for educational and chart-study purposes only. Not financial advice. Always do your own research before trading.

BTCUSD Long: Volatility Rising — Retest of 90,000 ExpectedHello, traders! The price auction for BTCUSD has been in a corrective phase, forming a broad descending structure guided by the major Trend Line. This bearish pattern has been defined by a sequence of lower highs and lower lows, with price repeatedly getting rejected from the Supply Zone and consolidating inside the highlighted range. The market has respected both the descending supply line and the rising Demand Line, creating a well-defined compression of price action.
Currently, the auction is at a critical inflection point, with BTC retesting the Demand Line near the 85,600 demand level. After a series of volatile moves inside the range, the price is attempting to stabilize at this structural support while gradually approaching the descending trendline once again. This tightening of volatility between supply and demand suggests that a significant directional move is likely to occur soon.
My scenario for the development of events is a bullish rebound from the Demand Line, followed by a test of the descending supply line. I expect the price to attempt an impulsive breakout toward the major Supply Zone. In my opinion, a successful breakout above this zone may carry BTC toward the 92,300 resistance target marked on the chart. Manage your risk!

EURUSD: Rejection Signals Move Toward 1.15500 SupportHello everyone, here is my breakdown of the current EURUSD setup.
Market Analysis
EURUSD continues to trade inside a broader downward channel, where bearish structure remains dominant. After reaching the Resistance Zone around 1.16500, the pair formed another rejection near the descending trendline, confirming strong seller pressure and completing yet another fake breakout inside this key supply area. From there, price reversed sharply and moved back below the structure, respecting the market’s overall bearish sentiment.
Currently, EURUSD is pulling back from resistance and heading toward the Support Zone near 1.15500, which has previously acted as a significant reaction area. This zone also aligns with multiple breakout points seen earlier, making it an important liquidity region where buyers have stepped in before. Despite temporary bullish corrections, the pair remains capped under the channel resistance, keeping the downtrend intact.
My Scenario & Strategy
My scenario as long as the market stays below the descending channel’s resistance and under the 1.16500 zone, my bias remains bearish. The price is likely to continue moving toward the 1.15500 Support Zone, where the next significant reaction may occur. A clean retest of this level could initiate either a short-term corrective bounce or a continuation of the bearish trend, depending on the strength of incoming momentum.
Therefore, if the pair breaks below 1.15500, this would open the door for deeper downside movement within the channel, extending toward lower supports. However, if buyers defend this zone strongly, we may see a temporary upward correction — but any upside remains limited unless EURUSD breaks above the Resistance Zone with confirmation. For now, I expect a move toward support as sellers remain in control of market structure.
That's the setup I'm tracking. Thank you for your attention, and always manage your risk.

XAUUSD: Buyers Eye Retest of the $4,300 Resistance ZoneHello everyone, here is my breakdown of the current XAUUSD setup.
Market Analysis
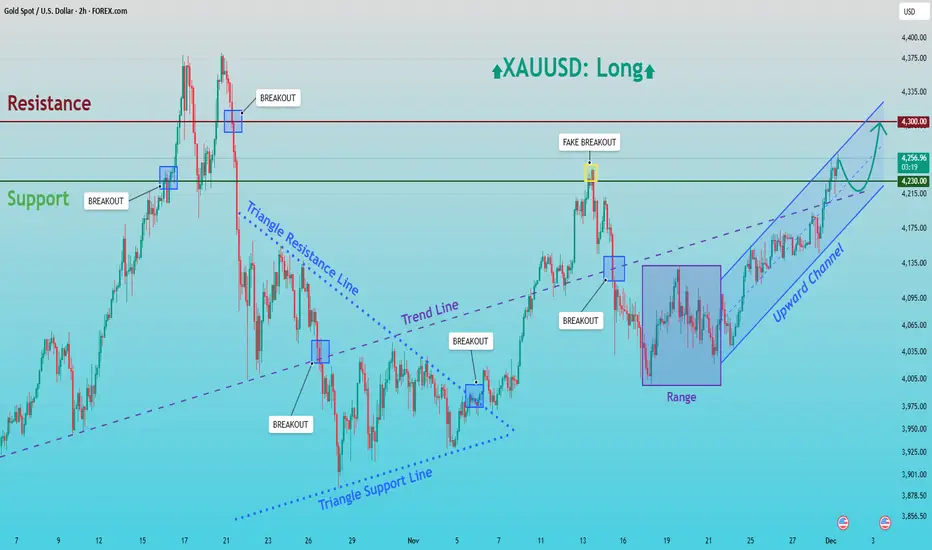
Gold continues to trade within a well-structured bullish environment following a strong recovery from the lower Triangle Support Line earlier in the month. After a prolonged corrective phase inside a symmetrical triangle, price eventually broke above the Triangle Resistance Line, shifting the market structure from consolidation into bullish continuation. This breakout created a clear trend shift, supported by a steady sequence of higher highs and higher lows. After the breakout, XAUUSD entered a temporary Range phase, suggesting accumulation from buyers before the next impulsive move. Once price broke out of that range to the upside, the market formed a clean Upward Channel, showing sustained bullish pressure. A notable fake breakout above the Resistance Zone around 4,260 occurred recently, indicating strong seller activity at the top of the zone, but buyers quickly regained control and continued to push price upward within the channel.
Currently, gold is trading near the mid-upper area of the Upward Channel, approaching the 4,300 key Resistance Zone. The broader technical picture shows clear bullish market structure, with trendline support and channel dynamics favoring further upside as long as the channel remains intact.
My Scenario & Strategy
My scenario is bullish, supported by the strong rebound within the Upward Channel and the consistent higher-low structure. As long as price remains above the 4,215–4,230 Support Zone and respects the channel’s lower boundary, buyers hold a clear advantage. My expectation is that XAUUSD may make a minor pullback toward the mid-channel zone near 4,230 to gather liquidity before continuing the upward movement.
Therefore, the primary bullish target remains the 4,300 Resistance Zone, where a retest is highly probable. A clean breakout above 4,300 would open the door for a stronger rally and signal continuation of the broader bullish cycle. However, if gold fails to break the resistance and forms a deeper correction, the Upward Channel support and the prior breakout zone at 4,215 will be key levels to watch. The bullish bias remains valid as long as these supports hold. For now, the structure favors a long scenario with attention on the move toward 4,300 and potential bullish continuation beyond that level.
That's the setup I'm tracking. Thank you for your attention, and always manage your risk.
BTCUSD Short-Term Setup: Buyers Defend Support, TP1 at $89,200Hello traders! Here’s my technical outlook on BTC/USD based on the current market structure. After reaching the Seller Zone near $92,000, the price once again faced strong rejection, forming a clear reversal right under the descending Trend Line. This confirms that sellers continue to defend this area and keep Bitcoin within a broader corrective structure. From there, BTC pulled back toward the Buyer Zone around $86,000–$85,500, which has acted as a reliable support multiple times in the recent sessions. The market is now forming a potential short-term recovery after a fake breakout below this zone, highlighting attempts from buyers to regain control. However, as long as the price trades below the Seller Zone and the descending Trend Line, bearish pressure still dominates the chart. The structure suggests that Bitcoin may attempt a move toward TP1 at $89,200, where the market previously consolidated and faced resistance. A clean rejection from the Trend Line could send the price back toward support for another test, while a confirmed breakout above $92,000 would shift short-term sentiment and open the way for stronger bullish continuation. On the other hand, a breakdown below $85,500 could expose BTC to deeper declines toward lower support lines. Please share this idea with your friends and click Boost 🚀

EURJPY Potential BEARISH SetupEURJPY
Bearish Setup
Breakout Analysis:
Distribution pattern with breakdown below key support suggests downside acceleration/momentum.
Strategy Framework:
Since the forecast calls for more downside momentum we can anticipate a corrective move towards BOS. The zone between BOS and Resistance Zone give us our POI, where we should be looking for shorts to ride the downside wave towards our targets.
Technical Analysis:
- Breakdown Level:
- Entry Strategy: Looking for Shorts at confirmed BOS level
- Stop Loss: Above Resistance zone.
Target Zones:
- Primary Target: 1 (R:R 1:2)
- Secondary Target: 2 (R:R 1:3)
- Extension Target: 3 (R:R 1:4)
Bearish Confirmations:
🔻 Rejection candlestick patterns
🔻 Bearish Reversal patterns
🔻 Impulsive moves in line with setups directional bias
IDEA INVALIDATION:
- BULLISH momentum above Resistance Zone
Position Management:
- Exit: Partial profits at targets
- Stop adjustment: Trail below resistance
LIKE or COMMENT if this idea sparks your interest, or share your thoughts below!
FOLLOW to keep up with fresh ideas.
Tidypips: "Keep It Clean, Trade Mean!"

NZD/USD — Swing Zone Key Support & Resistance for a BreakoutNZD/USD — Swing Zone Key Support & Resistance for a Breakout or Reversion
It appears to show candlesticks (or candles) over a given timeframe — each candle representing price action over a set period (the timeframe isn’t specified in the snapshot). The chart provides a visual of highs, lows, opens, and closes for that period.
If there are any indicators or overlays (e.g. moving averages, support/resistance zones, trend‑lines), they are not clearly visible in the shared snapshot — so analysis must rely on raw price action (see below).
🧠 Price Action & Structure
From the visible segment of the chart:
Trend bias: The price history seems to show swings — there may have been a recent downward move followed by some consolidation or attempt to rebound. The pattern suggests possible correction or consolidation rather than a clean, strong uptrend or downtrend.
Support and resistance zones: Given the swings, there are likely to be key price levels (swing highs as resistance, swing lows as support). Traders often draw horizontal lines at these pivots to anticipate reactions.
Volatility and uncertainty: The visible swings suggest volatility — price is not moving in a straight line, which means participants should be cautious; the market might be swinging between support and resistance rather than trending.
If you were to trade or follow NZD/USD based on this chart:
Watch for breakouts above recent swing‑high (would signal bullish momentum) or breakdowns below swing‑low (possible bearish continuation).
Use support/resistance zones — since price seems to bounce between highs and lows, trading reversals or breakouts could be viable.
Avoid entering during consolidation or “chop” — when price action is indecisive, risk is higher; wait for clearer structure or confirmation. This echoes general chart–reading best practices.

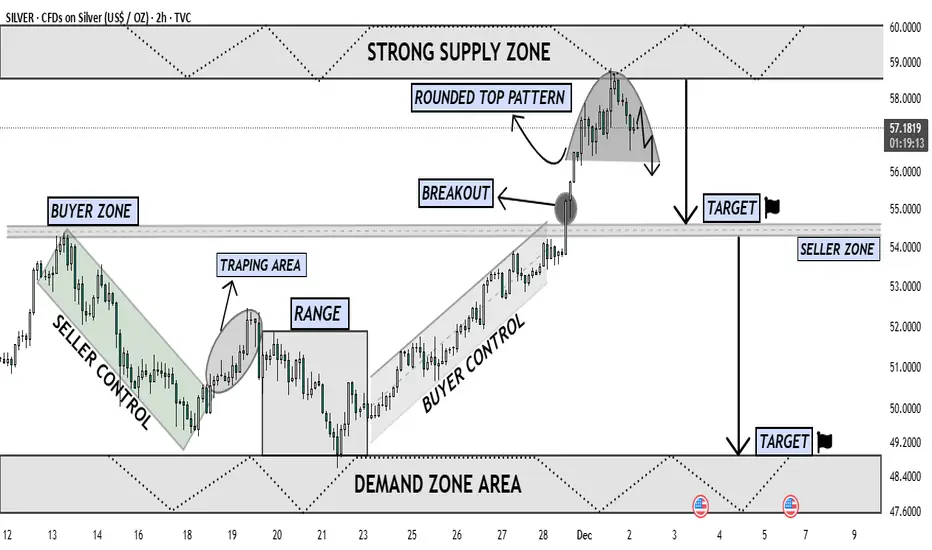
Silver Forming Major Top Near Supply Downside Retracement LikelyThe chart shows Silver reaching a major Strong Supply Zone near the 58–60 level, where price has reacted multiple times in the past. After a strong impulsive rally driven by Buyer Control, the market broke above the previous Buyer Zone, confirming bullish strength. However, once price entered the upper supply region, momentum started to fade, forming a clear Rounded Top Pattern — a classic distribution structure indicating exhaustion of buyers.
Following the breakout retest, buyers failed to continue upward, and sellers stepped in aggressively from the supply zone. The chart now shows a shift from buyer dominance to seller pressure, with price beginning to curve downward inside the rounded top. This shape reflects decreasing highs, weakening demand, and early reversal signals.
The projected move suggests that once the neckline of the rounded top breaks with strong bearish candle confirmation, price is likely to fall toward the first Target Zone around 54, which aligns with the Seller Zone and previous breakout structure. If bearish continuation remains strong, the next logical target lies in the Demand Zone Area between 48–49, where liquidity is expected to support a potential reversal or consolidation.
Overall, this chart indicates a high-probability corrective phase, with sellers preparing to reclaim control as the market rejects the supply zone and transitions into a deeper pullback phase. Buyers must show strong defense at the mid-support; otherwise, Silver could decline further toward the lower demand region.
ASIA: BO/MTime: 20:15 GMT
4H Setup: REV/IBM
4H Confluences: EMA13, RSI reversal break, Weekly Level
15m Setup: BO/M
15m Confluences: EMA13, EMA89, EMA Cross
Target: 2R Bread & Butter

ETHUSDT Major breakout and pump may happen soonA decisive breakout above the $3,100 level for Ethereum would represent a significant technical milestone, potentially heralding the beginning of a new bullish phase. Such a move, particularly if validated by sustained volume and a daily close above this key resistance, could initiate a strong upward impulse with an initial technical target near the $5,000 zone, aligning with measured move projections from the recent consolidation structure.
It is important to emphasize that a confirmed breakout of the prevailing channel resistance is a prerequisite for this bullish scenario to unfold. Based on current technical structure and momentum indicators, we assess the probability of such a breakout occurring in the near term at approximately 70%, though traders should await clear confirmation before positioning for extended upward movement.
DISCLAIMER: ((trade based on your own decision))
<<press like👍 if you enjoy💚

GBPUSD BEARISH BIAS|SHORT|
✅GBPUSD Price is breaking below the supply zone after taking out local internal liquidity, showing a clean shift in orderflow toward downside imbalance. With the breakout confirmed, price is likely to seek the inefficiency below and draw toward the target level.
SHORT🔥
✅Like and subscribe to never miss a new idea!✅

GBP-USD Bearish Breakout! Sell!
Hello,Traders!
GBPUSD has broken structure beneath the horizontal supply and is now trading below a key distribution zone. A bearish continuation is likely as liquidity from late buyers gets exposed, targeting the clean draw below current lows. Time Frame 3H.
Sell!
Comment and subscribe to help us grow!
Check out other forecasts below too!
Disclosure: I am part of Trade Nation's Influencer program and receive a monthly fee for using their TradingView charts in my analysis!

EURUSD Uptrend Intact: Price Approaches Major 1.1650 ResistanceHello traders! Here’s my technical outlook on EUR/USD based on the current market structure. After breaking out of the Buyer Zone near 1.1600–1.1610, the price pushed higher and re-entered the ascending channel, continuing to form higher highs and higher lows along the channel’s Support Line. Buyers managed to defend the zone after a fake breakout, confirming strong demand within this area. Currently, EUR/USD is approaching the 1.1650–1.1660 Resistance Level, where the previous rejection occurred. As the pair moves within the rising channel, bullish momentum remains intact, but the structure also suggests that the market may slow down as it nears this overhead resistance. As long as the price holds above the Buyer Zone and continues respecting the channel’s Support Line, the bullish scenario remains valid. A short pullback toward the channel’s midline is possible before buyers attempt another push upward. A continuation of this upward movement may drive EUR/USD toward the TP1 target at 1.1650–1.1660, aligning with the major Resistance Level. A clean breakout above this level would open the door for further bullish expansion. However, a breakdown below the Support Line or a return into the Buyer Zone could weaken the current bullish structure and expose the pair to deeper corrective movement. Please share this idea with your friends and click Boost 🚀

Gold Slows at Channel Top — Market Targets 4,150 Before Move UpHello traders! Here’s my technical outlook on XAU/USD based on the current market structure. After breaking out of the broader consolidation phase, gold continued to move within a rising channel, forming consistent higher highs and higher lows along the Support Line. Buyers maintained strong momentum as the price pushed toward the Resistance Line, which aligns with the major Resistance Level near 4,240. However, after reaching this upper boundary, the market showed clear signs of exhaustion, indicating that buyers are struggling to push further into the resistance zone. This reaction suggests that the price may soon initiate a corrective move. At the moment, XAU/USD is trading inside a narrowing rising structure, with the Support and Resistance Lines converging, creating compression. As long as the price holds above the local Support Level around 4,150, the bullish structure remains intact. A pullback from the Resistance Line toward this area is the most likely short-term scenario before buyers attempt another push. This zone aligns with the first target TP1, which also acts as a key reaction zone from previous price behavior. A successful rebound from support could allow bulls to regain strength and attempt another test of the 4,240 resistance. If a breakout occurs, it would open the door for further bullish continuation. However, if the price fails to hold the Support Line or breaks back below the 4,150 zone, the structure may shift to a deeper correction, exposing gold to lower support areas. Please share this idea with your friends and click Boost 🚀

EURUSD Pullback Before Bullish ExpansionQuick Summary
EURUSD is still showing strong bullish momentum, but a short term correction toward 1.15903 is likely before price continues higher to break the previous high. The presence of liquidity and an order block at the retracement zone increases the probability of a sweep before a new bullish push begins.
Full Analysis
The EURUSD continues to maintain its upward structure, and the current price action suggests that a temporary pullback may occur before the next bullish expansion. The level around 1.15903 stands out as a logical correction point
This retracement zone is significant because it contains both resting liquidity and a strong order block. These factors often attract price, as the market tends to sweep liquidity before continuing its primary direction. A sweep in this zone would remove weak hands, fill inefficiencies, and position the pair for a stronger continuation move.
Once liquidity below 1.15903 is taken, the expectation is for EURUSD to resume its bullish trajectory and aim for a break above the previous high. Waiting for a reaction or confirmation at the level can provide a higher quality entry, but the overall bias remains bullish as long as the structure stays intact.
