EURUSD: Sellers Target Move Toward 1.1550 Support ZoneHello everyone, here is my breakdown of the current Euro setup.
Market Analysis
EURUSD is currently reacting within a broader corrective structure after failing to break above the major Resistance Area around 1.16500. This zone has repeatedly acted as a strong supply region, where price formed multiple rejection points and false breakouts. Each attempt to move higher was stopped by the descending Resistance Line, confirming continued bearish pressure. Earlier, EURUSD moved inside a wide Range Phase, followed by a breakout that initiated an upward correction inside an Upward Channel. However, bullish momentum weakened once price reached the upper boundary of the channel and the major resistance area. This led to a strong reversal and a bearish breakout below channel support.
Currently, EURUSD is climbing again toward the same Resistance Area near 1.16500, but the structure suggests the move is likely a corrective pullback, not a trend reversal. Price is approaching the intersection of the Resistance Line and the Resistance Zone, creating a confluence area where sellers are expected to regain control.As long as the market trades below this resistance cluster, the overall trend remains bearish. A rejection from the 1.16500 level could trigger a decline toward the Support Zone at 1.15550, which previously acted as a key demand region.
My Scenario & Strategy
I expect EURUSD to complete its pullback soon and resume the bearish trend once price reaches the 1.16500 Resistance Area. This zone remains the strongest supply region in the current structure. Potential short entries become valid once bearish confirmation appears near 1.16500, with the primary target at the 1.15550 Support Zone (TP1).
A clean breakdown below 1.15550 would signal continuation of the downtrend.
Alternatively, if EURUSD successfully breaks above 1.16500 and stays above the descending resistance line, bullish momentum may develop — but for now, this scenario remains secondary. Market bias stays bearish as long as price trades below resistance.
That's the setup I'm tracking. Thank you for your attention, and always manage your risk.
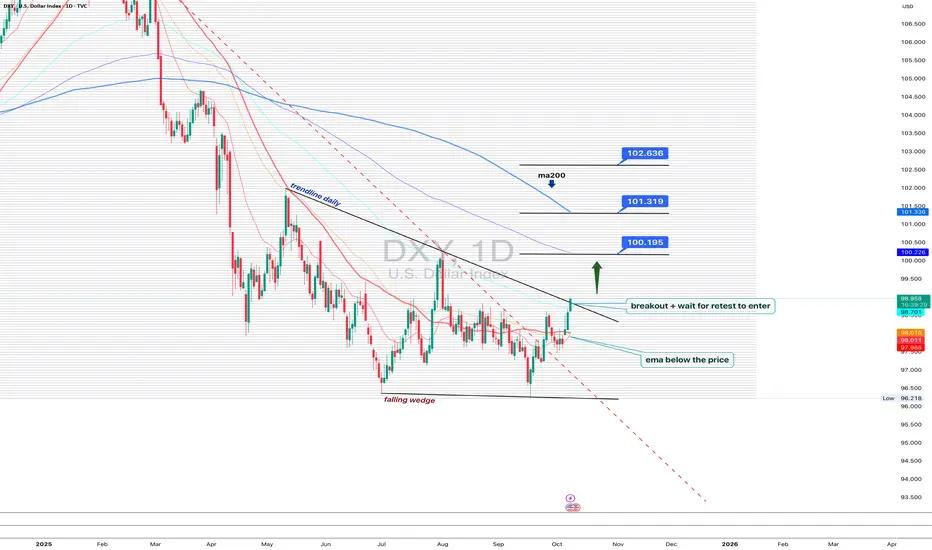
Breakout!

DXY 1D - dollar waking up, but patience is keyOn the daily chart, the US Dollar Index is showing the first signs of recovery: a falling wedge breakout and trendline breach hint that bulls are slowly reclaiming control. Price has moved above the EMA, a short-term bullish signal.
Still, MA200 remains above, reminding us that the broader trend is not yet flipped. The ideal play here - wait for a retest of the breakout trendline to confirm buyers’ strength before jumping in.
If price holds above 99.70, the next upside targets sit around 100.19, 101.31, and 102.63.
But keep in mind - DXY loves to test patience. False breakouts are its favorite sport.
Right now, the dollar looks ready to wake up, but maybe hit the snooze button one last time before the real move begins.
$ANNX – Massive Breakout! Former Downtrend Broken With Eyes on $NASDAQ:ANNX just printed one of its strongest breakout candles of 2025 — surging from the $3s into the $4.00+ range on explosive volume.
This move breaks a multi-month descending structure that has held Annexon down since late 2023, officially flipping the market structure bullish.
After over a year of accumulation between $2.00–$3.25, NASDAQ:ANNX is now targeting higher levels as buyers step in aggressively across all timeframes.
📊 Technical Overview
Support Levels: $3.55 → $3.25 → $2.75
Resistance Levels: $4.12 → $5.00 → $5.50
Structure: Higher-high + breakout above Ichimoku cloud + full downtrend violation
Momentum: RSI ripping into bullish expansion; volume at multi-month highs
Trend Bias: Strongly bullish above $3.55
A clean continuation above $4.12 confirms the breakout and opens the path toward the $5.00–$5.50 prior supply zone.
If buyers maintain control, this could be the first leg of a larger biotech momentum sequence.
🧪 Sector Context
Annexon ( NASDAQ:ANNX ) operates in the neuro-immunology biotech space — a sector known for abrupt trend changes following clinical updates, FDA milestones, or institutional rotations.
Small-cap biotech names across the board ( NASDAQ:TCRT , NASDAQ:SANA , OTC:VCNX , NASDAQ:MRSN ) have shown renewed momentum this quarter, signaling a potential sector rotation into undervalued clinical-stage companies.
NASDAQ:ANNX spent over 12 months building a base — moves like today typically occur before catalysts become public.
💡 My Plan
Entry Zone: $3.60–$3.85 on pullbacks
Targets: $4.50 → $5.00 → $5.50
Stretch Target: $7.85 (measured move from macro range breakout)
Invalidation: Close below $3.25 = failed breakout → back to accumulation range
The ideal scenario is a small pullback into the 8EMA / 20EMA on the daily chart before the next leg up.
NASDAQ:ANNX just broke a year-long downtrend with huge volume — the big question now is:
Does it push into the $5.00–$5.50 zone next, or does it consolidate first?
Drop your thoughts ⬇️
I’ll post the continuation update if NASDAQ:ANNX clears $4.12 with strength 📈
AMEX:XBI NASDAQ:TCRT OTC:VCNX NASDAQ:MRSN

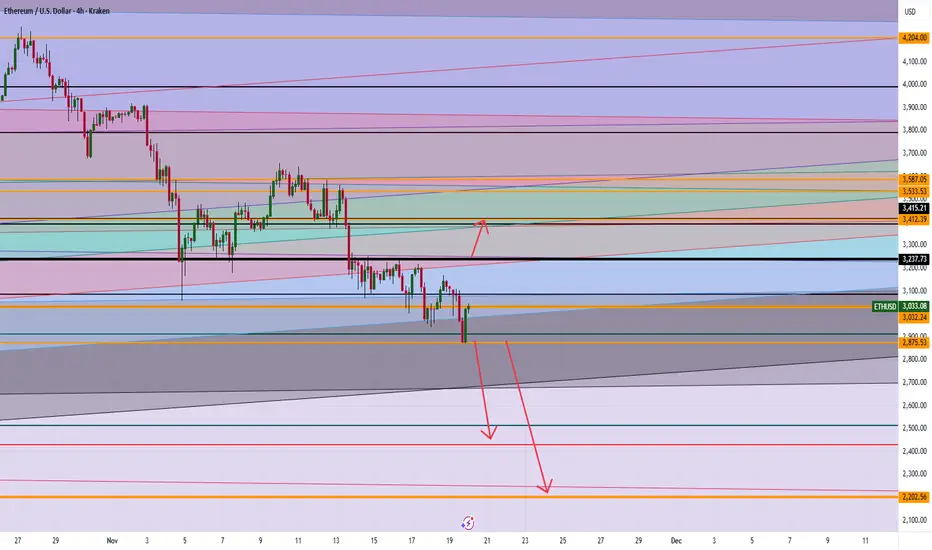
ETH Breakout Levels: Is $3,600 Next or Will Ethereum Crash to $2If ETH holds above 3237, clear momentum targets the 3400 range, with further upside potential toward 3500–3600 if buyers keep control.
A sustained break below 2875 opens the path to 2500, and possibly deeper toward 2200 on heavy selling pressure.
Any questions send me a DM
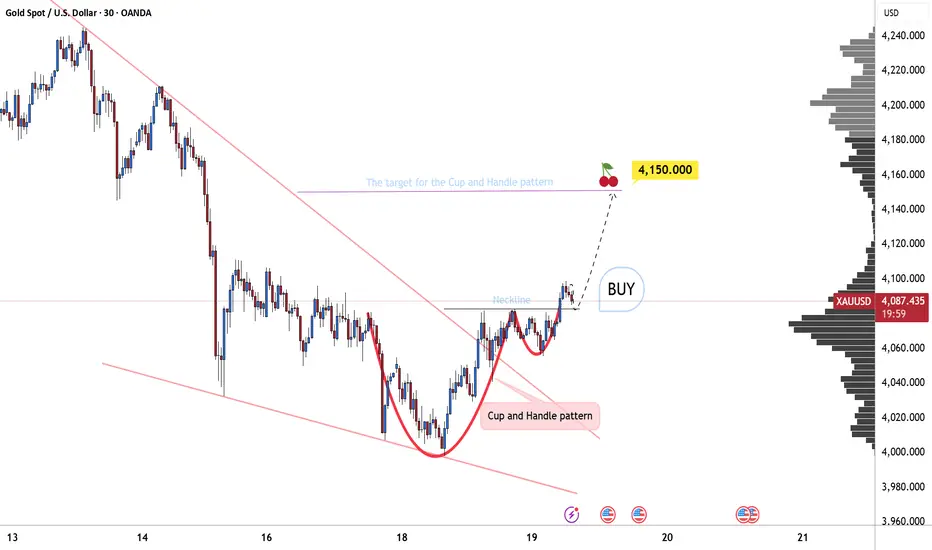
Cup and Handle: Bullish Outlook for GoldOANDA:XAUUSD is clearly forming a Cup and Handle pattern. The price previously dropped to the 4000 zone, then rebounded to 4080, completing the cup structure.
Afterward, the market is experiencing a slight pullback, forming a tight and well-controlled handle.
Finally, the price breaks through the neckline with strong momentum, and my next target is around 4150 , measured based on the height of the cup.
This is a classic bullish pattern, and market expectations are gradually being reinforced.
GBPAUD BEARISH BREAKOUT|SHORT|
✅GBPAUD clean break below the supply block signals bearish orderflow. Price may retrace into the breaker before delivering a displacement toward the downside target. Time Frame 2H.
SHORT🔥
✅Like and subscribe to never miss a new idea!✅

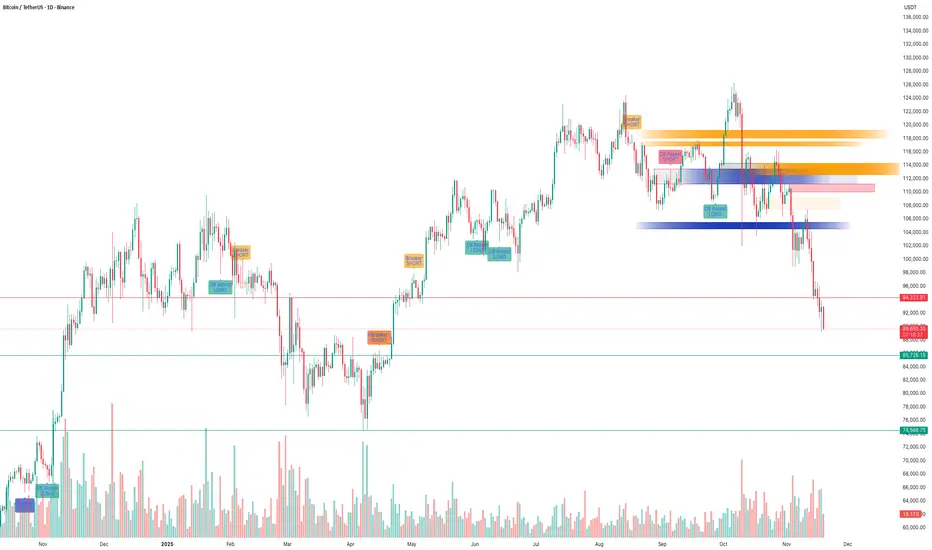
BTC – SMC Suite Follow-Up: Liquidity Grab at 116K and the Drop!!BTC – SMC Suite Follow-Up: Liquidity Grab at 116K and the Drop That Followed
This is a follow-up to my earlier idea “ BTC – Liquidity Grab at $116K Before Deep Correction? ” where I highlighted the danger of price trading into stacked SMC levels on the 1D chart.
1️⃣ Quick recap of the original idea
In the previous post, price was trading around the $112K–$116K zone.
Using the SMC Suite on the 1D chart, I highlighted:
• A high-timeframe supply / OB cluster around 116K.
• A liquidity grab above prior highs – price spiked into fresh liquidity sitting above the range.
• A confluence of Breaker + OB Re-test + FVG acting as a “danger zone” for fresh longs.
• The idea that this move could be a distribution / liquidity grab before a deeper correction.
The key message was: this is not a safe place to be aggressive long; watch for rejection and potential downside.
2️⃣ How price reacted afterwards
Since that post:
• Price respected the 116K zone as supply – every attempt to hold above it failed.
• The highlighted OB + Breaker block acted as a ceiling; price consolidated there and then rolled over.
• After losing the mid-range structure, BTC started a trend of lower highs and lower lows , confirming distribution.
• We have now traded all the way down into the d emand / support zones below 92K and then lower , which were also plotted in advance by the same SMC levels.
In simple terms, the area we marked as a “ danger zone for longs ” turned out to be the top of the move before this large downside leg.
3️⃣ What the SMC levels showed well
This move is a nice case study of how the SMC concepts aligned:
• Liquidity Sweep : Price ran above previous highs into fresh liquidity, then failed to hold.
• Breaker + OB Re-test : Former demand became supply; retest of this breaker block rejected price.
• FVG + Imbalance Zones : Upside imbalances got filled and then flipped into resistance.
• Structure Shift : After the rejection, market structure shifted bearish with clean breaks of prior swing lows.
None of this is about “perfect prediction”, but about reading where smart money might be offloading risk and where retail is most vulnerable.
4️⃣ Takeaways & what I’m watching next
• HTF SMC levels matter. When multiple concepts cluster (Breaker, OB, FVG, previous highs), treat that zone with respect.
• Liquidity grabs at highs are great warning signals – especially when followed by a clear structure shift.
• For now, I’m watching how price behaves around the current demand zones and whether we see:
• Strong rejection + reclaim of broken levels (potential swing-long areas), or
• Continuation of lower highs pointing to further downside.
This post is for educational purposes only, not financial advice.
XAUUSD Long: Buyers Eye Push Toward $4,100 ResistanceHello traders! XAUUSD is developing a clear technical structure after reacting multiple times to both the Supply and Demand zones, forming a well-defined pattern of price behavior. Recently, Gold rejected the Supply Line after creating a new Pivot Point near the $4,230 area — the same region where a previous strong rejection occurred. This confluence confirms that sellers remain active at the upper boundary of the market. Earlier, the market formed a Double Top pattern near the same Supply Zone, which triggered a strong bearish reversal. After the breakdown, price retested the $4,100 level several times, turning it into a meaningful local resistance. Multiple breakout attempts above this level failed, signaling strong selling pressure from the supply area.
Currently, XAUUSD is testing the Demand Line that has been respected consistently throughout the recent bullish leg. Each touch of this trendline resulted in a higher pivot point, confirming active buyers stepping into the market. This area aligns with the $4,000–$4,010 Demand Zone — a key support cluster where price has reacted with strong bullish impulses before.
My scenario as long as XAUUSD holds above the Demand Line and the $4,000–$4,010 support, the bullish structure remains valid. A rebound from this zone may initiate a fresh move toward the $4,100 Supply Zone (TP1), where the next important reaction is expected. A clean breakout above $4,100 would strengthen the bullish scenario and open the path toward $4,150–$4,170, aligning with the upper Supply Line. If Gold fails to hold above the Demand Zone, sellers may regain control and push the price lower toward the $3,960 support, signaling a deeper correction phase. For now, the market favors buying pullbacks near demand while monitoring price action closely around the $4,100 resistance. Manage your risk!

EURUSD Breakout and Potential RetraceHey Traders, in today's trading session we are monitoring EURUSD for a buying opportunity around 1.15700 zone, EURUSD was trading in a downtrend and successfully managed to break it out. Currently is in a correction phase in which it is approaching the retrace area at 1.15700 support and resistance area.
Trade safe, Joe.

XAUUSD: Bullish Rebound Setup as Price Holds Above Wedge SupportHello everyone, here is my breakdown of the current Gold setup.
Market Analysis
XAUUSD is currently maintaining a bullish market structure after rebounding from the key Wedge Support Line, which continues to act as a major dynamic support for the ongoing uptrend. The chart shows that Gold previously formed a broad Range at the top, followed by a sharp rejection from the Resistance Area near $4,170–$4,200, where strong sellers stepped in. This zone remains the primary supply region and aligns closely with the Wedge Resistance Line, creating a strong confluence barrier. After the rejection, price moved back into a correction phase, retesting both the Support Zone around $4,040–$4,070 and the ascending wedge structure. Notably, the recent bullish reaction inside this zone indicates that buyers are still defending this area effectively. Multiple breakouts and a prior fake breakout highlight that sellers are struggling to maintain downward momentum, while buyers continue to accumulate at lower levels.
Currently, XAUUSD is stabilizing just above the Support Zone, forming early signs of a potential upward continuation. As long as the price respects the wedge support and holds above $4,070, the bullish structure remains intact. The market behavior suggests increasing buyer interest, especially during retests of lower support.
My Scenario & Strategy
I expect Gold to continue its upward movement from the current support area and retest the $4,170–$4,200 Resistance Zone once again. This level will be the next major decision point; a successful breakout above this zone could open the path toward higher highs and potentially signal a continuation of the broader bullish trend.
However, if XAUUSD breaks below the Wedge Support Line, the bullish outlook would weaken, and the price could revisit deeper support levels before buyers attempt another recovery. For now, bullish continuation remains the most probable scenario as long as the support structure holds. Pullback-based long entries remain the best approach while price continues to trade above the key support zone and upward trendline.
That's the setup I'm tracking. Thank you for your attention, and always manage your risk.

BTCUSD Rebounds From Channel Support — Targeting $93K PullbackHello traders! Let’s break down the current BTCUSD market structure. Bitcoin continues to move within a well-defined descending channel, where price has repeatedly respected both the resistance and support lines. Every touch of the upper boundary resulted in a Turned Around reaction, confirming strong seller dominance throughout the downtrend. After breaking below a key local support, BTCUSD shifted into a deeper bearish phase and moved toward the broader Support Zone beneath $90,000. This level aligns with the lower boundary of the descending channel and has acted as a strong reaction area in previous price swings. Recently, price reached the channel’s support line, where buyers stepped in and formed an early rebound attempt. BTCUSD is now showing signs of a potential short-term correction, with price aiming toward the nearest resistance cluster at $93,000–$96,000, which also represents the mid-channel region and a key retest zone. As long as Bitcoin stays below the descending resistance line, the broader trend remains bearish. However, a corrective move toward TP1 near $93,000 is likely if the current support continues to hold. A rejection from the resistance area could send the price back toward the channel bottom for another test. A confirmed breakout above the descending resistance line would be the first signal of a potential shift in momentum and could open the way for a stronger recovery. Until then, BTCUSD remains in a bearish structure with a possible short-term bullish pullback. Please share this idea with your friends and click Boost 🚀

EURUSD Rejected From Resistance — Pullback Toward 1.1560 in PlayHello traders! Let’s analyze the current EURUSD market structure. EURUSD continues to move within a broad descending channel, where both the Resistance Line and the Support Line have been respected multiple times, confirming a well-defined bearish market structure. Throughout the past sessions, price formed several Range phases near key levels, followed by Breakouts that maintained the overall downward momentum. Recently, EURUSD approached the upper boundary of the channel and reacted strongly from the major Resistance Level near 1.16600, which overlaps with the Seller Zone. This area has triggered multiple Turned Around movements in the past, reinforcing its importance as a supply region where sellers consistently regain control. After rejecting this resistance, price started a downward move toward the mid-range structure. The pair is now approaching the Buyer Zone around 1.15500–1.15600, which aligns with both the local support area and previous Range accumulation. This zone has historically served as a strong reaction level, where short-term bullish corrections often began. As long as EURUSD remains below the descending channel’s resistance and fails to break above the Seller Zone, the bearish structure remains intact. A continuation toward TP1: 1.15600 is the most likely scenario in the short term, especially if sellers maintain momentum below the 1.16200 area. A clean break below the Buyer Zone could open the door for a deeper decline toward the Support Line at the bottom of the channel. On the other hand, a confirmed breakout above the 1.16600 Resistance Level would invalidate the current bearish view and potentially shift the trend toward recovery. Please share this idea with your friends and click Boost 🚀

The Support Zone That Refused To Be IgnoredSome chart zones whisper. This one practically waved its arms.
Price slid right into a hefty support area on the higher timeframe… and suddenly started behaving like it had forgotten how to move lower. Classic clue.
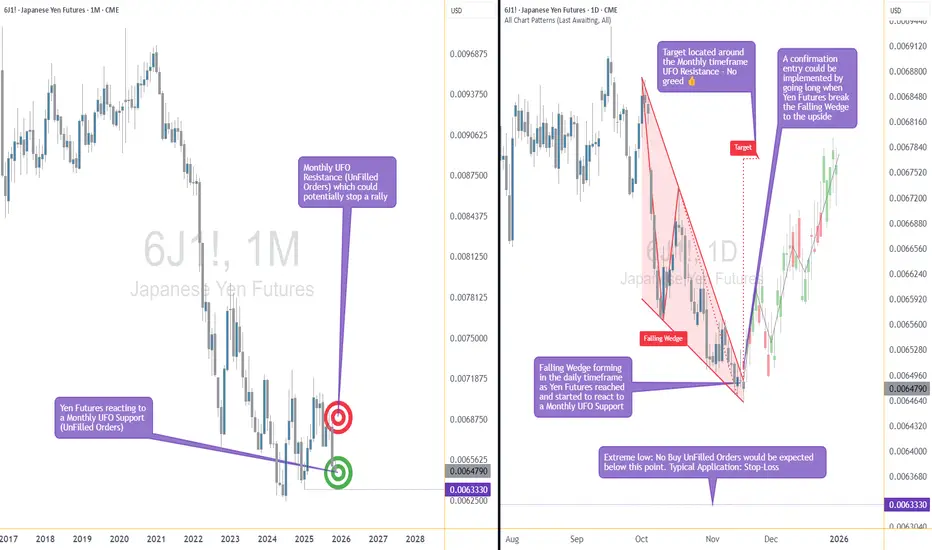
Zoom in, and the daily chart shows price squeezing itself into a falling wedge — the market’s equivalent of someone pacing in a hallway, unsure whether to sit down or sprint. Sellers kept trying to push prices lower, but each attempt had less conviction than the last.
When you stack those two pieces together — a big support zone from the monthly chart and a daily pattern running out of room — things start to get interesting. Not predictive, just… interesting.
A breakout above the wedge (around 0.0065030) would basically say, “Alright, I’m done compressing.”
A stop tucked below the lower support range (roughly 0.0063330) keeps the scenario clean.
And a structural projection toward 0.0067695 gives the idea a tidy endpoint if momentum decides to stretch its legs.
Of course, leverage cuts both ways, and traders working with the standard or micro contracts often choose size based on how much room they want between entry and invalidation. When traders choose between the standard and micro versions of this market, it usually comes down to scale. The bigger contract represents 12,500,000 units of the underlying with a $6.25 tick, while the micro mirrors the behavior at 1,250,000 units with a $1.25 tick. Estimated margins also differ — roughly $2,800 for the larger contract and about $280 for the micro. Same chart logic, just two very different footprints on the account.
The real takeaway? When a major zone teams up with a compression pattern, it’s usually worth paying attention. Maybe it leads to a beautiful breakout. Maybe it fizzles. But structurally, this is one of those “save the screenshot” moments.
And whatever the outcome, risk management keeps the whole thing sensible — size smartly, define failure points, and let the chart prove itself instead of assuming it will.
Want More Depth?
If you’d like to go deeper into the building blocks of trading, check out our From Mystery to Mastery trilogy, three cornerstone articles that complement this one:
🔗 From Mystery to Mastery: Trading Essentials
🔗 From Mystery to Mastery: Futures Explained
🔗 From Mystery to Mastery: Options Explained
When charting futures, the data provided could be delayed. Traders working with the ticker symbols discussed in this idea may prefer to use CME Group real-time data plan on TradingView: www.tradingview.com - This consideration is particularly important for shorter-term traders, whereas it may be less critical for those focused on longer-term trading strategies.
General Disclaimer:
The trade ideas presented herein are solely for illustrative purposes forming a part of a case study intended to demonstrate key principles in risk management within the context of the specific market scenarios discussed. These ideas are not to be interpreted as investment recommendations or financial advice. They do not endorse or promote any specific trading strategies, financial products, or services. The information provided is based on data believed to be reliable; however, its accuracy or completeness cannot be guaranteed. Trading in financial markets involves risks, including the potential loss of principal. Each individual should conduct their own research and consult with professional financial advisors before making any investment decisions. The author or publisher of this content bears no responsibility for any actions taken based on the information provided or for any resultant financial or other losses.

EURJPY FREE SIGNAL|LONG|
✅EURJPY broke cleanly above the key level with strong bullish displacement, confirming a shift in orderflow. A retracement into the breakout zone can offer premium entry before targeting the inefficiency above.
—————————
Entry: 180.071
Stop Loss: 179.785
Take Profit: 180.499
Time Frame: 2H
—————————
LONG🚀
✅Like and subscribe to never miss a new idea!✅

BTCUSD Long: Short-Term Correction Eyes $97,500 ResistanceHello traders! BTCUSD continues to trade within a well-defined descending channel, maintaining a broader bearish structure while forming a series of lower highs and lower lows. Throughout the move, the price has created multiple pivot points along both the upper and lower channel boundaries, confirming the strength of this trend. Inside the channel, Bitcoin developed two notable range phases, each reflecting temporary consolidation before continuing downward. A key formation on the chart is the Rounding Top Pattern, which developed near the mid-channel area. This structure signaled weakening bullish pressure and preceded a sharp decline back toward the channel’s lower boundary. After the breakdown, BTC attempted a small recovery, but price failed at the Supply Zone, creating a rejection that aligned with a bearish breakout confirmation.
Currently, the price is approaching the $97,500 short-term target, which sits close to the lower edge of the Supply Zone. This level has acted as a significant reaction area several times, and the market may retest it before deciding the next direction. As long as BTC trades within the descending channel, the broader trend remains bearish, but short-term corrective moves to the upside are possible due to the strong reaction from demand.
My scenario as long as BTCUSD holds above the Demand Zone ($94,000–$94,500) and shows continued strength, a corrective move toward $97,500 remains likely. This level represents the nearest resistance and aligns with previous supply reactions. A clean breakout above $97,500 would open the way for a deeper correction toward the channel’s mid-line or even the upper boundary. However, if price gets rejected at the supply zone again, sellers may regain control and attempt another push back toward the demand area. A confirmed break below the Demand Zone would invalidate the bullish recovery setup and could trigger continuation of the broader downtrend. For now, the structure supports short-term bullish correction, but overall trend remains bearish until the descending channel is broken. Manage your risk!

BTCUSD: Buyers Aiming for a Move Toward 99,000 ResistanceHello everyone, here is my breakdown of the current Bitcoin setup.
Market Analysis
BTCUSD has recently completed a strong downward phase inside a well-defined Downward Channel, where price continuously formed lower highs and lower lows. After reaching the Support Zone around $94,500–$95,200, buyers stepped in and created a fake breakout, followed by a quick recovery — a sign of weakening seller pressure. Following this rebound, Bitcoin formed an Inverse Head and Shoulders pattern, confirming a potential bullish reversal. Price has now broken above the Triangle Resistance Line, signaling the first structural shift from bearish to bullish.
Currently, BTCUSD is consolidating just above the $95,500–$96,000 support zone, which now acts as a retest area for the breakout. As long as BTC stays above the Triangle Support Line, bullish momentum remains intact, and the market structure favors further upward movement. The nearest target for buyers is the $99,000 Resistance Zone, which previously acted as a strong supply area. A successful breakout above $99,000 would confirm bullish continuation and open the way toward higher resistance levels. If price fails to hold above support, a short-term pullback toward the lower triangle boundary may occur before buyers try to regain control.
My Scenario & Strategy
I expect BTCUSD to maintain its bullish bias as long as price trades above the Triangle Support Line and the key support zone. Potential long entries remain valid on retests of the $95,500–$96,000 area, with a primary target at the $99,000 Resistance Zone (TP1).
A confirmed breakout above $99,000 would strengthen bullish momentum and open the next leg upward. However, a breakdown below the triangle structure may lead to a deeper correction toward $94,500. For now, sentiment remains bullish, and Bitcoin appears ready for a continued recovery within the new reversal structure.
That's the setup I'm tracking. Thank you for your attention, and always manage your risk.

NZDUSD: Downtrend ConfluenceDaily TF Observations
Price is in a clean downtrend
H1 TF Observations
Price faked out of one ascending trend line (ATL)
However, price is making a clean break below the second ATL
EMA20 is also below EMA60

BTCUSD Technical Analysis – Is a Correction on the Way?BINANCE:BTCUSD is currently trading inside a well-defined falling wedge, and the price is pressing against the lower boundary of the pattern. This level could serve as dynamic support, and if a strong rejection occurs, we may see a corrective move toward the 102,000 resistance area.
If sellers successfully defend that zone, the bearish structure remains intact, increasing the likelihood of BTCUSD moving back down to lower price levels. However, if price breaks above this resistance, a deeper correction toward the upper boundary of the wedge could unfold.
At this stage, closely monitoring candlestick signals and volume activity around this key area is essential for spotting high-quality selling opportunities. Ensure every trade setup is backed by solid confirmation, and always maintain strict risk management.
If you have any thoughts or additional perspectives on this setup, I’d be happy to hear them. Feel free to share your opinion in the comments!

A High-Impact Support Zone Meets a Breakout StructureIntroduction
Markets occasionally compress into areas where structure, momentum, and historical buying pressure align with surprising precision. When that compression occurs at a major higher-timeframe floor, traders often pay closer attention—not because the future is predictable, but because the chart reveals a location where price behavior typically becomes informative.
The current case study centers on a market pressing into a high-impact support zone visible on the monthly chart, while the daily chart displays a falling wedge pattern that has gradually narrowed the range of movement. This combination often highlights moments where the auction process is nearing a decision point. The purpose here is to dissect that confluence using multi-timeframe structure, pattern logic, and broad order-flow principles—strictly for educational exploration.
Higher-Timeframe Structure (Monthly)
The monthly chart shows price approaching a well-defined support area between 0.0065425 and 0.0063330, a region that has acted in the past as a base for significant reactions. These areas often develop because markets rarely absorb all buy interest in a single pass; pockets of unfilled orders may remain, leading to renewed reactions when price returns.
This type of zone does not guarantee a reversal. However, historically, when price reaches such levels, traders tend to monitor whether selling pressure slows or becomes less efficient. In this case, the structure suggests a recurring willingness from buyers to engage at these prices, forming a foundation that has held multiple swings.
The presence of a clear, higher-frame resistance at 0.0067530 anchors the broader range. When price rotates between such boundaries, the monthly context often acts as a roadmap: major support below, major resistance above, and room in between for tactical case-study exploration.
Lower-Timeframe Structure (Daily)
Shifting to the daily chart, price action has carved a falling wedge, a pattern often associated with decelerating downside movement. In wedges, sellers continue to push price lower, but with diminishing strength, as each successive low becomes less effective.
This type of compression structure can provide early evidence that the auction is maturing. Traders studying such patterns often watch for:
tightening of the range,
shorter waves into new lows,
initial signs that buyers are defending intraday attempts to drive price lower.
The daily wedge in this case sits directly on top of the monthly support zone—an alignment that strengthens its analytical relevance. The upper boundary of the wedge sits near 0.0065030, and a break above that line is often interpreted as price escaping the compression phase.
Multi-Timeframe Confluence
Multi-timeframe confluence arises when higher-frame structure provides the background bias and lower-frame patterns offer the tactical trigger. In this case:
The monthly chart signals a historically responsive support zone.
The daily chart shows structural compression and slowing downside momentum.
The interaction between them creates a scenario where educational case studies tend to focus on breakout behavior, as the daily timeframe may provide the first evidence that higher-frame buyers are engaging.
This confluence does not imply certainty. It simply highlights a location where structure tends to become more informative, and where traders often study the transition from absorption to response.
Order-Flow Logic (Non-Tool-Specific)
From an order-flow perspective, strong support zones typically develop where prior buying activity left behind unfilled interest. When price returns to that region, two things often happen:
Sellers begin to encounter difficulty driving price lower, as remaining buy orders absorb their activity.
Compression patterns form, as the market oscillates in a tightening range while participants test whether enough liquidity remains to cause a directional shift.
A breakout of the daily wedge represents a potential change in the auction dynamic. While sellers are still active inside the wedge, a breakout suggests their pressure may have become insufficient to continue the sequence of lower highs and lower lows. Traders studying market transitions often use such moments as part of hypothetical scenarios to understand how imbalances evolve.
Forward-Looking Trade Idea (Illustrative Only)
For educational purposes, here is how a structured case study could frame a potential opportunity using the discussed charts:
Entry: A hypothetical entry could be placed above the falling wedge, around 0.0065030, once buyers demonstrate the ability to break outside the compression structure.
Stop-Loss: A logical invalidation area in this case study would be at or below the monthly support, around 0.0063330, where failure would indicate the higher-timeframe zone did not hold.
Target: A purely structural wedge projection would suggest a target near 0.0067695, aligning closely with the broader resistance region on the monthly chart.
These price points yield a reward-to-risk profile that is measurable and logically linked to structure, though not guaranteed. This case study exists solely to illustrate how support-resistance relationships and pattern logic can be combined into a coherent, rules-based plan, not as an actionable idea for trading.
Yen Futures Contract Context
The larger (6J) and micro-sized (MJY) versions of this futures market follow the same underlying price but differ in exposure and margin scale. The standard contract generally carries a greater notional value and therefore translates each price movement into a larger monetary change. The micro contract mirrors the same structure at a reduced size, allowing traders to adjust position scaling more precisely when navigating major zones or breakout structures such as the one discussed in this case study:
6J equals 12,500,000 Japanese Yen per contract, making it suitable for larger, institutional players. (1 Tick = 0.0000005 per JPY increment = $6.25. Required Margin = $2,800)
MJY equals 1,250,000 Japanese Yen per contract, making it suitable for larger, institutional players. (1 Tick = 0.000001 per JPY increment = $1.25. Required Margin = $280)
Understanding margin requirements is essential—these products are leveraged instruments, and small price changes can result in large percentage gains or losses.
Risk Management Considerations
Strong support zones can attract interest, but risk management remains the foundation of any structured approach. Traders studying these transitions typically:
size positions relative to the distance between entry and invalidation,
maintain clear exit criteria when structure fails,
avoid adjusting stops unless the market has invalidated the original reasons for the plan,
adapt to new information without anchoring to prior expectations.
These principles emphasize the importance of accepting uncertainty. Even at major support zones, markets can remain volatile, and scenarios may unfold differently than anticipated.
When charting futures, the data provided could be delayed. Traders working with the ticker symbols discussed in this idea may prefer to use CME Group real-time data plan on TradingView: www.tradingview.com - This consideration is particularly important for shorter-term traders, whereas it may be less critical for those focused on longer-term trading strategies.
General Disclaimer:
The trade ideas presented herein are solely for illustrative purposes forming a part of a case study intended to demonstrate key principles in risk management within the context of the specific market scenarios discussed. These ideas are not to be interpreted as investment recommendations or financial advice. They do not endorse or promote any specific trading strategies, financial products, or services. The information provided is based on data believed to be reliable; however, its accuracy or completeness cannot be guaranteed. Trading in financial markets involves risks, including the potential loss of principal. Each individual should conduct their own research and consult with professional financial advisors before making any investment decisions. The author or publisher of this content bears no responsibility for any actions taken based on the information provided or for any resultant financial or other losses.
EURUSD Long: Buyers Targeting a Move Toward 1.1670 ResistanceHello traders! EURUSD is maintaining a bullish structure after rebounding from the Demand Zone at 1.1600–1.1610, where buyers consistently stepped in to defend support. This area also aligns with the Demand Line of the ascending channel, making it a key decision point for the current uptrend. Earlier, the pair formed a Rounding Top near the 1.1650–1.1670 Supply Zone, which triggered a downside breakout and a short-term correction. Once price reached the pivot point around 1.1530, buyers regained control and initiated a steady recovery, forming a clean ascending channel.
Currently, EURUSD is approaching the Supply Zone at 1.1650–1.1670, which also aligns with the Supply Line of the channel — creating a strong confluence resistance area. A breakout above this zone would confirm bullish continuation toward the next major liquidity cluster. As long as the pair holds above the Demand Line, the bullish structure remains intact. A minor pullback toward the 1.1610–1.1620 Demand Zone would be considered a healthy correction within the trend.
My scenario as long as EURUSD stays above 1.1600–1.1610, buyers remain in control and the bullish channel is valid. The primary upside target is 1.1670, which serves as both a Supply Zone and a key structural resistance. A confirmed breakout above 1.1670 would signal continuation toward higher levels and mark a shift into a stronger bullish phase. If the pair rejects the Supply Zone, a pullback toward 1.1620–1.1600 is likely, where buyers may re-enter. A break below 1.1600 would weaken the bullish outlook and open the path toward deeper correction. For now, the market favors buying pullbacks while holding above demand. Manage your risk!

EURUSD: Breakout Structure Supports Move Toward 1.1650Hello everyone, here is my breakdown of the current Euro setup.
Market Analysis
EURUSD is showing a clear bullish shift after breaking out of multiple downward structures and reclaiming higher support levels. The chart highlights several key phases: a prolonged decline inside two consecutive Downward Channels, followed by confirmed breakouts, each signaling weakening bearish momentum. After the second downward channel breakout, EURUSD established a stable bullish structure, forming an ascending move supported by the Triangle Support Line. Price has been consistently creating higher lows along this line, indicating strong buyer presence.
Currently, EURUSD retraced back toward the Triangle Support Line after being rejected from the major Resistance Area around 1.16500. This zone has acted as a key supply region multiple times, and it also aligns with the Triangle Resistance Line, making it a significant confluence area. As long as price remains above the ascending support, the bullish structure stays intact. The overall market behavior shows healthy correction patterns followed by breakouts, suggesting that buyers remain in control, with momentum gradually building toward the upper resistance once again.
My Scenario & Strategy
I expect price to rebound from the current correction zone and attempt another move toward the 1.16500 Resistance, which is the next major decision point. A successful breakout above 1.16500, followed by consolidation, would signal a bullish expansion and could open the path toward higher targets in the coming sessions.
However, if EURUSD breaks below the Triangle Support Line, the current bullish structure would weaken, and price may return to lower support areas before buyers attempt another recovery. For now, structure remains bullish, and pullback-based long entries continue to offer the best opportunity while price respects the rising support trendline.
That's the setup I'm tracking. Thank you for your attention, and always manage your risk.

XAUUSD Buyers Step In — Market Aiming for $4,140 RetestHello traders! Let’s take a look at XAUUSD (Gold). XAUUSD maintains a bullish structure after bouncing from the key $4,050–$4,060 support zone, where price also retested the ascending trendline. After breaking out of the descending channel, Gold formed a new accumulation zone and moved higher, approaching the strong $4,140 resistance level. The price is now trading between the ascending support and the local supply zone near $4,140, forming a tightening structure. A breakout above this level could open the way for further upside, while a rejection may trigger a correction back toward $4,060. As long as XAUUSD holds above $4,060 and the ascending trendline, a renewed move toward $4,140 remains likely, with potential for a breakout. Please share this idea with your friends and click Boost 🚀

BTCUSD Rebounds From Buyer Zone — Correction Toward $101KHello traders! Let’s take a look at BTCUSD (Bitcoin). After an extended bearish phase inside a broad descending channel, price consistently respected both the resistance and support lines, forming a clear series of lower highs. Each touch of the descending resistance line resulted in a Turned Around reaction, confirming strong seller control throughout the structure. Earlier, Bitcoin broke below its local support area, initiating a deeper correction toward the major Support Level near $96,000. This zone aligns with the lower boundary of the descending channel and historically served as a strong reaction area for buyers. Recently, BTCUSD reached the bottom of the structure and is now showing early signs of a potential pullback. Price is attempting to rebound from the Buyer Zone, aiming toward the nearest resistance cluster around $100,800–$101,600, which also forms the lower boundary of the Seller Zone. This level previously acted as support and is now expected to serve as a strong retest area. As long as price remains below the descending resistance line, the overall trend stays bearish. A short-term bullish correction toward TP1: $101,600 remains possible, especially if buyers maintain control above the $96,000 support. However, if BTC fails to break above the Seller Zone, sellers may step in again, potentially pushing the price back toward the major support and even extending the downtrend. A confirmed breakout above the descending resistance would invalidate the bearish scenario and open the door for a stronger recovery. Please share this idea with your friends and click Boost 🚀
