USD/JPY: One the Edge - Momentum Builds Toward 155.00⚠️The USDJPY pair successfully broke and closed above a significant horizontal daily resistance level last week.
Following this breakout, the market retested the broken structure and subsequently started to consolidate.
This indicates the formation of a horizontal trading range on a 4-hour timeframe.
For a confirmed long entry, I am awaiting a bullish breakout, specifically a candle close above the resistance level of this range.
This would provide a strong intraday signal.
A bullish continuation would then be anticipated, with an initial target of at least the 155.00 level.
Breakout!

GBPJPY IDEA FOR OCT, 11TH 2025.The price is breaking new highs, which signals bullish momentum. If the price holds its current zone of resistance, that signals expectations of short-term selling power. Before it continues upwards, the price is still overall bullish.
As usual, my calls or analysis are based on what I see, the current Bias, and from a probability standpoint, meaning that this projection may be or may not be validated, so tread carefully. This is not financial advice; trade responsibly.

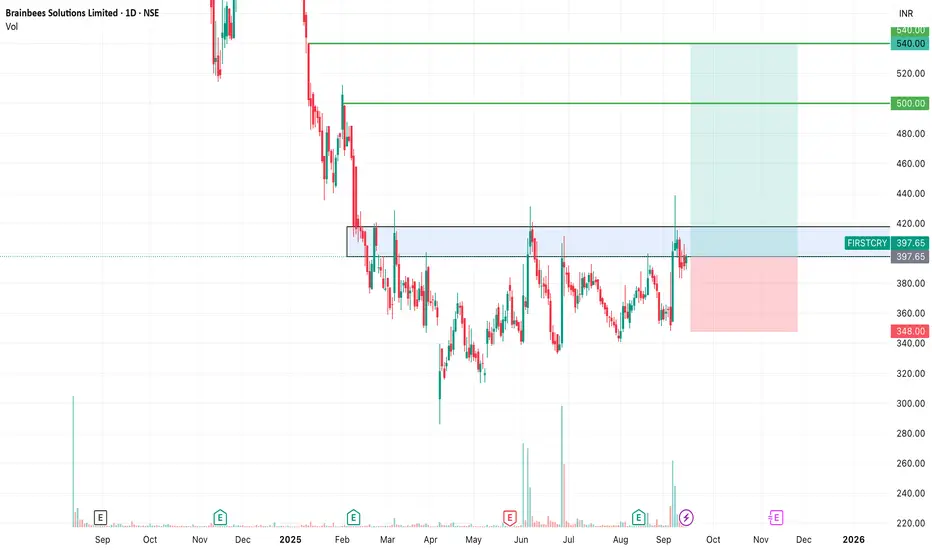
SWING IDEA - FIRSTCRY (BRAINBEES SOLUTIONS LTD)FirstCry (Brainbees Solutions) , a leading omni-channel retailer for baby and kids’ products, is showing signs of a potential breakout, presenting a strong swing trading opportunity.
Reasons are listed below :
400 resistance zone tested multiple times — now looking ready for a breakout
Attempting to break out of a 7+ month consolidation phase
Volume spikes suggest accumulation by smart money
Golden Fibonacci retracement support in play
Price action forming higher highs, confirming bullish structure
Target - 500 // 540
Stoploss - daily close below 348
DISCLAIMER -
Decisions to buy, sell, hold or trade in securities, commodities and other investments involve risk and are best made based on the advice of qualified financial professionals. Any trading in securities or other investments involves a risk of substantial losses. The practice of "Day Trading" involves particularly high risks and can cause you to lose substantial sums of money. Before undertaking any trading program, you should consult a qualified financial professional. Please consider carefully whether such trading is suitable for you in light of your financial condition and ability to bear financial risks. Under no circumstances shall we be liable for any loss or damage you or anyone else incurs as a result of any trading or investment activity that you or anyone else engages in based on any information or material you receive through TradingView or our services.
@visionary.growth.insights
Gold Price Setup: The Pullback Signal Is Getting Stronger!OANDA:XAUUSD is currently trading within a well-defined ascending channel, with price action now testing the upper boundary. This level may act as a dynamic resistance, and a rejection here could trigger a correction toward 4,030.
Such a pullback aligns with expectations for a healthy retracement after a strong rally. I anticipate this move will serve as an important launchpad for buyers, defined by the confluence of horizontal support and the 0.618 Fibonacci retracement of the latest bullish impulse.
This zone will be critical in determining whether the broader bullish structure remains intact. If price holds and shows signs of reversal, it could offer a solid re-entry opportunity for buyers. However, a decisive break below this region would invalidate the current bullish outlook, opening the door for a deeper correction.
Always confirm your setups and manage risk wisely. Stay sharp, and trade smart.

XAUUSD Long: Bullish Rebound Targeting $4,050 LevelHello traders! Gold (XAUUSD) is trading within a constructive bullish structure after rebounding from the $3,930–$3,960 Demand Zone, which aligns with the lower boundary of the Ascending Channel. This zone has acted as a strong accumulation area where buyers stepped in multiple times, confirming active defense and sustained demand. Earlier, price moved through a corrective phase shaped by the Fibonacci Arc, which guided the downside retracement before buyers regained control. Several Pivot Points formed along the channel, marking clear areas where momentum shifted back in favor of buyers. Additionally, a recent fake breakout below the channel support further emphasizes that sellers are failing to break structure, while liquidity sweeps continue to fuel bullish re-entry opportunities.
Currently, XAUUSD is moving steadily toward the channel midline, with the next key objective located at $4,050, which represents short-term resistance and a known reaction level. A confirmed breakout above $4,050 would open the door for a broader continuation toward the $4,130 Supply Zone, a region where a previous distributive phase occurred. As long as Gold holds above the $3,930–$3,960 Demand Zone, the bullish outlook remains intact.
I expect price to gradually continue higher within the ascending channel. At this stage, the market structure continues to favor buyers, and dips remain attractive opportunities to participate in the upward move. Manage your risk!

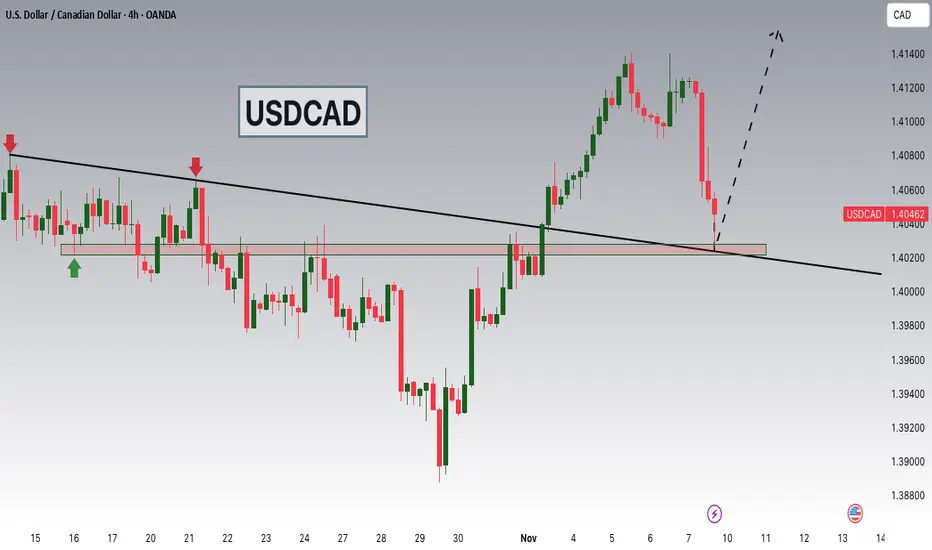
USDCAD Breakout and Potential RetraceHey Traders, in tomorrow's trading session we are monitoring USDCAD for a buying opportunity around 1.40250 zone, USDCAD was trading in a downtrend and successfully managed to break it out. Currently is in a correction phase in which it is approaching the retrace area at 1.40250 support and resistance area.
Trade safe, Joe.
BTCUSD: Bulls Eye Recovery Toward $104K Resistance ZoneHello everyone, here is my breakdown of the current Bitcoin setup.
Market Analysis
BTCUSD is currently showing signs of a potential bullish recovery after bouncing from the key $100,600–$101,200 Support Zone, which aligns with the Wedge Support Line on the chart. This area has acted as a Buyer Zone multiple times in the past, with each test triggering strong upward reactions. The recent fake breakouts below support suggest liquidity sweeps and show that sellers have been unable to sustain momentum to the downside.
Currently, price was moving within a falling wedge structure, reflecting a controlled corrective decline. Throughout this move, several fake breakouts occurred along both boundaries of the wedge, indicating seller exhaustion and possible accumulation by larger buyers. After touching the Support Zone again, BTCUSD formed a bullish reaction, signaling a shift from selling pressure to buying interest. BTCUSD is now approaching the $103,500–$105,000 Resistance Zone, which previously acted as a strong supply level where corrective upswings were rejected. This zone also aligns with the Wedge Resistance Line, making it a key decision area for the next directional move. If buyers can sustain momentum above support, the market may set up for a continued bullish recovery.
My Scenario & Strategy
As long as BTCUSD holds above the $100,600–$101,200 Support Zone, the bullish recovery outlook remains intact. I expect price to continue moving gradually higher toward the $103,500–$105,000 Resistance Zone as the next key target. A confirmed breakout above $105,000 and sustained holding would signal a shift in structure, potentially opening the path toward $110,000 in the medium term.
However, if price breaks back below the Support Zone, the bullish setup becomes invalid and BTCUSD may revisit deeper support levels before any new recovery attempt develops. For now, structure favors bullish continuation, and pullback-based long entries remain the most favorable approach while support holds.
That's the setup I'm tracking. Thank you for your attention, and always manage your risk.

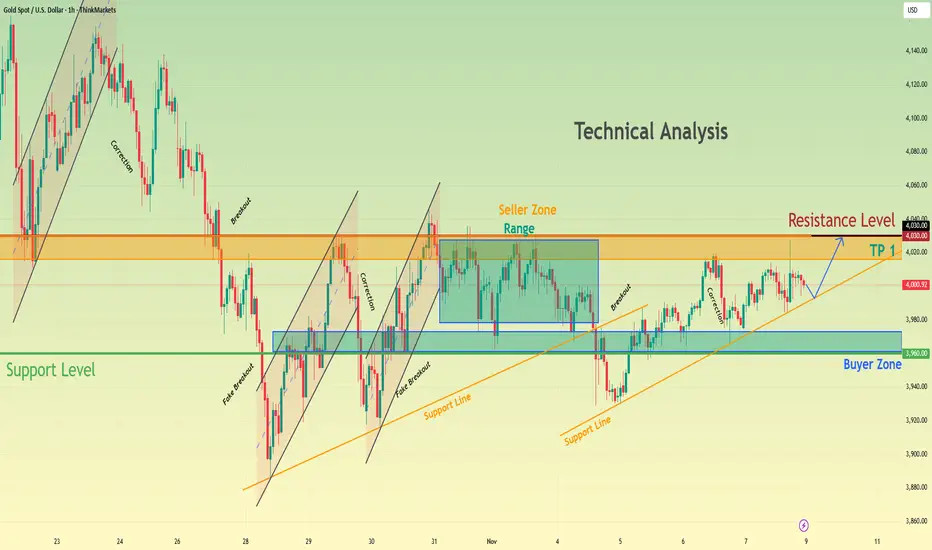
XAUUSD Holds Buyer Zone — Potential Recovery Toward $4,030Hello traders, I’d like to share my view on Gold (XAUUSD). The market has been holding a constructive bullish structure, developing higher lows along the rising Support Line. Each time price approached this trendline, buyers reacted strongly, confirming persistent demand. Meanwhile, the $3,960–$3,980 Buyer Zone has acted as a key accumulation area, where several fake breakouts occurred, but price quickly returned back above support — indicating seller failure and liquidity sweeps before bullish continuation. On the upper side, we have a clear Resistance Level and Seller Zone near $4,020–$4,040, where the market previously consolidated inside a range. Multiple rejections were seen in this zone, suggesting that sellers are active here and this remains the next significant reaction area for price. Recently, Gold has been gradually moving upward from the buyer zone, forming a steady corrective climb inside the current structure. At this stage, the trend remains bullish while price stays above the ascending Support Line and Buyer Zone. The immediate objective for buyers is a retest of the $4,020–$4,030 Resistance Level, where price may react again based on previous market behavior. A confirmed breakout above this zone would open the way for further continuation, while rejection could lead to another pullback into the support structure. Please share this idea with your friends and click Boost 🚀
Gold’s Inverse Head and Shoulders PatternThe price has been dropping steadily and consistently so far. Check out my previous analysis:
Or click on the attached idea on my chart.
But here’s the thing, momentum is starting to shift.
If you look closely, you'll see that we’re forming an inverse Head and Shoulders pattern. We have the first low, the left shoulder. Then, a deeper low, the head. And finally, a slightly higher low, the right shoulder.
Right now, price is sitting just above that downward-sloping neckline, which is a clear sign that momentum is beginning to change, and there are few obstacles in its way.
My expectation is for a pullback to retest the neckline, filtering out any fake moves, before potentially pushing upward toward 4,085. If the bullish momentum continues with strong volume, I’ll lock into the trend and plan my entry accordingly.
I might even take a buy position here for a more proactive setup. The risk is slightly higher, but with the market structure confirming it, I’m ready to enter because sometimes, the best trades come when you trust your setup.
Just sharing my thoughts on the chart, not financial advice. Always confirm your setup and manage your risk wisely.

CHFJPY: Trend Continuation on Market OpenKey Observations
Pair is in a very structural uptrend according to the D1 TF
Price crossed and closed above DTL last Friday on the H1 TF
Current expectation is for price to continue upside momentum; however, reduced position size due to lower volatility during market open

BITCOIN (BTC/USD): Consolidates—Breakout or Breakdown Ahead?⚠️Bitcoin is currently consolidating following a significant bearish rally.
The price is coiling within a horizontal trading range on a 4-hour timeframe.
Based on the price's reaction to these boundaries, two potential scenarios are anticipated:
Bullish Scenario:
Should the price break and close above 104,640 on a 4-hour timeframe, a bullish trend continuation is expected.
The target for this scenario is 108,000.
Bearish Scenario:
Conversely, if the price drops and closes below 98,780 on the 4-hour timeframe, a bearish movement is anticipated.
The objective for this scenario is 96,000.
Given the current oversold market conditions, a bullish bias is held.
However, further observation is warranted to confirm the market's direction.
What are your expectations?

EURUSD: Bulls Aim for Recovery Toward 1.1580 ResistanceHello everyone, here is my breakdown of the current Euro setup.
Market Analysis
EURUSD has recently shown signs of recovery after bouncing from the key 1.1480–1.1500 Support Zone, which aligns with the lower boundary of the Support Structure highlighted on the chart. This area has acted as a strong Buyer Zone multiple times in the past, and once again, price reacted with a clear bullish impulse, indicating active accumulation from buyers.
Recently, before the rebound, EURUSD was moving inside a Downward Channel, with several fake breakouts that illustrated weakening bearish pressure and lack of continuation from sellers. Eventually, price broke above the downward resistance line, signaling a structural shift away from bearish momentum. Following the breakout, EURUSD began forming higher highs and higher lows, confirming the start of a short-term bullish structure. The pair is now trading above the breakout area and approaching the 1.1580 Resistance Zone, which previously acted as a strong Sell Zone and pivot level. If buyers maintain control above the Support Zone, the bullish scenario remains favorable, suggesting a continued recovery move.
My Scenario & Strategy
From my perspective, as long as EURUSD holds above the 1.1480–1.1500 Support Zone, the bullish setup remains valid. I expect price to continue moving upward toward the 1.1580 Resistance Level as the next key target. A confirmed breakout and hold above 1.1580 would likely open the path for further bullish continuation, potentially targeting 1.1650 and beyond in the medium term.
However, if EURUSD fails to hold above 1.1480 and breaks back below support, this would invalidate the bullish structure and could send price towards lower levels before any new recovery attempt develops. For now, the structure favors buyers, and I will be looking for pullback-based long entries while price remains above support.
That's the setup I'm tracking. Thank you for your attention, and always manage your risk.

XAUUSD: Buyers Target $4,080 Resistance ZoneHello everyone, here is my breakdown of the current Gold setup.
Market Analysis
Gold (XAUUSD) has recently formed a constructive bullish structure after rebounding from the 3,930–3,960 Buyer Zone, which aligns with the lower boundary of the Upward Channel. This demand zone has consistently acted as a strong accumulation area, indicating that buyers are actively defending it. Prior to this rebound, price moved within a Downward Channel, where several fake breakouts occurred — showing that sellers were gradually losing momentum and failing to maintain downside pressure.
Currently, a breakout from the Downward Channel shifted the market tone, and since then, XAUUSD has started forming higher lows, signaling an early trend reversal. The price is now trading back inside a new Upward Channel, and the structure suggests buyers are preparing for a continuation move. At the moment, XAUUSD is approaching the mid-range of the channel, while the next major resistance sits near 4,130, which previously acted as a supply level and point of distribution.
My Scenario & Strategy
The current setup suggests that as long as price remains above the 3,930–3,960 demand region, the bullish setup remains intact. I expect Gold to continue moving gradually toward the 4,080–4,130 resistance zone in the short term. A confirmed breakout above 4,130 would likely signal strong bullish continuation, opening the way for a larger upward move toward 4,200 and beyond.
However, if XAUUSD breaks back below 3,930, the bullish structure would be invalidated, and price could revisit deeper support levels before attempting another upward leg. For now, I prefer to look for long entries on pullbacks within the channel, targeting a continuation toward the resistance levels mentioned above.
That's the setup I'm tracking. Thank you for your attention, and always manage your risk.

BTCUSD Tests Buyer Zone — Eyes Break Below $100KHello traders, here’s my current outlook on Bitcoin (BTCUSD). The market continues to trade within a broader bearish structure after breaking down from the previous rising channel. The price failed to hold above the $110,000–$111,000 Seller Zone, where multiple fake breakouts occurred, indicating strong bearish pressure and aggressive selling activity in that region. After the rejection from the Seller Zone, BTC shifted into a descending trend structure, forming lower highs along a clearly defined Resistance Trendline. Each corrective move to the upside has been capped by this trendline, confirming that sellers are maintaining control. Meanwhile, the Support Level around $100,200–$101,000 has acted as a key Buyer Zone, where price has repeatedly paused and reacted, suggesting that buyers are attempting to absorb selling pressure here. Currently, BTC is consolidating just above this Support Zone, but the overall momentum remains bearish. If the price fails to break above the descending Resistance Line, we could see a continuation of the downtrend, likely pushing toward a retest of the $100,200 Support Level. A confirmed breakdown below this level would expose the next downside support levels and reinforce the sellers’ dominance. However, if buyers manage to hold the price above $100,200 and force a breakout above the descending Resistance Line, a short-term corrective recovery could unfold toward the $103,000–$105,000 region. This area remains critical and is likely where sellers may look to re-enter the market based on previous reaction structure. For now, the market structure favors a bearish bias, with the trend down and sellers maintaining stronger control. I am watching for a reaction at the current support — if the level breaks, continuation lower becomes the primary expectation. Please share this idea with your friends and click Boost 🚀

Nifty Metal Index NIFTY METAL INDEX Updated Chart for members Reference.
On Big Breakout (BO). On Confirmation Big rally on card 🧐
Support, Resistance /BO level, Tgt, Updated Tgt Marked in Chart.
Stocks to be noted
TATA STEEL
HINDALCO
JINDAL STEEL
SAIL
NMDC & NMDC STEEL
GALLANT ISPAT
WELSPUN
GPIL

Berkshire Hathaway is breaking out of channelBerkshire Hathaway NYSE:BRK.B is breaking out of its long descending channel on the daily timeframe.
After months of consolidation, price has finally pushed through the upper boundary near $495, signaling the start of potential upward momentum.
If this breakout holds, the next major target could be around the mid-range near $520 — setting up what could become a powerful trend reversal for one of the market’s strongest giants.

GBPJPY BULLISH BIAS|LONG|
✅GBPJPY after mitigating the key demand level, price shows bullish order flow and imbalance fill. A potential rally may target the next external liquidity zone above recent swing highs. Time Frame 4H.
LONG🚀
✅Like and subscribe to never miss a new idea!✅

BTCUSD Short: Bearish Rejection Targeting $100.6K Support ZoneHello traders! Bitcoin (BTCUSD) continues to trade within a well-defined descending channel, reflecting sustained bearish pressure after the rejection from the $116,000 Supply Zone. The market previously experienced a Fibonacci Arc retracement followed by a strong sell-off, signaling exhaustion from buyers and the formation of a broader corrective structure.
Currently, we have seen multiple fake breakouts on both the upper and lower boundaries of the channel, suggesting that liquidity sweeps are actively influencing volatility. Notably, price recently tapped the major Demand Zone around $100,600, a level that has historically triggered strong reactions. The sharp wick and immediate recovery from this support indicate buyer accumulation and defense of the zone. A short-term pivot point has now formed near $103,500–$104,000, marking a key decision area. If buyers hold above the $100,600–$101,000 support, a corrective move toward the upper channel boundary becomes increasingly likely.
I expect Bitcoin to retest the $103,500–$105,000 Pivot Resistance Zone, which aligns with the mid-channel level and previous breakout point. If price shows rejection in this region — such as bearish candlestick patterns or weakening momentum — it would provide a favorable entry point for short positions. A break and hold below $100,600 would strengthen bearish momentum and may trigger a continuation toward $98,000. However, if the price breaks and closes above $105,200, the short setup becomes invalid, as this would signal a potential shift in structure and a move toward $110,000. Manage your risk!

EURUSD Long: Rebound Setup Targeting 1.1560 Pivot ResistanceHello traders! EURUSD continues to trade within a clearly defined descending channel, maintaining a consistent bearish structure characterized by lower highs and lower lows. The recent rejection from the 1.1660 Supply Zone once again confirmed strong seller presence at that level. Additionally, the fake breakout above the channel resistance further highlighted the inability of buyers to shift the market structure.
Currently, price continued moving lower and is now testing the 1.1475–1.1500 Demand Zone, which aligns with the lower boundary of the descending channel. This area has previously acted as a reaction zone, meaning buyers have shown interest here before. The recent candle structure suggests that bears are slowing down near the demand area, indicating potential for a corrective pullback rather than immediate continuation downward.
In my opinion, If buyers manage to defend the 1.1475 Demand Zone, we could see a short-term bullish rebound toward the 1.1560 Pivot Resistance. This creates a favorable area for short-term long positions aiming for corrective upside movement. However, if sellers break below 1.1475 and price closes beneath the demand line, this would signal continuation of the primary bearish trend, opening the path toward lower levels around 1.1420–1.1380. For now, as long as price holds above the demand zone, a corrective rebound remains the more probable scenario. Manage your risk!

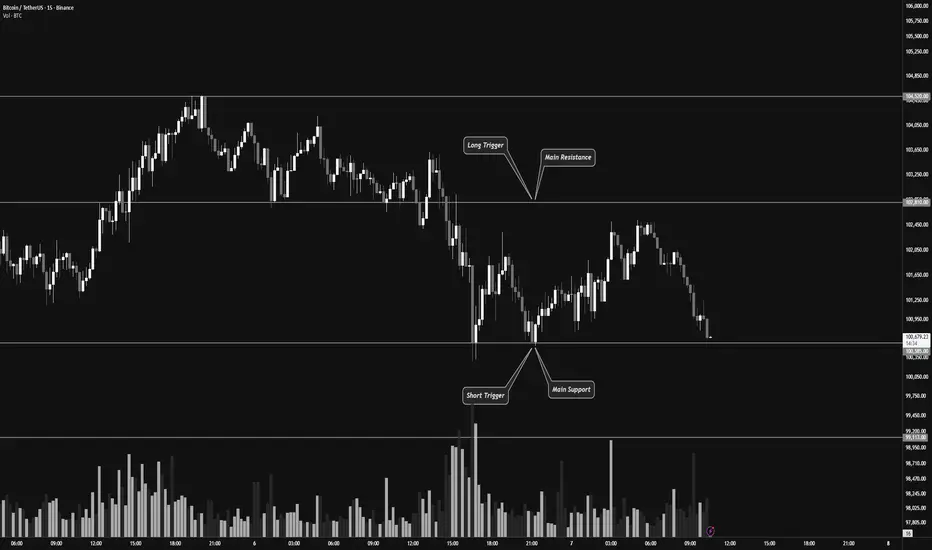
Break of Support or Multi-Timeframe Trend Reversal ?👋🏻 Hey everyone! Hope you’re doing great! Welcome to SatoshiFrame channel.
✨ Today we’re diving into the 15-Mimutes Bitcoin analysis. Stay tuned and follow along!
👀 On the 15-minute timeframe for Bitcoin, we can see that after breaking a multi-timeframe support, Bitcoin is currently testing its support zone around $100,585.
If this zone breaks, Bitcoin could continue its downward move and experience further decline.
However, if it moves upward and breaks the resistance zone around $102,810, it could trigger a potential trend reversal.
🕯 Pay attention to Bitcoin’s volume — the volume indicator currently shows an increase in selling pressure, suggesting that we might see a short-term volume consolidation before the price continues downward again.
✍️ The current scenarios for Bitcoin include both long and short setups, which you can use to plan your trades based on how the market reacts.
🟢 Long Position Scenario : A break above the $102,810 resistance zone, accompanied by increasing buy volume and bullish momentum, could signal a good long opportunity toward higher levels.
🟥 Short Position Scenario : A break below the $100,585 support zone, along with increasing sell pressure turning into strong selling momentum, could offer a short opportunity in line with the current trend.
❤️ Disclaimer : This analysis is purely based on my personal opinion and I only trade if the stated triggers are activated .
BTCUSD: Falling Wedge Reversal in Play Toward 106KHello everyone, here is my breakdown of the current Bitcoin setup.
Market Analysis
Bitcoin (BTCUSD) has recently shown signs of recovering bullish momentum after rebounding from the 100,600–101,000 Support Zone, which has acted as a key demand region during previous tests. The market experienced a fake breakout below the wedge support line, but buyers quickly stepped back in, pushing the price back inside the structure — a classic indication of seller exhaustion and accumulation interest.
Currently, BTC is trading inside a falling wedge pattern, which is typically considered a bullish reversal formation. The recent bounce from the lower boundary suggests that buyers are attempting to regain control, especially after the sharp decline from the 113,700 Resistance Zone. The price is now gradually approaching the mid-range of the wedge, signaling a potential continuation toward the upper resistance line.
My Scenario & Strategy
If Bitcoin holds above the 100,600–101,000 support, the bullish scenario remains valid. I expect the price to gradually move toward the 104,000–106,000 area as the next short-term target, aligned with the wedge resistance line. A breakout and confirmed hold above the wedge resistance would likely signal a trend reversal, opening the door for a larger continuation toward the 113,700 resistance zone, and possibly beyond.
However, if BTC loses the 100,600 support again and closes below the wedge, this would invalidate the bullish setup and could trigger a deeper move toward 98,000 before a new structure forms.
That's the setup I'm tracking. Thank you for your attention, and always manage your risk.

EURUSD Holds Key Support — Potential Recovery Toward 1.1540Hello traders, I’d like to share my view on EURUSD. The market has been trading in a consistent downtrend, respecting the descending Resistance Line, which has acted as a strong dynamic barrier for price throughout the recent move. Each attempt to break above this trendline resulted in either a turnaround or a fake breakout, confirming continued bearish pressure. However, recently price has reached an important Buyer Zone near 1.1480, where strong reaction has been seen several times in the past. This area aligns with horizontal support, increasing its significance. After touching the buyer zone again, EURUSD has shown initial signs of accumulation and early bullish momentum. Currently, the price is attempting to recover from this demand area, forming a breakout above the short-term Support Line — which now potentially flips into bullish structure. From here, I expect EURUSD to attempt a move toward the next resistance area around 1.1540, which represents the nearest Resistance Level. A confirmed breakout above this zone would open the path toward the higher Seller Zone around 1.1660, where previous fake breakouts occurred. But for now, the key confirmation will be whether the price holds above 1.1480 Buyer Zone. A breakdown below the zone would invalidate the bullish setup and likely continue the downtrend. Please share this idea with your friends and click Boost 🚀

Gold Forms Higher Low — Potential Upside Toward Resistance LineHello traders, here’s my current outlook on Gold (XAUUSD). Gold has recently transitioned out of a strong bearish phase, where the price moved inside a descending channel and found significant support near the $3,930–$3,950 Buyer Zone. This support zone has proven to be a key reaction level multiple times, with several fake breakouts followed by strong bullish recoveries — confirming the presence of active buyers. After breaking out of the descending channel, the price began forming a higher-low structure, aligning along the Support Line, suggesting that bullish momentum is gradually returning. However, the market remains capped by the Resistance Line, where several strong rejections occurred, indicating that sellers are still defending higher levels. At the moment, Gold is trading between the Buyer Zone and the $4,020–$4,140 Resistance Zone (Seller Zone). If buyers manage to hold support and form another bullish push from the current levels, we could see an upward move targeting the $4,020 area first, and if momentum continues — a potential retest of the key resistance at $4,140. For now, the structure shows accumulation above strong support, suggesting that buyers still have the advantage. Please share this idea with your friends and click Boost 🚀
