Buy Kfin Technologies above 1,145 INR Buy Kfin Technologies above 1,145 INR.
Target: 1,180 / 1,220 INR.
Stoploss: 1,078 INR.
Breakout!

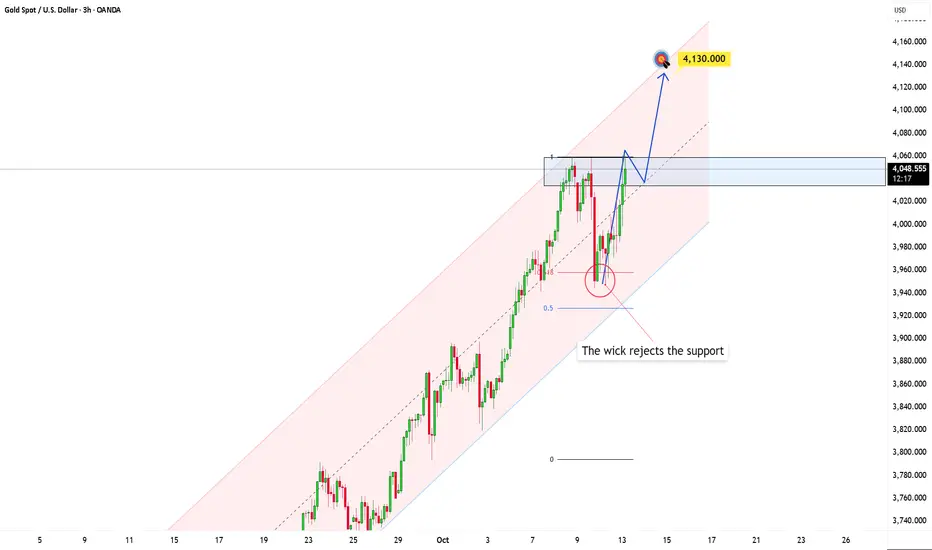
Gold has the potential to set a new highHey everyone, it's Kilian here!
Gold is at a very interesting phase right now. After experiencing a strong price surge within a parallel ascending channel, the market is now showing signs of consolidation at these high levels. This suggests that the buyers still have control, and the bullish momentum remains intact for now.
If the price manages to break through this area with a strong bullish candle and high volume, it will confirm the dominance of the buyers and open up the potential for a new rally towards the target around 4.130, which aligns with the upper boundary of the channel.
However, if the price fails to break through and is instead rejected by strong selling pressure, the appearance of a large bearish candle could signal that the upward momentum is weakening. In this scenario, the price may fall back to test the lower boundary of the channel.
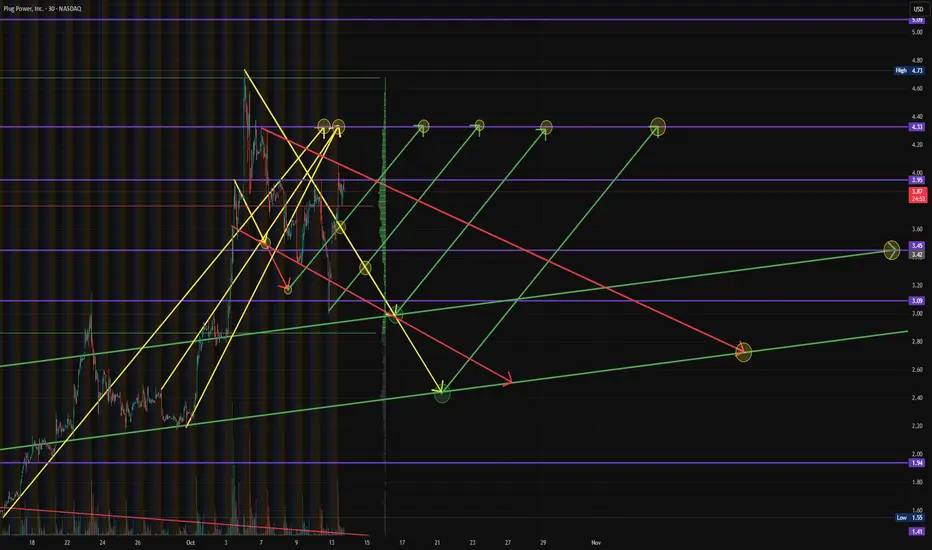
$PLUG - Plug Power - $4.33 PTNASDAQ:PLUG consolidated to chart the $3.09 and found support like we initially targeted and rebounded to $3.95 before showing potential consolidation for additional entries.
Still holding a $4.31 RT to breakout to that $5.09 PT will potentially providing re-entry at $3.45 if it does consolidate again first.
Deleveraging done, waiting for a 116k confirmation__________________________________________________________________________________
Market Overview
__________________________________________________________________________________
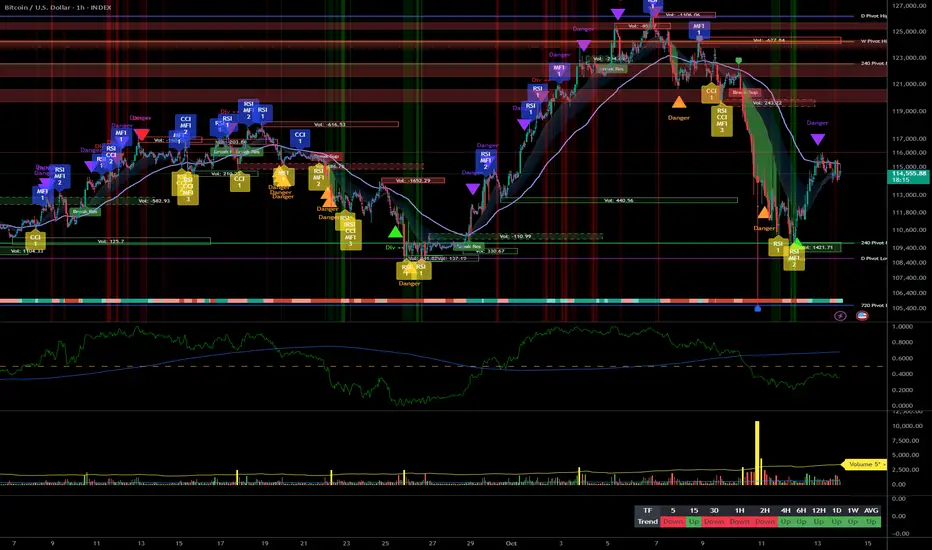
BTC recovered a chunk of Friday’s wipeout and is ranging back below 116k, with leverage reset and volatility still elevated.
Momentum: 📈 Technical rebound but still a range under 116k; upside needs a clean reclaim above 116k.
Key levels:
- Resistances (STF/MTF): 115.8–116.2k (pivot) • 119.9–120.5k • 124–126k (HTF).
- Supports (STF/HTF): 114.0–114.3k • 110.8–111.5k (pivot cluster) • 108.8–109.0k.
Volumes: Very high on 4H/6H during capitulation, only moderate on 1D so far.
Multi-timeframe signals: 1D/12H filter is Up, while 6H→1H sit in NEUTRE VENTE until 116k is reclaimed; 15m ticks NEUTRE ACHAT only for execution.
Risk On / Risk Off Indicator context: Overall NEUTRE VENTE — it contradicts the HTF bullish filter and argues for patience under 116k.
__________________________________________________________________________________
Trading Playbook
__________________________________________________________________________________
Primary stance: higher-timeframe bullish, but capped under 116k — stay progressive and let price confirm.
Global bias: Cautious bullish above 111k with validation >116k; swing invalidation on a daily close <111k.
Opportunities:
- Buy breakout: Go long on 4H/2H close >116.2k targeting 117.8k then 119.9–120.5k.
- Breakout add-on: Add if 118–120k flips to support (pullback holds) toward 122k.
- Tactical sell: Short clean rejections at 115.8–116.2k or loss of 114k, targeting 112.5k/111.1k.
Risk zones / invalidations:
- A confirmed break <111k reopens 108.8k then 105.6k (bullish invalidation).
- Repeated 116–118k rejections with the Risk On / Risk Off Indicator at NEUTRE VENTE favor range fades.
Macro catalysts (Twitter, Perplexity, news):
- US–China: 100% tariff rhetoric followed by a softer tone → headline volatility.
- Gold at ATH and Middle-East détente → risk appetite and hedging coexist.
- Fed/BoE: easing bias in the backdrop, but Fed tone remains mixed.
Action plan:
- Long (116.2k breakout): Entry 116.0–116.3k / Stop 114.8k / TP1 117.8k, TP2 119.9–120.5k, TP3 122k • R/R ~2R→3R.
- Short (116k rejection or <114k): Entry 115.6–116.0k or <114.0k / Stop 116.6k / TP1 114.0k, TP2 112.5k, TP3 111.1k • R/R ~1.8R→3R.
__________________________________________________________________________________
Multi-Timeframe Insights
__________________________________________________________________________________
HTFs stay constructive if 111k holds, while mid/low TFs chop below 116k awaiting confirmation.
1D/12H (filter Up): Bullish structure intact above 110.8–111.5k; sustained acceptance >115.8–116.2k opens 118–120k.
6H/4H/2H/1H (NEUTRE VENTE): Range 113.5–116k; 4H/6H “Very High” volume on the flush suggests a base, but no 116.2k close = still defensive.
30m/15m (execution): Compression below 116k; 15m flips NEUTRE ACHAT on trigger. Clean 30m/15m >116.2k + rising volume creates MTF confluence.
Significance: Bullish confluence = defended 111k + 116.2k breakout + expanding volume; divergence = Risk On / Risk Off Indicator stuck NEUTRE VENTE under 116k.
__________________________________________________________________________________
Macro & On-Chain Drivers
__________________________________________________________________________________
Leverage has been cleansed and macro détente is tentative, supporting the bounce while risk appetite remains selective.
Macro events:
- US–China: 100% tariff headlines then softer messaging; de-escalation possible but reversible.
- Geopolitics: hostage releases/ceasefire signals lower tail risk; gold at a new ATH underscores persistent hedging demand.
- Central banks: BoE leaning to cuts; Fed’s tone mixed despite an easing bias.
Bitcoin analysis:
- Historic leverage flush on Friday, rebound to ~115k from ~111.4k → cleaner positioning.
- Must reclaim 116k then 118–120k before the prior breakdown area below ~122k.
- Flows/treasuries: USDT injections (e.g., 100M to Kraken) and MARA +400 BTC add liquidity, not strictly directional.
On-chain data:
- Massive OI wipe and record liquidations; sentiment back to “Fear”.
- Strong on-chain support 117–120k; above it, confluence improves materially.
Expected impact:
- “Cautious détente” + deleveraging = conditional bullish bias; technically, confirmation is >116k then >118–120k.
__________________________________________________________________________________
Key Takeaways
__________________________________________________________________________________
The market stabilized after a record flush, but 116k remains the gatekeeper.
- Trend: HTF bullish, STF neutral until 116k is reclaimed.
- Best setup: Confirmed breakout >116.2k with volume toward 117.8k then 120k.
- Key macro: US–China détente and gold at ATH — supportive yet hedged risk tone.
Stay nimble: act on signals, protect below 114k, and watch 111k as swing invalidation.
GBPUSD: Testing Daily HTLKey Observations
Daily Timeframe
EMA20 crosses below EMA60 > signals a weak downtrend
Overall, this pair is topping out given the lower high formed
H1 Timeframe
Price fails to hold above the EMA band as it quickly cross below it
Very likely momentum to the downside will pick up

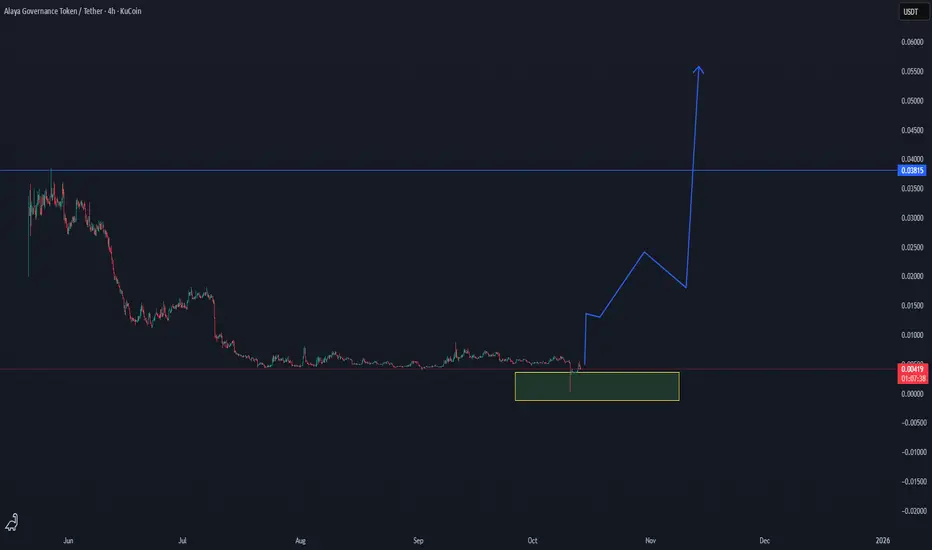
AGT/USDT — Breakout Formation from Accumulation Zone ImminentAGT/USDT — Breakout Formation from Accumulation Zone Imminent 🚀
AGT has entered a strong accumulation zone after a prolonged downtrend, showing the first technical signs of a potential trend reversal. The current consolidation within the highlighted support block suggests that buyers are stepping in, preparing for a possible breakout phase.
Low time frame confirmation is here
📊 Current Price: $0.0042
🟢 Accumulation Zone: $0.0038 – $0.0045
🔹 Breakout Target: $0.038
The chart shows a typical bottoming structure, with a long accumulation base forming under historical resistance. Once AGT confirms a breakout above $0.006, momentum could accelerate rapidly — targeting the $0.02 → $0.038 zones.
This setup mirrors classic early-cycle patterns seen before major upward expansions in similar low-cap assets. A strong breakout candle with volume will serve as confirmation of the next phase.
📈 Technical Outlook:
Accumulation structure in place
Breakout trigger above $0.006–$0.007
Main breakout target around $0.038
Summary:
AGT/USDT is building strength at the bottom of its range. If volume confirms, a major reversal cycle could be underway, opening the path toward a breakout to $0.038 and beyond.
🎯 Targets: $0.02 → $0.038
📊 Bias: Bullish — Breakout Setup Forming
Bitcoin (BTCUSD): Bearish Short SetupHello everyone, Kilian here.
Let’s take a closer look at BTCUSD with a logical and structured approach.
Currently, the market is showing a classic bearish formation. The price has broken through a key support level and the first signs of dominant short-side pressure are already visible. This is not just noise but a signal that short positions are gaining control.
After the breakdown, the market is pulling back to retest the broken area. In technical analysis, such a retest often confirms that the bearish momentum is intact and that short traders remain in charge.
Given this context, it is unlikely that BTCUSD will recover the old support, which now acts as resistance. A rejection from this level could trigger the next short-driven move, with a projected target around 118,200.
Unless a strong reversal emerges, the probability remains in favor of continued downside pressure.
Stay disciplined, follow the signals carefully, and remember that in trading, logic and risk management always outperform emotions.

USDCHF 1D – the dollar wakes upAfter a long decline, the pair finally shows some life - on the daily chart we have a clean breakout from the falling wedge followed by a retest.
Price now holds inside the buy zone (0.795–0.803) - the perfect base for a potential bullish move.
Technically, the setup looks solid:
✅ breakout confirmed
✅ retest completed
✅ volume rising
✅ momentum turning bullish
The first resistance sits at 0.808, where a minor pause could appear.
If buyers hold control above that level - the path to 0.823 (1.618) and later 0.848 (2.618) opens up nicely.
Structure remains bullish as long as the buy zone stays intact.
And remember: you don’t fight the wedge - you ride the breakout.

Trade Setup: Kingfa Science & Technology (India) LtdAction: Buy
Entry Level: 4,670–4,690 (breakout candle level)
Target 1: 4,764
Target 2: 4,962
Stoploss: 4,400 (below triangle support)

Euro may Break the 1.1550 Support LevelHello traders, I want share with you my opinion about Euro. The dominant market pressure for the Euro has been bearish since the price failed to sustain its rally to the 1.1920 high. This reversal initiated a significant downward trend for EURUSD, characterised by the breakdown of several key market structures, including the prior upward channel and the major 1.1740 resistance level. Currently, this bearish impulse has brought the price down to the major horizontal support level at 1.1550, an area which also coincides with a historical buyer zone. The price is now in a consolidation phase, attempting a minor corrective bounce from this support. In my mind, this bounce appears weak and lacks the momentum to signal a true reversal. I expect that this small upward movement will fail to attract significant buying interest and will soon be overcome by the prevailing selling pressure. I think a failure of this bounce will lead to a decisive breakdown below the 1.1550 support level. Therefore, I have placed my TP at 1.1510, targeting a new structural low in what I believe is a continuation of the primary downward trend. Please share this idea with your friends and click Boost 🚀
Disclaimer: As part of ThinkMarkets’ Influencer Program, I am sponsored to share and publish their charts in my analysis.

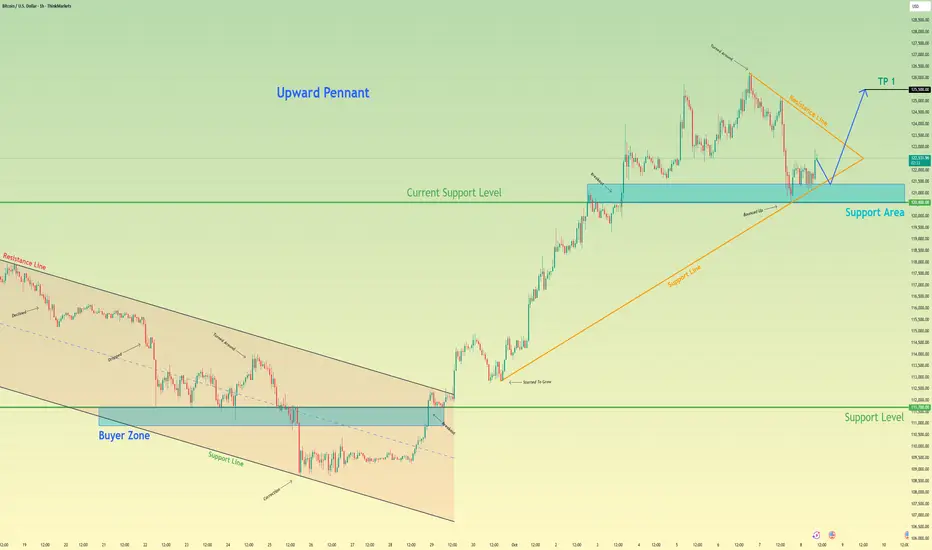
Bitcoin will Bounce From Pennant Support and Rally HigherHello traders, I want share with you my opinion about Bitcoin. The market structure for Bitcoin has recently undergone a major transition from bearish to bullish, following a decisive reversal from the 111700 support level. This shift triggered a breakout from the previous descending channel and gave rise to a new upward pennant pattern, a clear signal of strengthening bullish sentiment. After setting a new all-time high around 126000, BTC has entered a short-term corrective phase, retracing toward the 120600 area, which coincides with both the pennant’s ascending support line and a key horizontal support zone. To me, this pullback looks like a textbook healthy correction within an ongoing uptrend, allowing the market to consolidate before the next move higher. I anticipate that buyers will step in around this level, defending the support and initiating a strong rebound. If the price holds and bounces off the pennant’s support line, it could trigger a bullish breakout, resuming the upward momentum. Based on this outlook, my TP target remains set at 125500. Please share this idea with your friends and click Boost 🚀
Disclaimer: As part of ThinkMarkets’ Influencer Program, I am sponsored to share and publish their charts in my analysis.
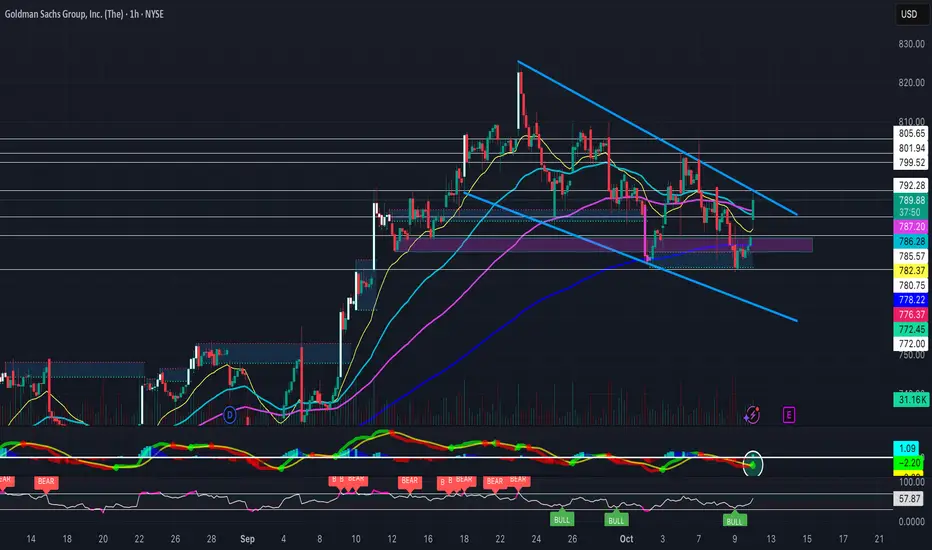
Falling Wedge Heading into EarningsAfter previously breaking out of a falling wedge to hit new ATH's, NYSE:GS is holding yet another falling wedge heading into earnings next week. (Previous Chart Below)
Its EMA's are curling upwards, some bullish hidden divergence on the RSI, a MACD golden cross, and a bullish FVG formed as support- Will definitely be watching this one.
GBPUSD WILL KEEP FALLING|SHORT|
✅GBPUSD confirms a bearish breakout below the supply level as price rejects premium pricing. Smart Money distribution aligns with bearish order flow, suggesting continuation toward the 1.3220 liquidity pool for rebalancing. Time Frame 6H.
SHORT🔥
✅Like and subscribe to never miss a new idea!✅

GMDC Breakout Setup: Buy Above 637Entry: Buy above 637 (recent resistance and Fibonacci breakout spot).
Target 1: 673 (Fibonacci 0.382 retracement).
Target 2: 703 (Fibonacci 0.5 retracement).
Target 3: 733 (Fibonacci 0.618 retracement).
Stoploss: 615 (below recent support and trendline).
Volume spike and RSI uptick signal momentum

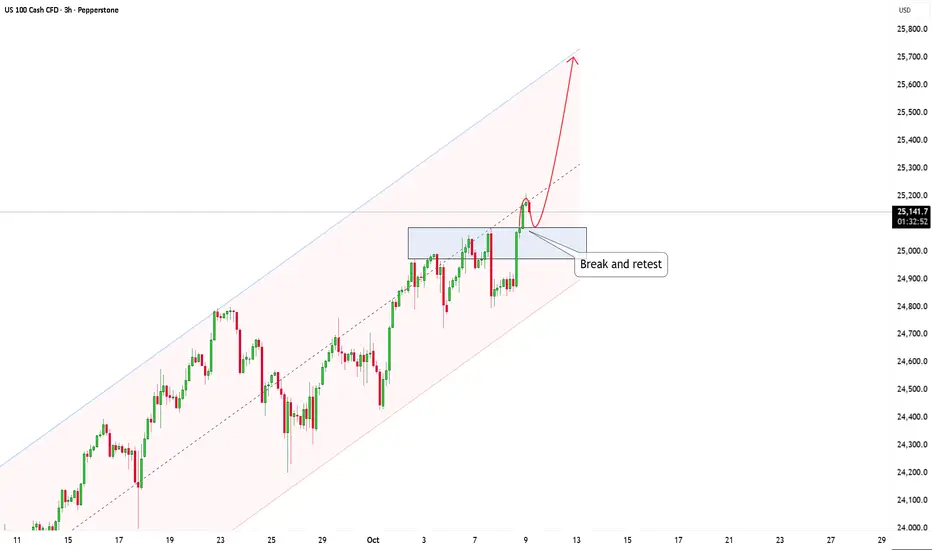
NAS 100: Price Surge Potential After Break and RetestHi everyone, Kilian here!
Let's take a closer look at the NAS 100 on a 3-hour timeframe, as it’s currently showing some interesting movements. The price has been steadily moving within an ascending channel, with the buyers continuing to dominate and push the price higher.
What’s particularly interesting right now is the breakout level. As the price approaches this level, we’ll be watching closely to see if the buyers can maintain control. A break and retest scenario could unfold here. If the price breaks through this level and then comes back to retest it (testing the broken level as support), and the buyers manage to hold it, this would be a strong confirmation that the buyers are still in control, and we could see price continuing to move towards the upper boundary of the channel.
However, if the price drops back below this level after the breakout, this could signal a false breakout, which may lead to a short-term correction as the sellers take control.
Currently, the momentum is still in favor of the buyers, and as long as the price holds above the breakout level, the bullish structure remains intact.
What do you think? Feel free to share your thoughts in the comments!
And remember, discussions within the TradingView community are a great way for all of us to improve our trading skills and grow together.
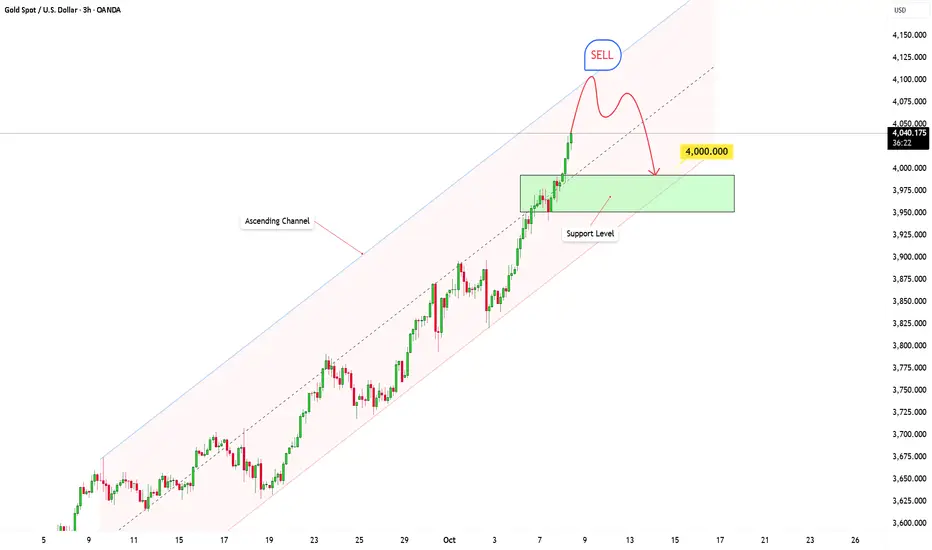
Gold Setup: Overbought Conditions Indicate Potential PullbackHey everyone, it's Kilian!
Right now, gold is entering a really interesting phase. The price is approaching the 4100 level, a key psychological threshold, and it could potentially become a dynamic resistance formed by the upper boundary of the ascending channel. This is a crucial area where selling pressure might increase, leading to the possibility of a short-term pullback or profit-taking.
Based on the current market structure, if the price confirms rejection at this resistance level, there's a high likelihood of a price drop. The nearest target for this decline could be around the 4000 level, near the lower boundary of the channel. However, if the price breaks through this support level, the bullish structure will be invalidated, and we may witness a continuation of the downtrend.
This setup reflects the potential for a pullback after a strong upward move, as indicated by the current market structure. If you agree with this analysis or have any additional insights, feel free to share your thoughts in the comments!
Gold Market: Waiting for the Necessary CorrectionHey everyone, Kilian here!
Right now, XAUUSD is at a crucial point. After a strong surge, the price of gold broke through the upper boundary of its channel, but it’s now pulling back. This correction could signal that the buying momentum is starting to fade, hinting at a potential shift in market direction.
If selling pressure increases, it’s likely that the price will test the middle, or even the lower boundary of the channel. This could indicate a deeper correction as the market consolidates before deciding its next move.
For now, we need to closely monitor the price action. If buyers can regain control and push the price back above the previous breakout level, it would be a strong confirmation that the uptrend is still intact. However, if the price continues to slide, we could be witnessing a short-term bearish phase.
I hope your trades are going well. Stay tuned and follow me for more updates and in-depth analysis!

EURUSD BEARISH BREAKOUT|SHORT|
✅EURUSD confirms a clean breakout below the key level, showing bearish continuation as price rejects premium pricing. Liquidity has been cleared above structure, and Smart Money targets the 1.1520 zone for rebalancing. Time Frame 6H.
SHORT🔥
✅Like and subscribe to never miss a new idea!✅

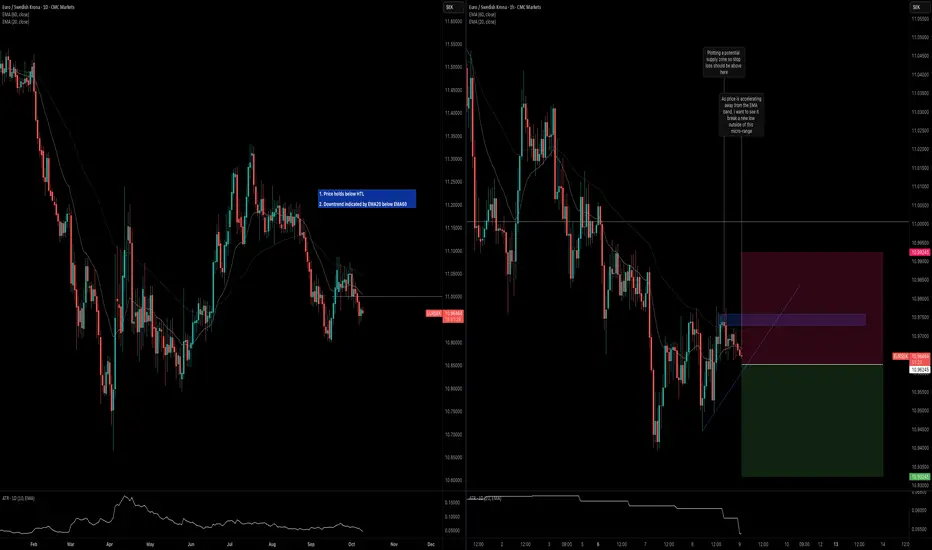
EURSEK: Trend ContinuationKey observations on the daily and H1 timeframes below.
Daily Timeframe:
Price is holding below HTL
Downtrend is indicated by EMA20 below EMA60
H1 Timeframe:
Price is accelerating away from EMA band
Sell stop set to enter when price breaks out of the micro-range
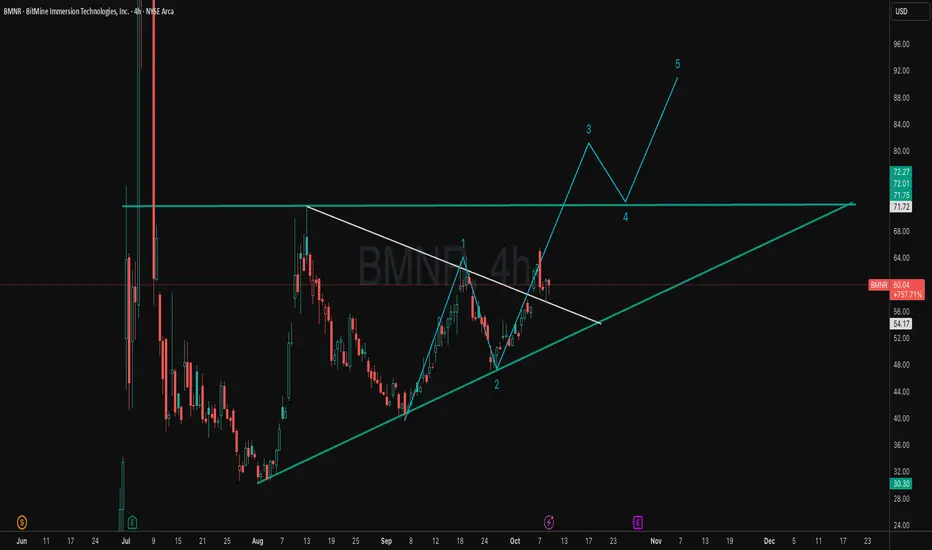
BMNR: Post-Compression Breakout Map (Wave 3 → 4 → 5)Price action is compressing against horizontal resistance while riding a rising base, suggesting a completed 1–2 and positioning for an impulsive wave 3 breakout, followed by a wave 4 retest and a measured wave 5 extension.
Confirmation comes on a decisive breakout and hold above the range high; a brief throwback into former resistance is acceptable if structure stays intact.
Invalidation sits on sustained closes back below the rising trend line or a clean breach of the wave‑2 pivot, which would imply the structure is morphing into a corrective pattern.
Execution plan favors scaling on confirmation, trimming into projected wave 3 strength, re‑loading on a controlled wave 4 pullback, and final distribution into wave 5 targets.
If momentum stalls or gaps fail to hold, reduce risk and reassess the count versus an ABC/flat alternative.
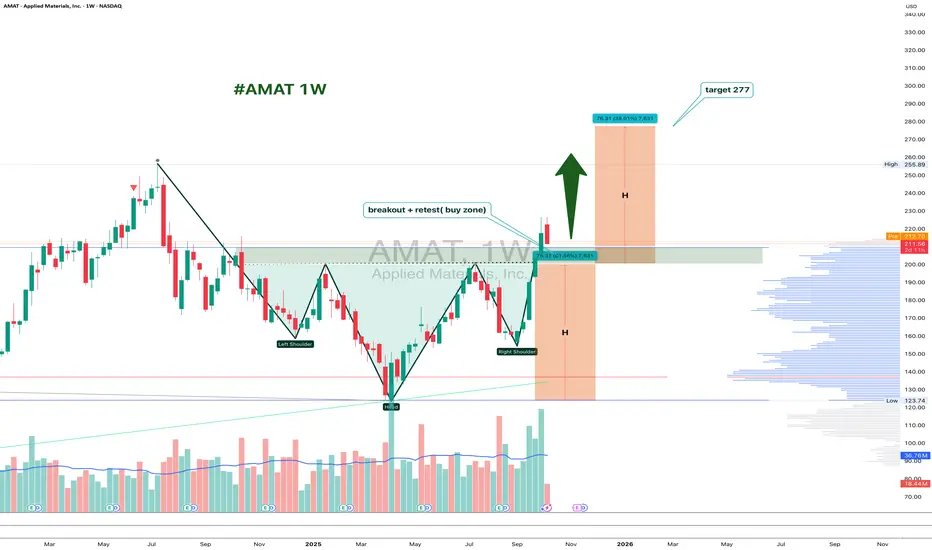
AMAT 1W: Retesting the Neckline Before the Next Move?On the weekly chart, Applied Materials (AMAT) has completed a clean inverted head and shoulders breakout around $226, and is now pulling back to retest the neckline zone near $200–211.
This area acts as strong support. If buyers defend it, the bullish pattern stays valid, with a projected target around $277, matching the 1.618 Fibonacci extension.
From a fundamental perspective, AMAT remains a key semiconductor player, benefiting from ongoing demand for chip-making equipment. The pullback looks more like a healthy pause than weakness - a classic chance for latecomers to re-enter.
Funny enough, the “head and shoulders” pattern, known for signaling tops, is doing the exact opposite here - apparently, even the market likes a good plot twist.
US30: Consecutive breakouts signal an emerging downtrend
SPREADEX:DJI – When price rejects the high, the market begins to shift
On the 30-minute chart, price action is clearly signaling a loss of bullish momentum and a transition toward a bearish structure.
________________________________________
🧠 Price Action Analysis
1. First Failed Breakout
Price initially broke above the ascending trendline that had held since early October — but failed to hold the breakout.
➤ A classic early warning of buyer exhaustion, often seen during distribution phases.
2. Multi-Layered Resistance Zone
The 46,725 – 46,779 region has become a clustered resistance zone, rejecting price repeatedly.
➤ Multiple rejections here suggest dominant selling pressure, with strong supply overhead.
3. Second False Breakout
A more subtle second breakout attempt followed — but again, price was swiftly rejected.
➤ Consecutive failed breakouts typically indicate a lack of conviction and precede sharp reversals.
________________________________________
📉 Trend Structure Has Shifted Bearish
• Lower highs and lower lows now visible
• Price broke below the previous trendline
• Pullback attempts failed to reclaim broken support
• Market is respecting resistance instead of support
➡ These are clear signs of a short-term downtrend emerging.
________________________________________
🔻 Trading Strategy: Favoring Sell Setups in the New Bearish Context
✴️ Scenario 1: Sell at Retest of Proven Resistance Zone
• Optimal Sell Zone: 46,700 – 46,750
• This area has already triggered two failed breakouts — a third touch could be the ideal trap for late buyers
• Watch for bearish rejection candles (pin bars, bearish engulfing, etc.)
Suggested Sell Limit Order:
→ Entry: 46,730
→ Stop Loss: 46,830 (above prior swing high)
→ TP1: 46,500
→ TP2: 46,300
→ Risk-Reward: At least 1:2
_______________________________________
✴️ Scenario 2: Momentum Sell on Breakdown of Local Support
• Trigger Level: 46,580 — if price breaks below with strong momentum (long red candle, increased volume)
• Confirms trend continuation after consolidation
Suggested Sell Breakout Order:
→ Entry: 46,580
→ Stop Loss: 46,680
→ Target: 46,350 – 46,200
→ Tip: Use smaller position size if breakout appears weak to avoid getting trapped in a fakeout
________________________________________
🎯 Trade Management
• Only enter trades with clear price rejection or momentum confirmation
• Move SL to breakeven after TP1 is hit to lock in safety
• Exit the trade if price closes above 46,830 — that would invalidate the bearish thesis
________________________________________
False breakouts leave a trail — for those who know how to read it. It's not a failure. It’s the market whispering that direction has changed.
Please like and comment below to support our traders. Your reactions will motivate us to do more analysis in the future 🙏✨
Harry Andrew @ ZuperView

EURAUD: DowntrendKey Observations
Daily Timeframe
EMA20 is slightly lower than EMA60 and price is below both to indicate weak downtrend
However, price is also holding below a daily HTL so buying pressure also remains weak or non-existent
H1 Timeframe
Price is exiting away from the EMA band and below both EMA20 and EMA60 to indicate high probability of downside momentum
If price crosses below the ATL, that's a further indication of downside momentum
