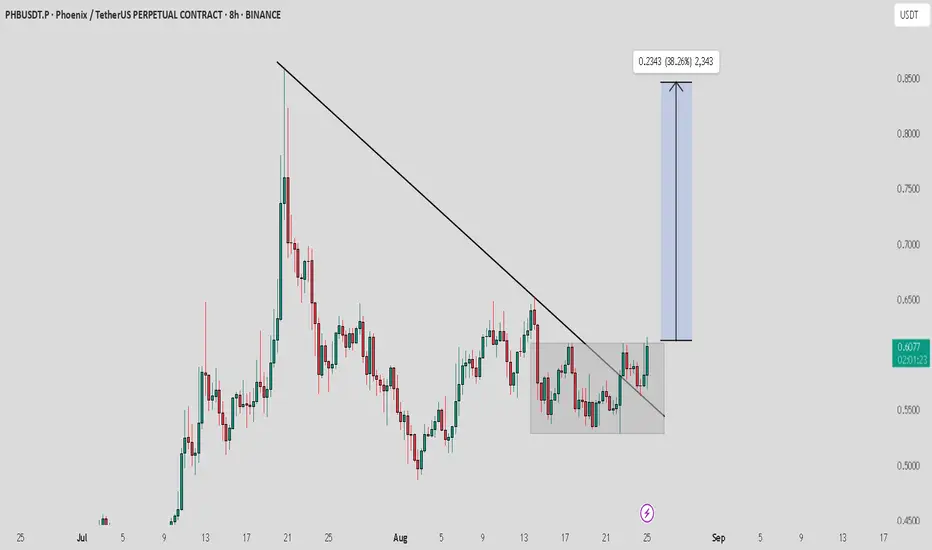
PHB / USDT : Looking bullish..Waiting for box breakoutPHB/USDT has broken above its trendline resistance after a period of consolidation. This breakout is showing strong potential, and if momentum sustains, price could rally toward the $0.80–0.85 zone.
Best approach: Wait for confirmation on retest or a strong bullish candle with volume before entering to avoid fake breakouts. Always manage risk properly.
Breakout!
GOLD to $3,450? The Most Important Breakout of 2025
🔥 Gold has been one of the most talked-about assets in 2025, and now it’s testing the critical $3,370 resistance zone once again (price at $3,372 as of Aug 24).
📈 Bullish Case:
If gold breaks and closes above $3,370, we could see momentum push toward $3,390–$3,395 in the short term.
📉 Bearish Case:
If rejected here, support remains strong around $3,325–$3,330, aligned with the 100-day SMA.
👉 Do you think gold will finally break higher this week, or get rejected again? Drop your thoughts in the comments
Disclaimer:
This is not financial advice. Shared for educational purposes only.

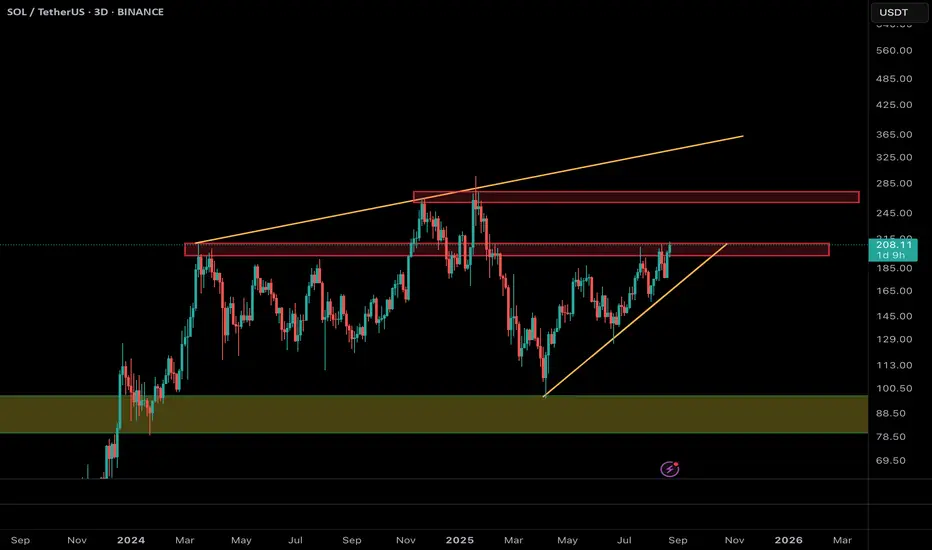
Solana at Make-or-Break: Can $213 Unlock the Rally to $270?Solana (SOL/USDT) has been recovering strongly since bouncing from the $110 area and is now testing the critical resistance zone around $205–213. This level has acted as a major barrier multiple times in the past, making it a true “make-or-break” point.
📌 Bullish Scenario (more likely if $213 holds):
• A confirmed breakout and daily/3D close above $213 could trigger a rally toward the next major resistance at $270.
• A successful move beyond $270 may even open the path toward the long-term resistance trendline near $320–340.
📌 Bearish / Alternative Scenario:
• If Solana fails to hold above $213, a pullback toward $180–175 is possible.
• Stronger support lies around $100, which remains the key level to defend for bulls.
⚡ Conclusion:
As long as SOL stays above $200, the structure remains bullish. A breakout above $213 would confirm momentum and unlock a potential move toward $270, while rejection could mean another corrective dip before the next attempt.
SUDARSHANCHEMSUDARSHANCHEM showing very good strength and consolidating since a month near ATH. Result is expected tomorrow on 25-Aug. If it declares bumper result then we may see next leg of steep rally. In recent time accumulation has been observed. Provided that if it closes above 1380 level then one may get very good risk-reward trade from hereon. Keep a stock in watch list. Just a small volume may push it above resistance line.

AVAX/USDT – Major Breakout on the Daily Timeframe!AVAX has finally broken out from its long-term descending trendline, signaling the potential start of a powerful bullish move. Let’s break down the setup:
🔎 Chart Analysis:
Pattern: Falling Wedge on the Daily timeframe.
Breakout Zone: Price has successfully closed above the resistance trendline around $25–26.
Support Zone: Strong accumulation support around $24–26
🎯 Trade Setup:
Entry Zone: $24–26 (current breakout retest levels)
Targets:
TP1: $35
TP2: $48
TP3: $60+
Stop Loss: $21 (below wedge & accumulation box)
📊 Risk/Reward:
R/R ratio: ~5:1
High conviction setup with breakout confirmation.
⚡ Key Takeaway:
If AVAX holds above the breakout zone, it could deliver a 2x–3x run in this cycle. Watch closely for volume confirmation on daily candles to strengthen the breakout signal.
🔥 Conclusion: AVAX looks primed for a strong bullish rally after months of consolidation. Accumulation zones are done — breakout traders could be rewarded big here!

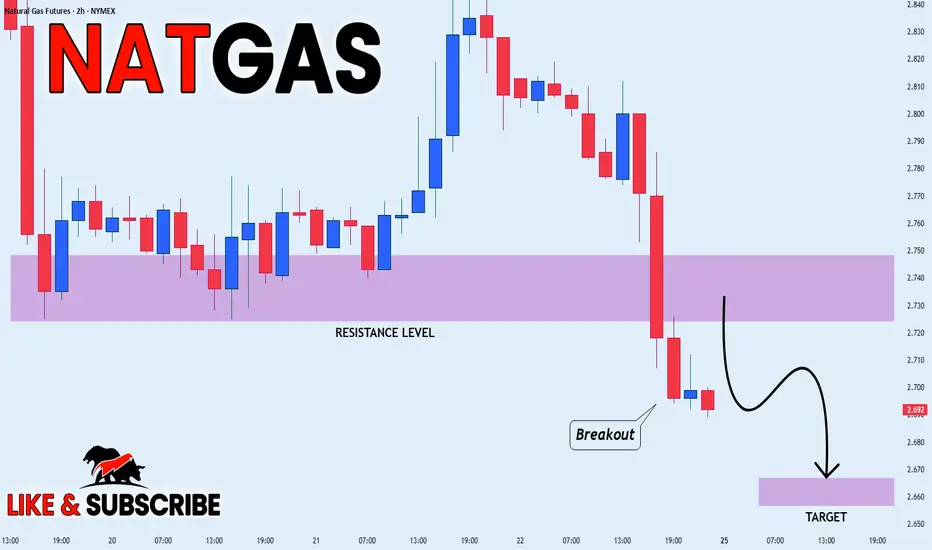
NATGAS WILL KEEP FALLING|SHORT|
✅NATGAS is going down currently
As the Gas broke the key structure level of 2.73$
Which is now a resistance, and after the pullback
And retest, I think the price will go further down
SHORT🔥
✅Like and subscribe to never miss a new idea!✅
AUD-NZD Will Keep Growing! Buy!
Hello,Traders!
AUD-NZD is trading in an
Uptrend and the pair
Made a bullish breakout
Of the key horizontal
Level of 1.1032 which
Is now a support then
Made a retest and is
Already making a strong
Bullish rebound so we are
Bullish biased and we will
Be expecting a further
Bullish move up
Buy!
Comment and subscribe to help us grow!
Check out other forecasts below too!
Disclosure: I am part of Trade Nation's Influencer program and receive a monthly fee for using their TradingView charts in my analysis.

EURUSD Breakout and Potential RetraceHey Traders, in the coming week we are monitoring EURUSD for a buying opportunity around 1.17000 zone, EURUSD was trading in a downtrend and successfully managed to break it out. Currently is in a correction phase in which it is approaching the retrace area at 1.17000 support and resistance area.
Trade safe, Joe.

Sol breakout/breakdownSOL is consolidating in a broad range between roughly $160 and $218.
The strategy is to buy on a decisive breakout above $218 with strong volume confirmation, aiming for continuation toward higher targets. Failure to break out could trigger a retest of lower support levels in the $160 region.

GH 3D: breakout forming inside ascending channelThe price of GH continues consolidating within the top of an ascending channel, confirming bullish structure. The rectangular accumulation has lasted for over three months, with price staying above all major EMAs and MAs - a strong trend confirmation. On the last impulse, volume increased, and now the price is compressing again. A breakout with a retest would serve as a valid entry. First target lies near 61.38, second at 73.66, and third at 87.37 - aligned with the upper range of the medium-term Fibonacci extension. Fundamentally, GH remains a promising biotech pick amid sector rotation and potential Fed easing. EMAs and MAs sit below price, and D/A supports the breakout scenario. Waiting for confirmation before entering.

Breakout Trade - Aadhar HousingBreakout Trade - Short Term
Aadhar Housing Broken resistance. Trading with SL 480 & Target of 600-620-650.
Disclaimer: This is only for Study. This is not Tip or advice for Trade.

Gold Breaks Consolidation, Enters Critical $3372-$3386 Supply Z.Chart: XAUUSD, 1H
Bias: Short-Term Bullish, but Cautious
Analysis:
Hello, traders. Let's break down the current price action on Gold (XAUUSD), which has just made a decisive move after a period of consolidation. (Note: The price levels in this analysis are based on the visual data displayed on the chart's Y-axis and Fibonacci tool, which may have a scaling discrepancy with the live ticker price.)
The Context: From Downtrend to Consolidation:
Previously, Gold was in a clear downtrend. After breaking its descending trendline around August 20th, the price action entered a consolidation phase. During this time, it has been building a support base, forming a key higher low marked "Strong" around the $3,320 level. The price ranged sideways, consistently facing resistance near the 0.382 Fibonacci level ($3,348.946).
The Bullish Breakout:
The period of indecision now appears to be over. We have just witnessed a strong, high-momentum bullish candle that has broken out from the top of this consolidation range. This move pushed the price decisively above the $3,360.491 (0.5 Fib) resistance, signaling that buyers have taken short-term control.
The Immediate Obstacle: The Confluence of Resistance
This bullish momentum has driven the price directly into a significant area of potential supply, identified by the indicator as the "Perfect Sell Zone 1". As per the indicator's label, this zone spans from the 0.618 to the 0.786 Fibonacci levels. This corresponds to a price range between $3,372.035 and $3,386.486, creating a powerful confluence of resistance that bulls must overcome.
Potential Scenarios & Key Levels:
Bullish Continuation (Primary Scenario): For the uptrend to continue, buyers must prove they can absorb the selling pressure in the current zone.
Confirmation: A decisive 1-hour or 4-hour candle close above the sell zone, specifically above the $3,386.486 (0.786 Fib) level, would be a strong confirmation of bullish strength.
Potential Entry: A more conservative long entry could be on a successful retest of the broken 0.5 Fibonacci level at $3,360.491, which should now act as support.
TP 1: The top of the supply zone at $3,386.486.
TP 2: The major swing high, and the ultimate target of this leg, at $3,409.420.
Rejection at Resistance (Alternative Scenario): This is a high-probability area for sellers to emerge and defend their territory.
If we see strong bearish price action within the $3,372 - $3,386 zone, it could signal a rejection. This might lead to a pullback towards the breakout point ($3,360.491). A break below the recent "Strong" low at $3,320 would invalidate the immediate bullish structure.
Conclusion:
Gold is at a pivotal moment. The breakout from consolidation is a clear bullish signal, but it is now facing its first major test. The price action within this precisely defined $3,372.035 - $3,386.486 supply zone will be the ultimate determining factor for Gold's next major directional move.
Disclaimer: This is not financial advice. This is for educational purposes only. Always do your own research (DYOR) before entering any trade.

ETH Shatters Downtrend with Explosive Breakout | Bulls Take FulChart: ETHUSDT, 1H
Bias: Bullish
Analysis:
Hello, traders! We are witnessing a dramatic and powerful shift in the ETHUSDT market structure that warrants immediate attention.
The Previous Bearish Context:
For several days, Ethereum has been trading within a well-defined bearish channel. This downtrend was characterized by:
A clear descending trendline that has been respected with multiple touches, acting as dynamic resistance.
A series of confirmed lower lows and lower highs, with multiple breaks of structure to the downside (indicated by the "Strong" lows being broken).
Overall seller dominance, pushing the price down from the $4,788 high to a low of around $4,042.
The Bullish Takeover (The Main Event):
The narrative has completely changed in the last few hours. A massive wave of buying pressure has resulted in an explosive move to the upside. The key developments are:
Decisive Trendline Break: A very strong, high-momentum bullish candle has completely shattered the long-standing descending trendline. This is the most significant bullish signal on this chart, indicating the previous downtrend is now invalidated.
Break of Market Structure: This upward thrust has also broken through several previous resistance levels, including the swing high around $4,400. This constitutes a major Change of Character (CHoCH) and confirms a shift in control from sellers to buyers.
Potential Scenarios & Key Levels:
Bullish Continuation (Primary Scenario): With such strong momentum, the path of least resistance is now to the upside. Traders might look for long opportunities.
Potential Entry: A textbook entry would be on a successful retest of the broken trendline or the recently broken resistance level around $4,400, which should now act as support.
TP 1: The previous major high at $4,788 (the '1' on the Fibonacci scale).
TP 2: The next major area of resistance, identified by the indicator as the "Perfect Sell Zone 1", starting around $4,880.
Invalidation Scenario: While the breakout looks powerful, traders must always manage risk. The bullish thesis would be invalidated if the price were to reverse, fall back below the broken trendline, and close decisively below the $4,300 support area. This would suggest the breakout was a bull trap.
Conclusion:
The evidence on the chart is overwhelmingly bullish in the short to medium term. The break of the multi-day trendline is a significant technical event that cannot be ignored. The immediate bias has shifted firmly in favor of the bulls. The key will be to watch for a potential pullback for entry opportunities and to see how the price reacts as it approaches the next major supply zone around $4,900.
Disclaimer: This is not financial advice. This is for educational purposes only. Always do your own research (DYOR) before entering any trade.

GBP_JPY WILL KEEP GROWING|LONG|
b]✅GBP_JPY is going up
Now and the pair made a bullish
Breakout of the key horizontal
Level of 198.900 and the breakout
Is confirmed so we are bullish
Biased and we will be expecting
A further bullish move up
LONG🚀
✅Like and subscribe to never miss a new idea!✅

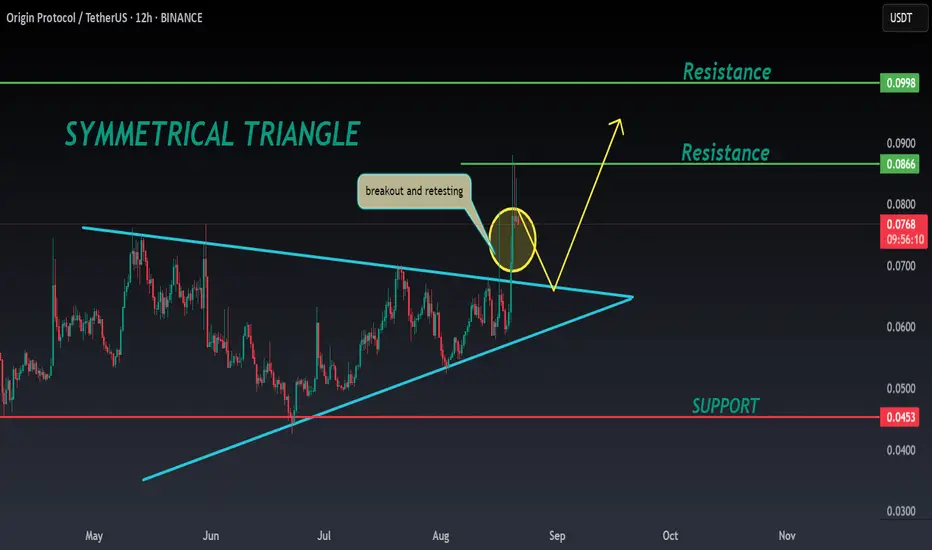
OGN ANALYSIS🔮#OGN Analysis 💰💰
#OGN is trading in a symmetrical triangle in a weekly time frame and breakouts with high volume and we could see a bullish momentum in #OGN. Before that we will see little bit bearish movement towards its support zone and that a bullish movement.
🔖 Current Price: $0.0768
⏳ Target Price: $0.0998
⁉️ What to do?
- We can trade according to the chart and make some profits in #OGN. Keep your eyes on the chart, observe trading volume and stay accustom to market moves.💲💲
🏷Remember, the crypto market is dynamic in nature and changes rapidly, so always use stop loss and take proper knowledge before investments.
#OGN #Cryptocurrency #Pump #DYOR
AUDUSD: Breaks Below ChannelThere's a very strong channel that formed on CMCMARKETS:AUDUSDU2025 originating since February 2025.
On the daily timeframe, price tested the lower channel boundary at the beginning of August. At that time, price respected this channel.
However, this wasn't the case more recently when price broke below this channel boundary and closed below it.
Moving over to the hourly timeframe, I'm monitoring the price action. I plotted an initial low that price traded post-breakout.
If price crosses below this initial low and makes a new lower low, that's an indication that momentum is picking up. If price reverts back, then it's a classic fakeout and then we'll hold off on this trade as price reverts back into the channel.

FR40: Resistance BreakoutOn the daily timeframe, price tested a resistance level twice. The first time was in mid-July, which resulted in a strong bearish reaction.
The second time price tested the resistance was last and current week. There was barely any reaction, which leads me to believe sellers do not see this as an overbought area.
On the hourly timeframe, price did pull back slightly after crossing above the daily level. However, this is not a clear false breakout since price crossed above the intraday high rather quickly.

JKCEMENTJKCEMENT given trendline breakout. It has posted v decent result above street's expectations. There is high probability that market may turn its trend which is in favor of new trend. Keep it on radar.

AUDCHF: Breaks Below Ascending TrendlineMy observations across the Daily (D1) and Hourly (H1) timeframes.
D1 timeframe:
My EMA20 is below the EMA 60. Price has ranged a bit longer than I anticipated, but we are now getting the indication that the downtrend is continuing.
Price is also below EMA20, which helps to signal momentum is picking up.
H1 Timeframe:
After price crossed below the daily ascending trendline, it stalled and then pulled back up. To some, this is a fakeout. To others, this is a liquidity trap.
I remained patient and found an opportunity to enter on the longer bearish bar, which shows price is pushing below prior lows after this breakout lower.

SILVER BEARISH BREAKOUT|SHORT|
✅SILVER broke the key
Structure level of 37.60$
And the breakout is confirmed
Which makes me bearish biased
And I think that after the retest of
The broken level is complete
A bearish continuation will follow
SHORT🔥
✅Like and subscribe to never miss a new idea!✅

BITCOIN GREAT BUYING OPPORTUNITY|LONG|
✅BITCOIN is making a bearish correction
And is down by almost 9% now
But a strong support level is ahead around 111-112k
Thus I am expecting a rebound
And a strong move up from
The support
LONG🚀
✅Like and subscribe to never miss a new idea!✅

GOLD Bearish Breakout! Sell!
Hello,Traders!
GOLD made a bearish
Breakout of the key
Horizontal level of 3,329$
Which is now a resistance
And the breakout is confirmed
So after the potential pullback
And retest we will be expecting
A further bearish move down
Sell!
Comment and subscribe to help us grow!
Check out other forecasts below too!
Disclosure: I am part of Trade Nation's Influencer program and receive a monthly fee for using their TradingView charts in my analysis.

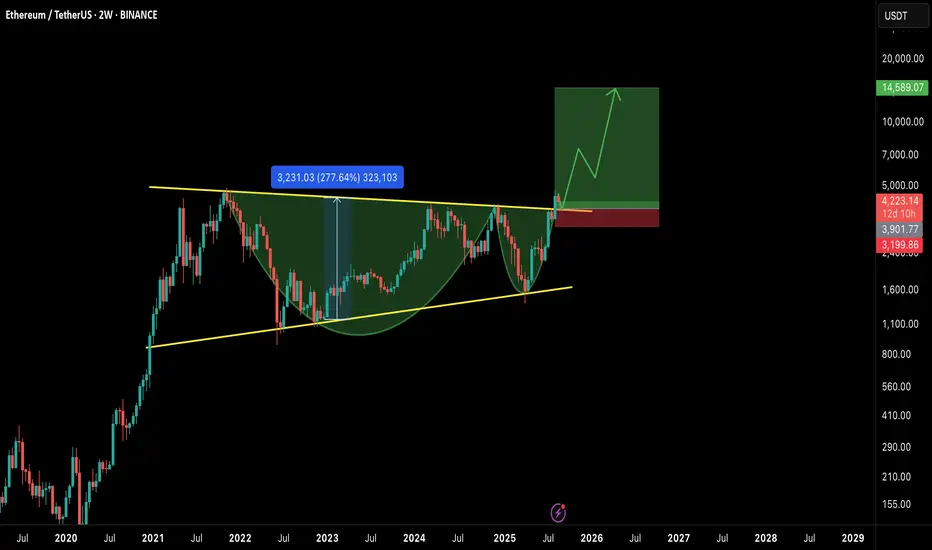
ETH/USDT – Mega Breakout on Higher Timeframe!Ethereum has confirmed a massive breakout on the 2W timeframe, breaking through a multi-year cup & handle and also ascending triangle formation. This is one of the strongest bullish continuation patterns and could fuel ETH into a new long-term rally. 🚀
📊 Chart Analysis
Pattern: Cup & Handle on the 2W chart.
Breakout Zone: Around $4,000–$4,300, now acting as support.
Measured Move Target: ~$14,500 (based on cup depth).
Stop Loss Zone: ~$3,200 (below major support).
✅ Bullish Factors
Multi-Year Accumulation: ETH has spent years consolidating below $4K, and this breakout confirms strength.
High R:R Setup: Risk is limited while the potential upside is ~3x from current levels.
Market Cycle Timing: BTC dominance topping out + potential altseason rotation favors ETH’s outperformance.
Strong Structure: Break above resistance aligns with long-term moving averages flipping bullish.
⚠️ Risk Factors
Macro events (FOMC, inflation data) could cause temporary retracements.
A weekly close back below $4K would invalidate the breakout.
BTC volatility may suppress ETH in the short term before altseason kicks in.
🎯 Targets
TP1: $6,500
TP2: $9,500
TP3: $14,500 (full measured move target)
📌 Conclusion
ETH is showing one of the strongest technical breakouts in years. If $4K+ holds as support, the path to new ATHs and beyond looks wide open. This setup could define the next phase of the bull market.
Bulls are in control — it’s ETH’s time to shine. 🌟
🔔 What’s your target for ETH in this cycle? $10K or higher? Let me know in the comments