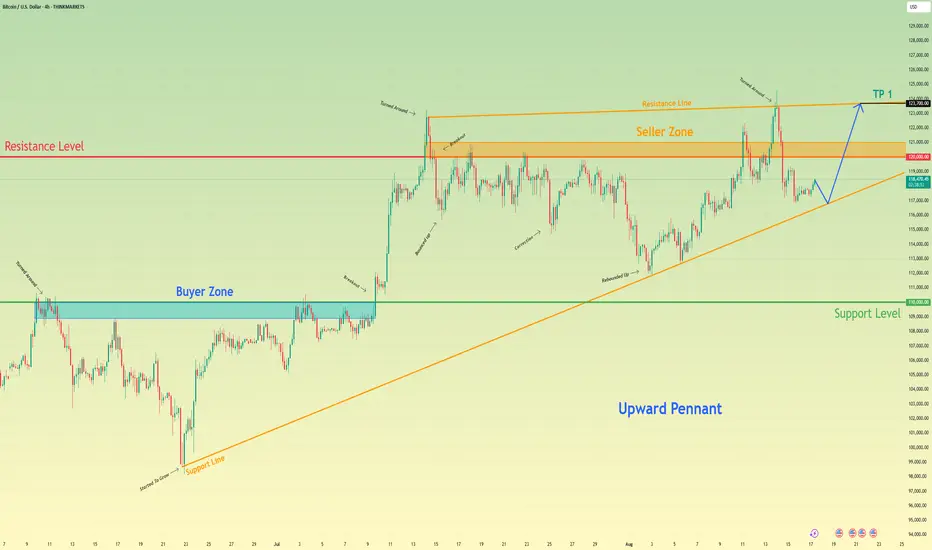
Bitcoin may bounce up of support line and break resistance levelHello traders, I want share with you my opinion about Bitcoin. Following a powerful upward trend and a significant breakout, bitcoin has established a new and higher territory for its price action, leading into the current phase of extensive consolidation. This consolidation has taken the form of a large upward pennant, a classic pattern of contracting volatility where the price is being squeezed between a descending resistance line and an ascending support line. The market has been rotating within these boundaries, with the seller zone around the 120000 resistance level capping rallies and the dynamic support line providing a floor for pullbacks. Currently, the asset is positioned at a critical juncture, testing the ascending support line of this multi-week formation after a corrective move down. The primary working hypothesis is a long scenario, based on the expectation of a successful upward rebound from this dynamic support. A confirmed bounce would validate the integrity of the pennant and suggest that another full rotation to the upside is the most probable path. This move would first challenge the horizontal resistance at 120000. Therefore, the ultimate TP for this rotational play is logically set at the 123700 level, as this precisely targets the upper resistance line of the pennant, representing the completion of the swing and a key decision point for a potential future breakout. Please share this idea with your friends and click Boost 🚀
Disclaimer: As part of ThinkMarkets’ Influencer Program, I am sponsored to share and publish their charts in my analysis.
Breakout!
10Y Futures Case Study: Trading the Breakout with Defined Risk1. Introduction
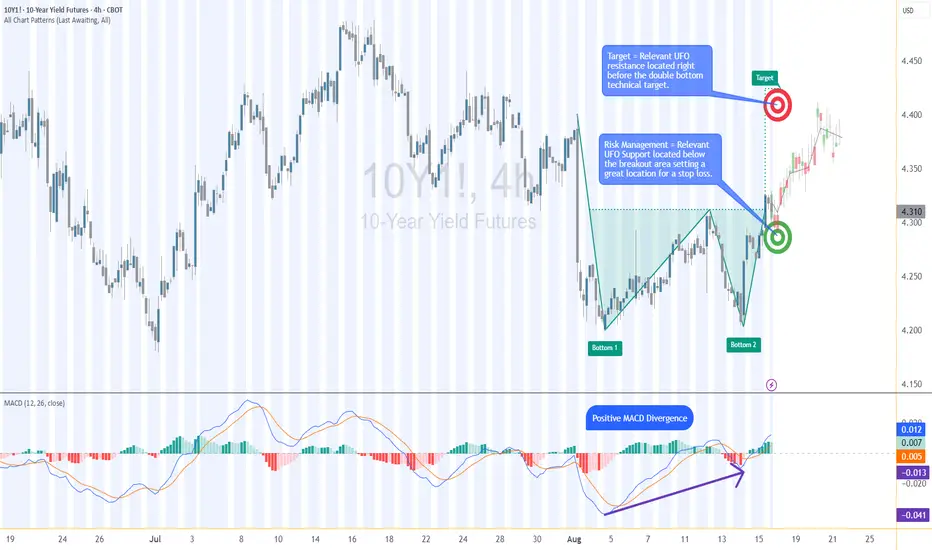
The 10-Year Yield Futures market has recently drawn attention as it builds a constructive base and attempts to shift momentum higher. After weeks of choppy movement, price action on the 4-hour chart has resolved into a breakout scenario that could define the next leg for yields. At the heart of this case study is a double bottom formation, a classical reversal structure, confirmed at 4.321. What makes this setup more compelling is the presence of nearby support and resistance zones, providing a precise technical framework to define entries, targets, and stop placement with discipline.
2. Double Bottom Pattern
The double bottom is one of the most reliable chart patterns signaling the potential exhaustion of selling pressure. It typically forms after a downtrend, with two consecutive troughs creating a strong support base before buyers regain control. In the current 10-Year Yield Futures chart, the first bottom occurred near 4.20, followed by a retest close to the same level. The neckline breakout emerged at 4.312, marking the confirmation point. Applying classical pattern analysis, the measured move points toward a target near 4.396. This alignment of structure and projection provides traders with a clear and objective technical roadmap.
3. MACD Confirmation
Momentum indicators often add depth to price action analysis, and the MACD (Moving Average Convergence Divergence) is one of the most widely followed. Built from the relationship of short- and long-term moving averages, it helps reveal underlying shifts in strength. In the current 10-Year Yield Futures chart, the MACD displayed a positive divergence: while price carved lower lows during the second bottom, the MACD lines began to slope higher. This divergence often signals weakening bearish momentum and the early stages of accumulation. In this case, it reinforces the validity of the double bottom breakout and its bullish potential.
4. UFO Support & Resistance
UnFilled Orders, or UFOs, represent areas where pending buy or sell orders may remain active, providing powerful zones of support or resistance. On the 10-Year Yield Futures chart, a key UFO support sits just below the breakout at 4.278, making it a logical stop-loss placement to protect the trade. Meanwhile, the upside target of the double bottom at 4.396 coincides with a UFO resistance zone. This overlap creates a clear exit area where supply may re-emerge. By combining classical charting techniques with order-flow–based zones, traders gain a structured plan that balances opportunity with risk control.
5. Trade Idea (Illustrative Case Study)
In this case study, the trade idea develops around the breakout point of 4.312 with the current price at the time of writing this article of 4.321. A trader could consider going long if the market sustains above this neckline level. The projected target is the resistance zone at 4.396, while the protective stop loss can be placed just below the UFO support at 4.278. This creates a defined risk profile with a reward-to-risk ratio of roughly 2:1. Alternatively, more conservative traders might consider a wider stop beneath the second bottom, offering more tolerance against volatility but at the expense of risk-reward efficiency. Both options maintain risk clarity and structure.
6. Contract Specifications & Margin Overview
The 10-Year Yield Futures (ticker: 10Y or 10Y1! on TradingView) is a cash-settled futures contract that tracks the 10-year U.S. Treasury yield directly. The gain or loss per tick per contract is as follows: 1 tick = 0.001 Index points (1/10th basis point per annum) = $1.00.
According to CME’s margin schedule (which changes as market conditions change through time), the current margin requirement is approximately $300 per contract. These relatively modest requirements make the product accessible while still providing meaningful exposure to U.S. interest rate markets.
7. Importance of Risk Management
Even with technically strong setups, the defining factor between consistent traders and inconsistent ones is risk management. Futures are leveraged products, meaning a small price move can translate into significant profit or loss. Using stop-loss orders helps enforce discipline, ensuring that one trade does not spiral into uncontrolled exposure. In this case, the support at 4.278 provides a logical technical area for a stop. Regardless of market outlook, avoiding undefined risk is key to long-term survival and consistency.
8. Closing Remarks
The alignment of a double bottom breakout, positive MACD divergence, and key support and resistance zones creates a textbook technical case study in the 10-Year Yield Futures market. With a clearly defined entry, target, and stop-loss, this setup demonstrates how combining price patterns with momentum and order-flow levels can help build structured trade plans. Yet, no analysis guarantees outcomes, and discipline remains at the core of every approach.
When charting futures, the data provided could be delayed. Traders working with the ticker symbols discussed in this idea may prefer to use CME Group real-time data plan on TradingView: www.tradingview.com - This consideration is particularly important for shorter-term traders, whereas it may be less critical for those focused on longer-term trading strategies.
General Disclaimer:
The trade ideas presented herein are solely for illustrative purposes forming a part of a case study intended to demonstrate key principles in risk management within the context of the specific market scenarios discussed. These ideas are not to be interpreted as investment recommendations or financial advice. They do not endorse or promote any specific trading strategies, financial products, or services. The information provided is based on data believed to be reliable; however, its accuracy or completeness cannot be guaranteed. Trading in financial markets involves risks, including the potential loss of principal. Each individual should conduct their own research and consult with professional financial advisors before making any investment decisions. The author or publisher of this content bears no responsibility for any actions taken based on the information provided or for any resultant financial or other losses.
GBP-CAD Will Go UP! Buy!
Hello,Traders!
GBP-CAD is trading in an
Uptrend and the pair made
A strong bullish breakout
Of the key horizontal level
Of 1.8696 so we are bullish
Biased and we will be
Expecting a further bullish
Move up on Monday
Buy!
Comment and subscribe to help us grow!
Check out other forecasts below too!
Disclosure: I am part of Trade Nation's Influencer program and receive a monthly fee for using their TradingView charts in my analysis.

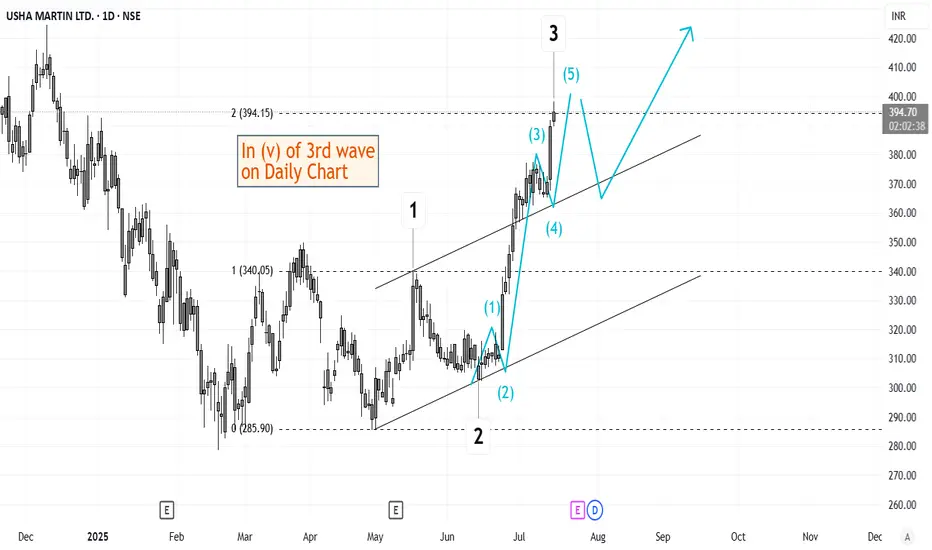
Elliott Wave Analysis of Usha Martin USHAMARTThe script is currently in (v) of 3rd wave on daily time frame. This should be followed by a short retracement and then a 5th wave up. Will keep updating this chart as it progresses.
Elliott Wave Analysis of Kirloskar Brothers KIRLOSBROSThe script is currently in 4th wave of hourly chart. The 4th wave seems to be ending, which means a 5th wave will start from here. The wave patters and patterns, retracements and analysis have been highlighted on the chart. Will update this as it progresses.

EUR-CAD Will Keep Growing! Buy!
Hello,Traders!
EUR-CAD is trading in an
Uptrend and the bullish
Breakout reinforces our
Bullish bias so after the
Potential pullback and retest
Of the new support of 1.6132
A further bullish continuation
Is to be expected
Buy!
Comment and subscribe to help us grow!
Check out other forecasts below too!
Disclosure: I am part of Trade Nation's Influencer program and receive a monthly fee for using their TradingView charts in my analysis.

ETH — Right-Angled Broadening BreakoutEthereum (ETH) has completed a Right-Angled Descending Broadening Pattern that developed over a period of 515 days. Such long-term structures are rare and often mark significant turning points in the market.
🔎 Pattern Breakdown
A–E → swings inside the broadening formation.
F → breakout above the flat resistance.
G (anticipated) → Retest of the breakout zone near $4000, where former resistance may establish itself as support.
The flat top resistance between $4000–$4100 has already given way. A successful retest and hold above this zone would confirm breakout validity and strengthen the probability of continuation toward ATH and beyond.
Trade Setup View
Retest entry zone (G): ~$4000
Invalidation (Stop-Loss): To be determined based on price action during the retest
TP1: Retest of ATH $4867
TP2: $5390
Final target (measured move): $6800
Risk-to-Reward: 1:7+ potential
Why $6800?
The measured move of a broadening formation is its full height projected upward from the breakout point:
Broadening low: $1383.26
Broadening high: $4109
➡️ Height = $2725.74
Add that to the breakout zone (~$4100) → $6825. Rounded, that gives a final target of $6800.
💡 Educational Takeaway
Right-Angled Descending Broadening Formations show growing volatility with buyers holding a ceiling steady while sellers run out of steam. Once that flat resistance breaks, momentum usually shifts in favour of the bulls. Since this one lasted over 500 days, the breakout isn’t just noise. It’s a macro signal that could define ETH’s next major trend leg.
Level to Watch Closely:
$4000 → the expected retest (G). Holding here would be a strong confirmation that ETH is ready to aim for ATH and price discovery.
_________________________________
💬 If you found this helpful, drop a like and comment!

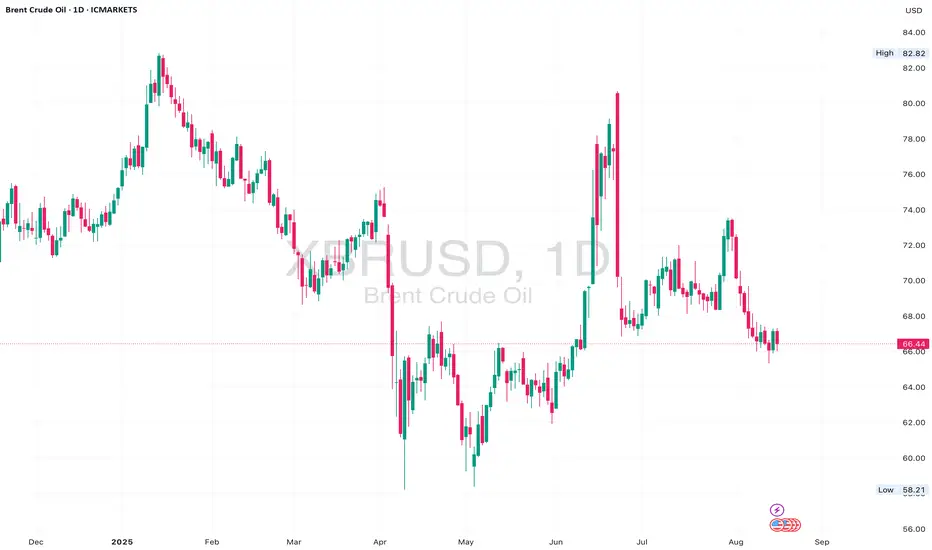
Brent Crude Squeeze – Daily Symmetrical Triangle Nears BreakoutBrent Crude has been consolidating within a symmetrical triangle on the daily chart since mid-May, following a strong bullish recovery from $58 lows. Price is now approaching the apex of the structure, suggesting a breakout is imminent.
We’re still holding above the higher low trendline support, but resistance at $71.00 remains unbroken. A decisive daily candle close outside this triangle will likely set the tone for the next leg.
A bullish breakout above $71.15 could expose $75.00 and eventually $82.00 highs. But if bears take control and break below $67.00 support, $64.00 and $58.00 reopen.
📈 Bias:
Neutral short term — Waiting for breakout confirmation.
Bullish if price breaks and retests above $71.15.
Bearish if we lose $67.00 and structure fails.
GBPCAD - Bulls in Control, But Supply Zone Ahead🏹 GBPCAD has been climbing within a steep bullish channel , approaching a key supply zone around 1.8750. As long as the channel holds, buyers remain in control.
However, if price rejects this supply area and breaks below the 1.8670 support, the bears could take over, potentially triggering a deeper correction.
📌Price is now at a decisive point — a breakout above supply could open the door for fresh highs, while a rejection and channel break could mark the start of a bearish phase.
⚖️ Bulls need a clean break above supply for further upside, while bears are eyeing a channel break for a reversal.
📚 Always follow your trading plan regarding entry, risk management, and trade management.
Good luck!
All Strategies Are Good; If Managed Properly!
~Richard Nasr
Disclosure: I am part of Trade Nation's Influencer program and receive a monthly fee for using their TradingView charts in my analysis.

CRUDE OIL Short From Resistance! Sell!
Hello,Traders!
CRUDE OIL is making a
Pullback and will soon hit
A horizontal resistance
Of 64.50$ and as we are
Bearish biased and we will
Be expecting a local
Bearish pullback
Sell!
Comment and subscribe to help us grow!
Check out other forecasts below too!
Disclosure: I am part of Trade Nation's Influencer program and receive a monthly fee for using their TradingView charts in my analysis.

AUD-CHF Bearish Breakout! Sell!
Hello,Traders!
AUD-CHF made a bearish
Breakout of the key horizontal
Level of 0.5257 which is now
A resistance and the breakout
Is confirmed so we are bearish
Biased and we will be expecting
A further bearish move down
Sell!
Comment and subscribe to help us grow!
Check out other forecasts below too!
Disclosure: I am part of Trade Nation's Influencer program and receive a monthly fee for using their TradingView charts in my analysis.

TFCILTDTFCILTD seems too strong and trading above all resistance zone. Strong volume has also been observed. Support can be seen near 275 levels. Seems too promising. Keep it on radar

GBP/NZD Breakout & Retest, Potential Bullish RallyThe GBP/NZD chart on the 4-hour timeframe shows a symmetrical triangle pattern that has formed since late April 2025, with a descending upper trendline and an ascending lower trendline. During this period, price has continued to move within an increasingly narrow range, creating price compression that is characteristic of a symmetrical triangle pattern. The pattern’s upper resistance line has been tested multiple times (red arrows), while the lower support line has consistently maintained higher lows (green arrows).
Recently, price successfully broke above the pattern’s upper resistance line with a clear breakout, followed by a retest phase that held above the pattern line. This scenario indicates a role reversal, where the former resistance now acts as new support. A long green Heikin Ashi candle after the retest provides an additional signal that buying momentum is currently dominant.
Trade Plan:
Entry is taken after confirmation of breakout & retest, with the take profit (TP) set at 2.3200 as a key resistance area and the nearest historical high target. The stop loss (SL) is placed at 2.2600, just below the retest area, to anticipate the possibility of a false breakout.
Trading Plan Details:
Direction: Long (Buy)
Timeframe: 4H
Reason: Symmetrical Triangle Breakout + Retest
Entry: After retest & bullish candle confirmation
TP: 2.3200
SL: 2.2600
Additional Confirmations:
Green Heikin Ashi candle without a lower shadow as a sign of strong momentum
Increased buying pressure following a consolidation period
Disclaimer: This analysis is part of a trading plan and does not constitute investment advice. Always use strict risk management and consider potential losses in every trading decision.

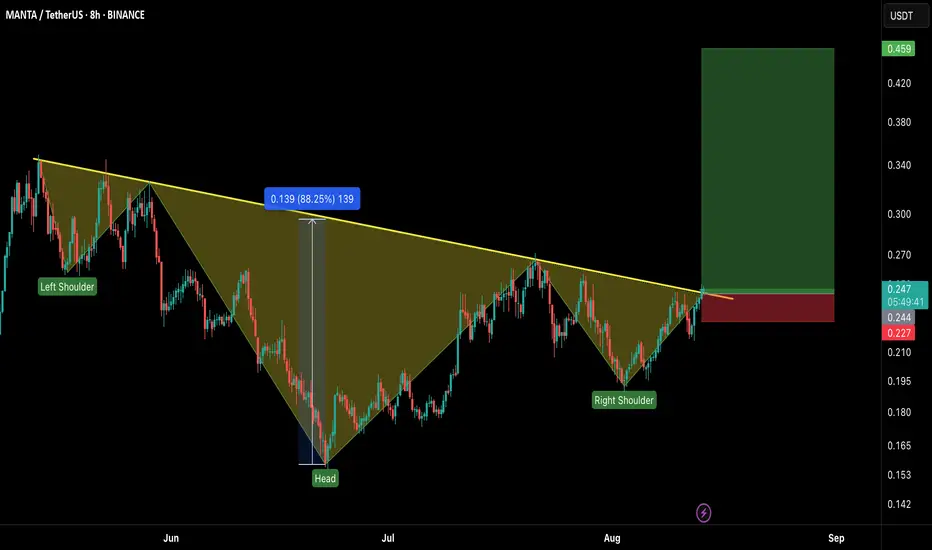
MANTA/USDT – Long Setup Alert!MANTA has just broken out of a massive Inverse Head & Shoulders pattern on the 8H chart — a bullish reversal signal that could ignite a strong upside rally. 📈
Setup Details:
Entry: CMP – 0.248
Stop Loss: 0.227 (below neckline retest)
Targets:
🎯 TP1: 0.34
🎯 TP2: 0.42
🎯 TP3: 0.459
Leverage: 5x max (adjust risk accordingly)
Why This Setup?
✅ Clean breakout above neckline after weeks of consolidation
✅ Volume supporting the breakout
✅ Pattern target aligns with strong resistance zone above
⚠️ Risk Management: Stick to your SL. A failed retest can trap late entries.
Bulls are in control — let’s ride this momentum!
Apple Is Climbing the Fibonacci Channel Ladder – Step 5 Ahead?On the monthly chart, Apple (AAPL) is steadily moving within a well-defined ascending Fibonacci channel, like climbing a ladder — step by step.
The price is currently testing Step 4 , a zone that has acted as a strong resistance barrier.
Despite the pressure here, the structure still appears bullish, and even a minor pullback might simply be a pause before the next move.
If momentum picks up, we could soon see a breakout toward the next step — targeting 234 at Step 5.
The trend remains technically intact unless the channel is broken, and the overall formation still leans toward continuation.

NATGAS Swing Short! Sell!
Hello,Traders!
NATGAS made a bearish
Breakout of the key horizontal
Level of 2.895$ while trading
In a downtrend so we are
Bearish biased and we will
Be expecting a further
Bearish continuation
Sell!
Comment and subscribe to help us grow!
Check out other forecasts below too!
Disclosure: I am part of Trade Nation's Influencer program and receive a monthly fee for using their TradingView charts in my analysis.

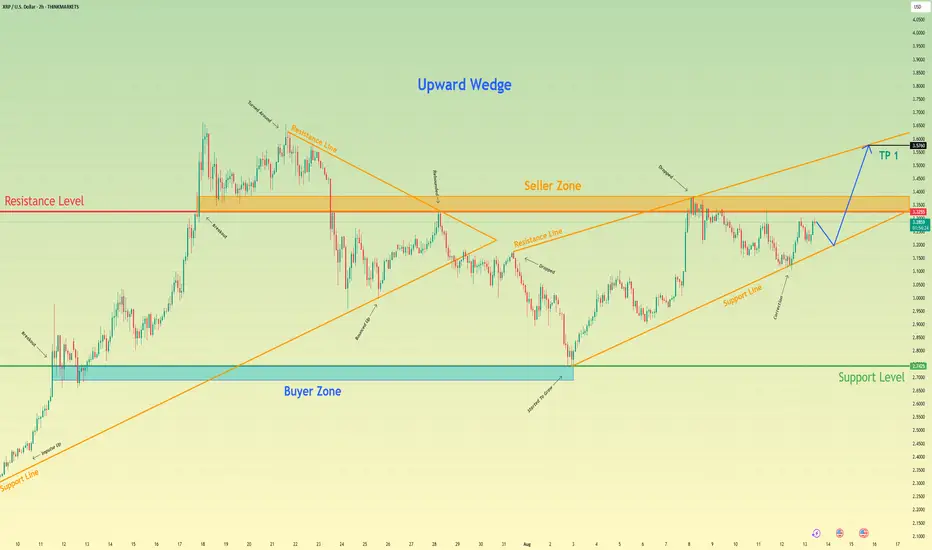
Ripple will continue to grow in wedge and break resistance levelHello traders, I want share with you my opinion about Ripple. The price action for Ripple has been methodically developing within the confines of a large upward wedge. This pattern has defined its strong upward trend since the last major rebound from the buyer zone around 2.7425. This structure has guided the asset higher through a series of corrections and upward rebounds, showcasing a sustained campaign by buyers. Currently, the price is at a critical juncture, consolidating directly below the significant horizontal resistance level at 3.3255. This level, which is also a major seller zone, has previously capped rallies and represents the most immediate obstacle to a continuation of the uptrend. The primary working hypothesis is a long scenario, based on the expectation of a decisive breakout above this resistance. Such a breakout would signify that buyers have absorbed the available supply and are ready to push the market to a new high. The scenario anticipates that following the initial break, the price will perform a corrective retest of the 3.3255 level, treating the former resistance as new support. A confirmed bounce from this retest would validate the breakout and provide the impetus for the next impulsive wave higher. Therefore, the TP for this continuation move is logically placed at the 3.5760 level, which aligns perfectly with the upper resistance line of the entire upward wedge formation. Please share this idea with your friends and click Boost 🚀
Disclaimer: As part of ThinkMarkets’ Influencer Program, I am sponsored to share and publish their charts in my analysis.
AUDUSD Breakout Setup: Ready for Lift-Off!Hey Guys,
I’ve analyzed the AUDUSD pair for you. If the 0.65245 level breaks to the upside, my target will be 0.65416.
If it doesn’t break, I’ll be looking to buy around 0.65047 or 0.64954.
Either way, my final target remains 0.65416.
In this analysis, I’ve highlighted two key levels and shared my target. I’m planning to buy from these zones.
Every single like from you is my biggest source of motivation to keep sharing these analyses. Huge thanks to everyone who supports by liking!

US100 Bullish Breakout! Buy!
Hello,Traders!
US100 is trading in a
Strong uptrend and the
Index made a strong bullish
Breakout of the key horizontal
Level of 23,720 which is now
A support and the breakout
Is confirmed so we are
Bullish biased and we will
Be expecting a further
Bullish continuation
Buy!
Comment and subscribe to help us grow!
Check out other forecasts below too!
Disclosure: I am part of Trade Nation's Influencer program and receive a monthly fee for using their TradingView charts in my analysis.

NATGAS BEARISH BREAKOUT|SHORT|
✅NATGAS is going down currently
As the price broke the key structure level of 2.90$
Which is now a resistance, and after the pullback
And retest, I think the price will go further down
SHORT🔥
✅Like and subscribe to never miss a new idea!✅

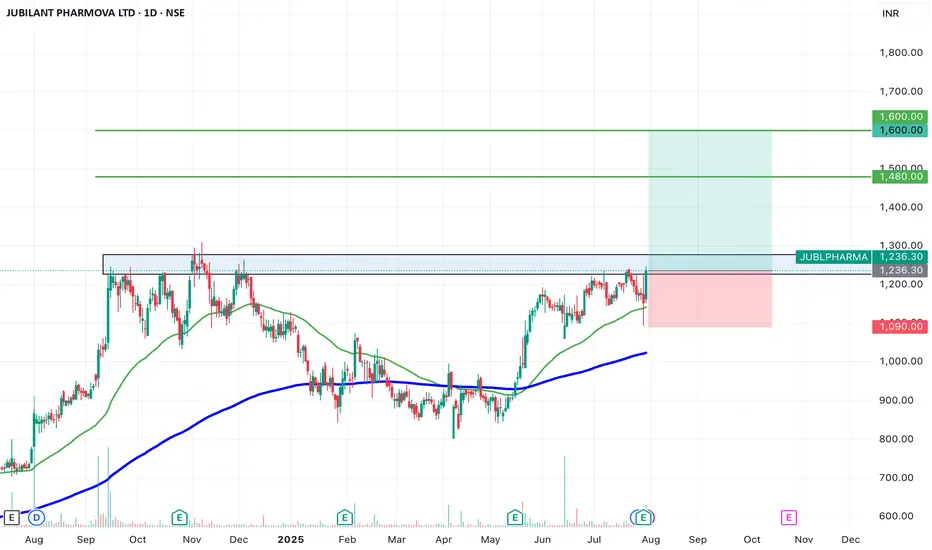
SWING IDEA - JUBILANT PHARMOVAJubilant Pharmova , a diversified pharmaceutical company focused on CRAMS and specialty pharma, is presenting a strong swing opportunity backed by a major pattern breakout and volume confirmation.
Reasons are listed below :
Breakout from an Inverted Head & Shoulders pattern after over a year of consolidation
Attempting breakout above 1250, a key resistance zone with multiple rejections in the past
Strong marubozu candle on the daily chart with a notable volume spike, signaling conviction
Trading near all-time highs, and comfortably above key EMAs, reinforcing trend strength
Target : 1480 // 1600
Stoploss : weekly close below 1090
DISCLAIMER -
Decisions to buy, sell, hold or trade in securities, commodities and other investments involve risk and are best made based on the advice of qualified financial professionals. Any trading in securities or other investments involves a risk of substantial losses. The practice of "Day Trading" involves particularly high risks and can cause you to lose substantial sums of money. Before undertaking any trading program, you should consult a qualified financial professional. Please consider carefully whether such trading is suitable for you in light of your financial condition and ability to bear financial risks. Under no circumstances shall we be liable for any loss or damage you or anyone else incurs as a result of any trading or investment activity that you or anyone else engages in based on any information or material you receive through TradingView or our services.
@visionary.growth.insights
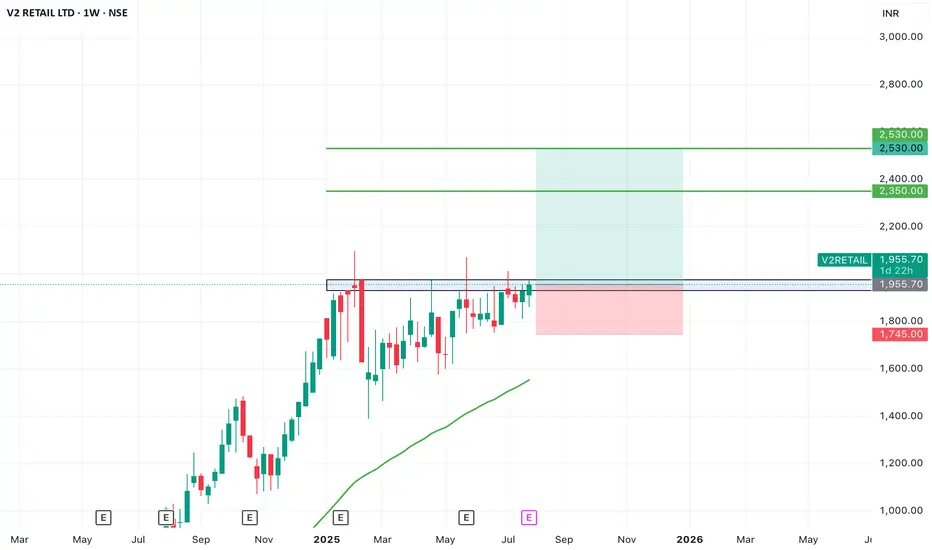
SWING IDEA - V2 RETAILV2 Retail , a small-cap value fashion retailer with a pan-India presence, is showing strong bullish momentum and a textbook swing trade setup backed by multiple breakout signals.
Reasons are listed below :
Breakout from a VCP (Volatility Contraction Pattern) – indicating accumulation and strength
Ascending triangle breakout – classic continuation pattern
Cleared major resistance zone, confirming bullish intent
Maintains a clear uptrend with higher highs and higher lows
Target - 2350 // 2530
Stoploss - weekly close below 1745
DISCLAIMER -
Decisions to buy, sell, hold or trade in securities, commodities and other investments involve risk and are best made based on the advice of qualified financial professionals. Any trading in securities or other investments involves a risk of substantial losses. The practice of "Day Trading" involves particularly high risks and can cause you to lose substantial sums of money. Before undertaking any trading program, you should consult a qualified financial professional. Please consider carefully whether such trading is suitable for you in light of your financial condition and ability to bear financial risks. Under no circumstances shall we be liable for any loss or damage you or anyone else incurs as a result of any trading or investment activity that you or anyone else engages in based on any information or material you receive through TradingView or our services.
@visionary.growth.insights
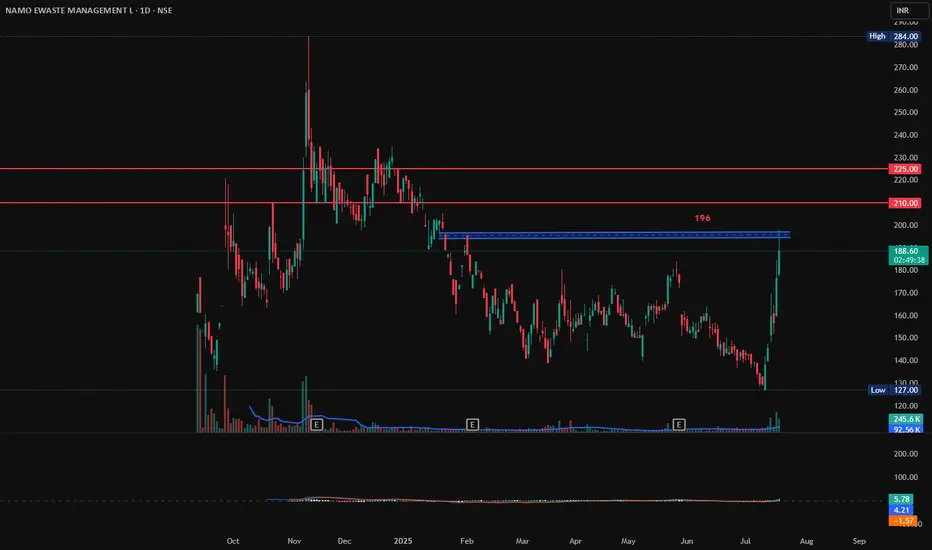
NAMO EWASTE MANAGEMENT, Long, Breakout, 1DNAMO EWASTE MANAGEMENT has gain 6% today with good volumes. If it breaks and sustains 196 with Bullish candlestick patterns like Bullish Engulfing, Hammer & Inverted Hammer, Piercing Line, Morning Star, Three White Soldiers, Tweezer Bottoms or Bullish Harami, then there are good chances for it to go further up from here. First target will be 210 and second target 225.
Entry: 196 (on Bullish candlestick pattern)
Target1: 210
Target2: 225.
SL: 185