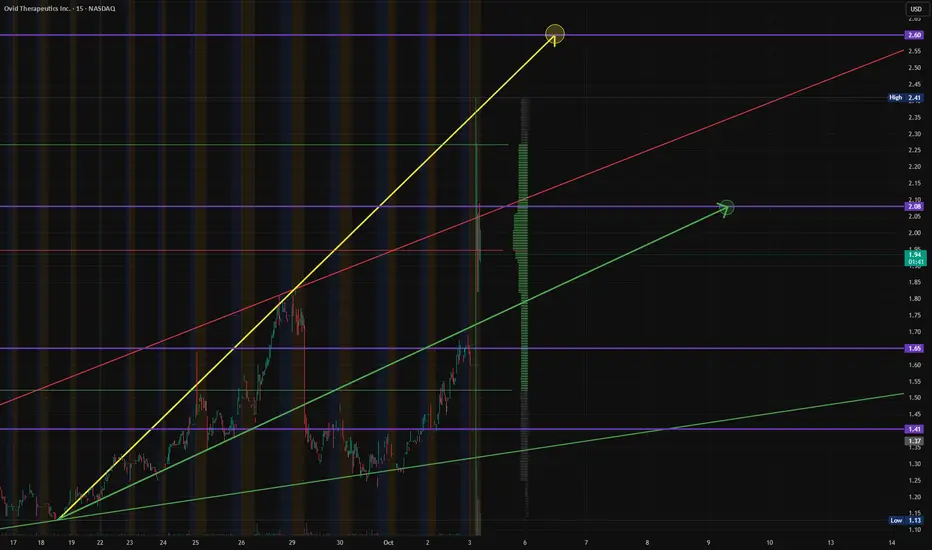
$OVID - OVID Therapeutics - $2.08 Retest & Breakout - $2.60PTNASDAQ:OVID broke out in the Pre-Market, hitting $2.41, breaking through the $2.08 Levels of Resistance. We were looking for support above that $2.08 but see consolidation to that Lower Suport Trend, which we expect a continuation through the $2.08 to our $2.60 PT and Retest Expectations.
This comes after OVID reported Positive Topline Data on it's OV329 for Drug Resistant Epliepsies.
Breakout
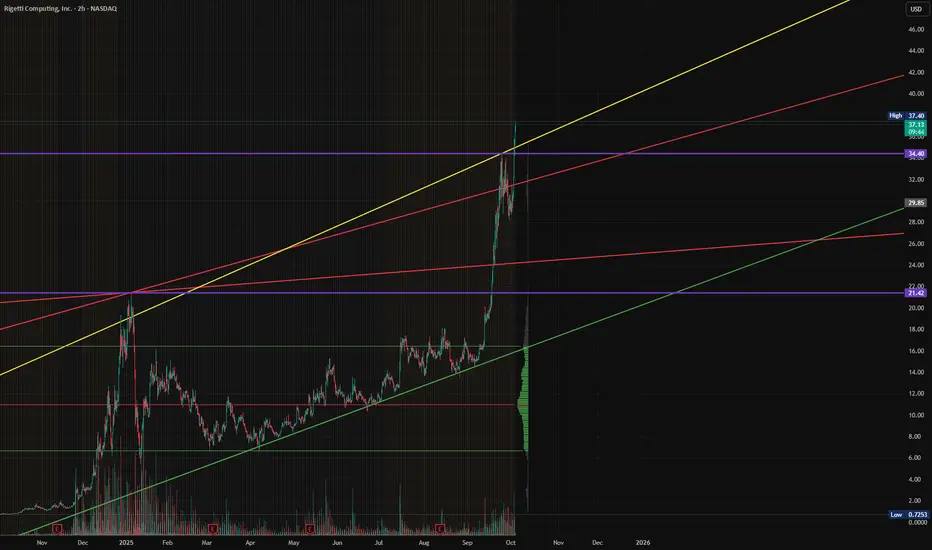
$RGTI - Rigetti Computing - $43 PT?NASDAQ:RGTI has been on a run, pushing from $0.72 to $21.42 going into 2025, consolidating and pushing into this continuation over the course of the remaining, breaking above that $21.42 Level of Resistance, now identifying resistance $34.40, where we will be looking for new strong support above those levels before pushing on to the $43 PT.
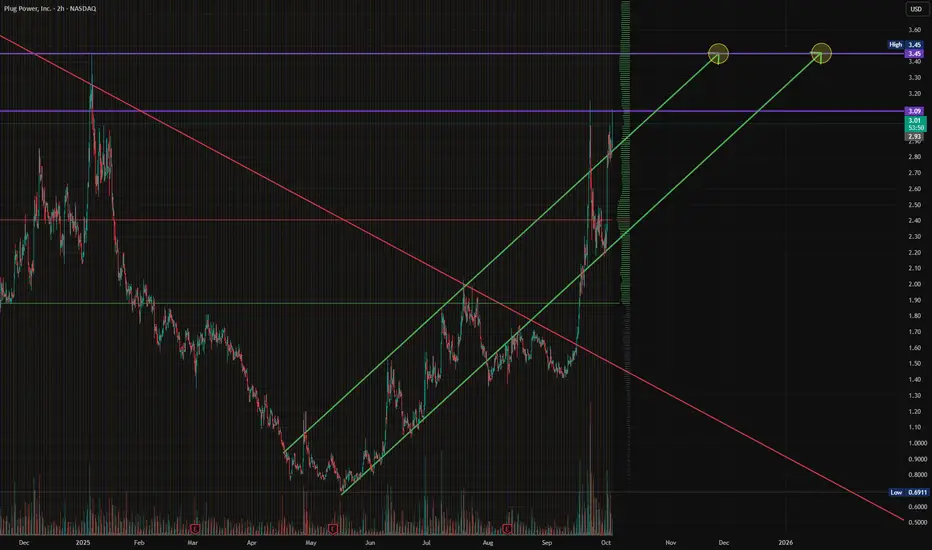
$PLUG - Plug Power, Inc - $3.45 RT & Breakout?NASDAQ:PLUG looks to have broken out of its longer-term downward channels, showing strong volume, support, and momentum while re-attempting to break the $3.09s and push forward to our $3.49 PT.
This also comes after HC Wainwright maintains a BUY on NASDAQ:PLUG , raising its Price Target to $7. Not to include, the company just delivered its first 10-MegaWatt GenEco Electrolyzer Array to Gilp, a Portuguese Energy Company.
S&P 500: Rising Wedge signals movement before NFP📈 BLUEBERRY:SP500 | Rising Wedge + Non-Farm Payrolls: Which breakout scenario is more likely?
A Rising Wedge pattern is forming on the 30-minute chart of US SPX 500, with price approaching the convergence point of two trendlines. This pattern typically signals weakening bullish momentum but doesn’t rule out a breakout to the upside 🚀.
🔍 Technical Analysis:
• Price is consolidating within a narrowing channel, forming a Rising Wedge 🔺.
• Key support lies between 6717 - 6734 (lower blue zone) 🛡️.
• Target zone on a breakout to the upside is 6767 - 6775 (upper blue zone) 🎯.
• The pattern signals an imminent breakout, but confirmation with a candle close beyond the wedge is needed 🕒.
📊 Non-Farm Payrolls Impact:
• If NFP comes in below expectations, the market may react positively (break up) on hopes of Fed easing monetary policy 💵👍.
• Conversely, a higher-than-expected NFP could increase downside pressure (break down from the wedge) 📉⚠️.
💡 Trade Setup:
• Enter a BUY position once price breaks above 6733 with confirming high volume 🔥.
• Place stop loss below support at 6716 to manage risk 🚧.
• Target area between 6770 - 6775 🎯.
📝 Summary:
The Rising Wedge on SPX 500 points to a breakout soon, with the NFP report acting as a key catalyst. Wait for confirmation and manage your risk carefully ✅.
Please like and comment below to support our traders. Your reactions will motivate us to do more analysis in the future 🙏✨
Harry Andrew @ ZuperView

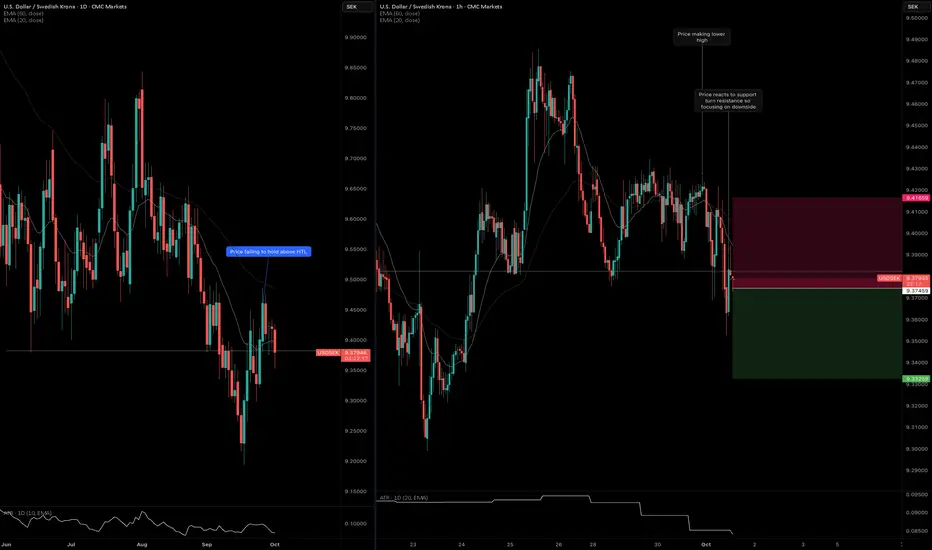
NZDUSD: Sell Stop in Planned DowntrendThis is not an active entry but a planned sell stop entry.
Daily Timeframe:
Price crossed above HTL but quickly formed a doji to indicate weakness
EMA20 is below EMA60 and price is below EMA20 so there's an overall weak downtrend
H1 Timeframe:
Strong ATL is in the process of weakening as price recently failed to make a higher high
When price crossed below ATL, EMA20 should show confluence by crossing below EMA60 and the EMA band should continue expanding
If price makes a clean break lower, there's strong indication that there will be confluence with the daily downtrend

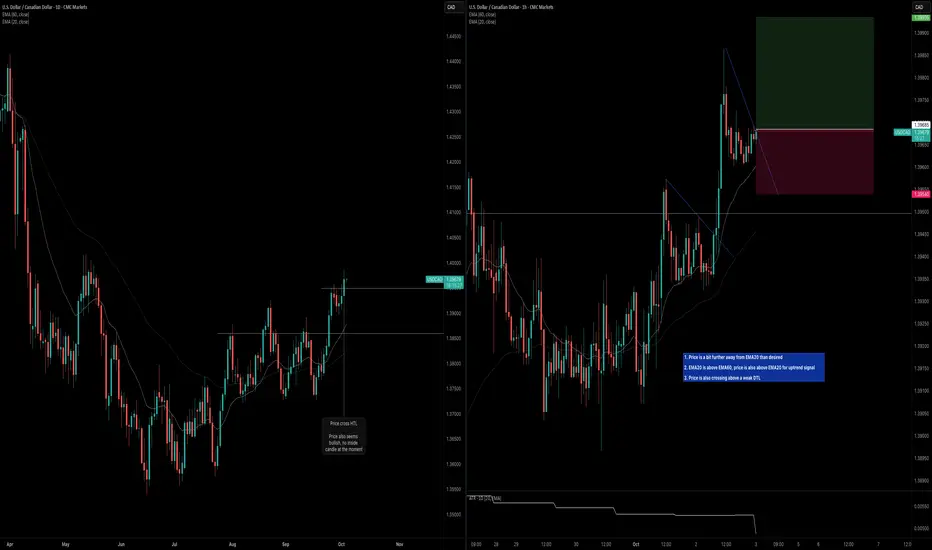
USDCAD: Uptrend ContinuationDaily Timeframe:
Price crosses above HTL and is holding
No inside bar formed yet so unlikely to see loss of momentum over the next day
H1 Timeframe:
Not idea that price is a bit further away from EMA20
Uptrend is indicated by EMA20 being above EMA60 and price being above EMA20
The DTL is also not a strong plot so reducing size
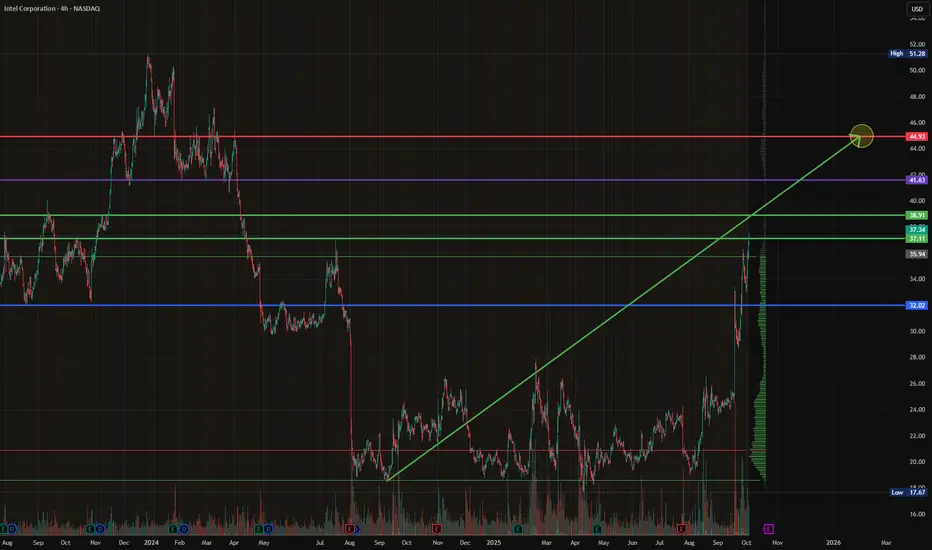
$INTC - Intel Corporation - $44.93 RetestNASDAQ:INTC is marching to it's next breakpoint at $38.91, with the potential to find next level resistance around the $41.63's, which we're looking for Momentum to drive it through, to retest $44.93.
GBPAUD: Second AttemptExperienced a bit of unwanted volatility earlier this morning, but I do think there's still quite a bit of downside pressure.
On the daily timeframe, price still remains below HTL. On the H1 timeframe, price appears to be ranging, but is painting larger bearish bars.
I think there is an opportunity to scale in if price crosses below EMA20 and the EMA20/60 band continues to expand.

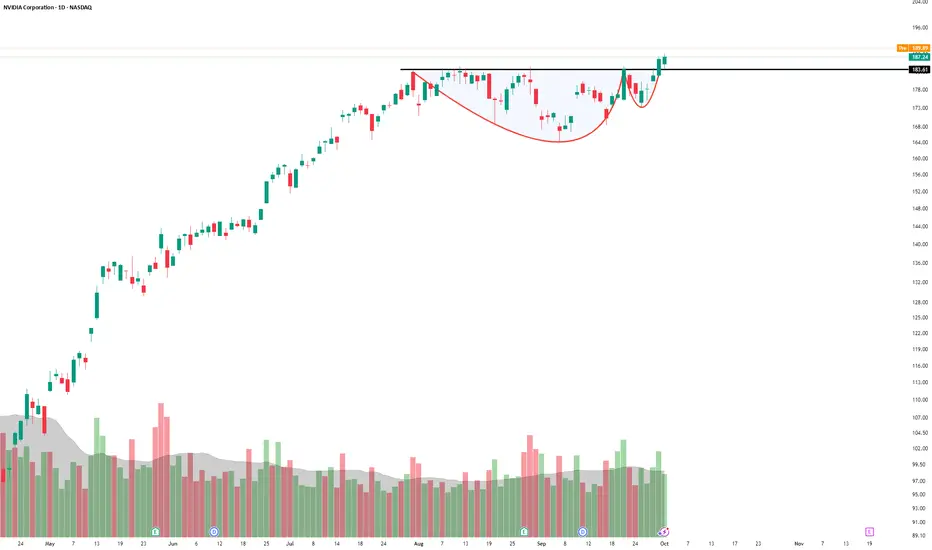
NVDA Breaking Out ... Yet Again!NASDAQ:NVDA is just unstoppable. It broke out again from this base which can also qualify as a cup and handle (C&H) continuation. Going by the size of pattern, it could very well he hitting 200 soon, though exact size comes at around 205.
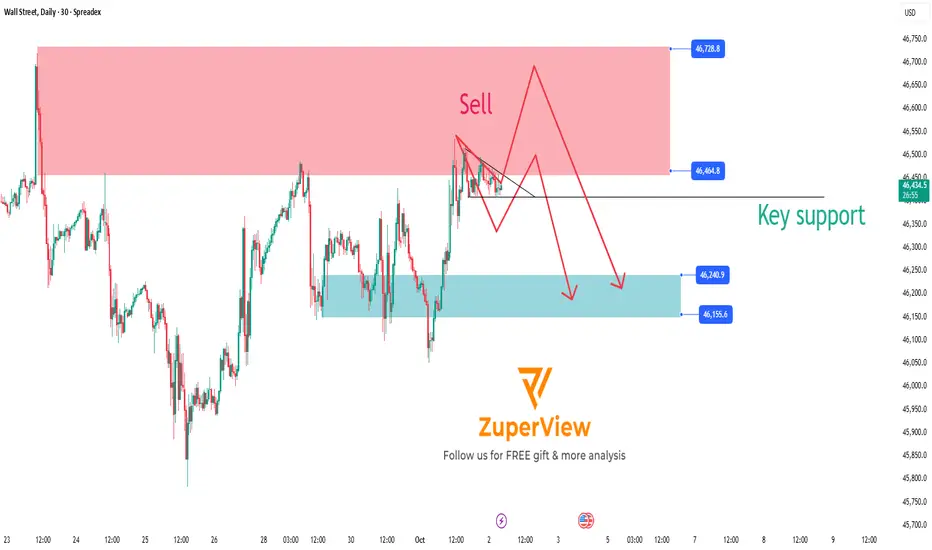
US30: Key support breakdown signals potential sell opportunity
1. Current Market Overview 🌐
The SPREADEX:DJI index is approaching a significant resistance zone where selling pressure is expected to be strong. The price is currently consolidating and moving sideways around this area, preparing for a major move.
2. Technical Signals and Momentum Indicators 📊
Momentum indicators such as MFI, RSI, and Stochastic have all entered the oversold territory, while also showing signs of price compression (consolidation), indicating the market is waiting for the next breakout.
The strong resistance zone and the Overbought/Overextended (OB/OS) signals suggest that buying pressure is weakening, which is favorable for sellers.
3. Sell Scenario on Key Support Breakdown 🔻
If the price breaks below the important Key Support level shown on the chart, this will confirm the beginning of a downtrend.
Traders can consider opening sell positions as soon as the breakout occurs to take advantage of the downward momentum.
The price target is expected to move toward lower support zones where buying interest may emerge to cause a price correction.
4. Risk Management ⚠️
Place stop-loss orders above the resistance zone or the nearest recent highs to protect against unexpected market moves.
Adjust your position size according to your risk tolerance.
5. Conclusion 🔑
The sell setup on US30 is very clear with a strong resistance zone and momentum signals indicating a potential upcoming downtrend.
Main scenario: Breaking the Key Support will trigger a strong decline, providing a profitable trading opportunity for sellers.
Wait for a confirmed support break before entering the trade to ensure safety and effectiveness.
Please like and comment below to support our traders. Your reactions will motivate us to do more analysis in the future 🙏✨
Harry Andrew @ ZuperView
XAUUSD Forecast: Expecting Further Price SurgeHey everyone, Kilian here!
Gold is showing solid bullish momentum right now, with relentless buying pressure pushing prices higher. Recently, the metal broke through its final resistance level, then pulled back to retest it, a textbook example of a breakout followed by a classic retracement.
This retest was crucial, as the price was rejected at that level, turning it into a new support zone. This shift is a strong long-term buy signal, confirming that the bulls are firmly in control and positioning for further gains, with the next major target around 3,922.
On the fundamental side, XAUUSD's outlook remains positive. The U.S. government shutdown is fueling economic uncertainty, which is driving increased demand for safe-haven assets like gold. Additionally, strategic acquisitions are adding further strength to gold's upward momentum. That said, it’s important to remain cautious, as sudden shifts in market sentiment could quickly change the direction.
Stay tuned and watch how gold plays out in the coming days. The trend is looking strong, but always be prepared for potential changes!

GBPAUD: Price Holding Below Daily HTLDaily Timeframe:
Price initially crossed below daily HTL on September 11th, but failed to hold below it as price reversed for the following days
Price crossed below daily HTL again on September 30th, but closes below significantly
Price attempted to trade above HTL, but failed to close above it accordingly
H1 Timeframe:
There's confluence here as price crosses below ATL
Price is also below EMA20 and the EMA band is beginning to widen

Oil Playing Twister: Triple Bottom or Quadruple Pretzel?A Triple Bottom Walks Into a Bar…
Crude Oil (CL) has been busy doing something traders love and hate at the same time: building bottoms. First, it carved a neat Triple Bottom on the daily chart — textbook stuff. Everyone lined up at 66.68 waiting for the breakout champagne to pop.
But what did price do? Instead of exploding higher, it slammed on the brakes and took a detour straight back to support. Typical CL — always keeping traders on their toes.
Now we’re staring at the possibility of a Quadruple Bottom. Not a typo. Yes, they exist, but you don’t see them every day. Like spotting a unicorn in Times Square.
Why We Care About 66.68
That level isn’t just random. It’s the line where:
The Triple Bottom neckline lives.
The Supertrend upper band hangs out.
And, conveniently, the breakeven of our options spread sits.
In other words: get above 66.68 and suddenly this setup has wings. Target? Around 70.63, where UFO resistance is waiting to greet us.
The Fun Part: Bull Call Spread
Instead of swinging a giant futures bat and risking unlimited pain, we play it smarter with a Bull Call Spread:
Buy the 65 Call (Nov-17)
Sell the 71 Call (Nov-17)
Pay about 1.75 points (≈ $1,750 per standard spread, ≈ $175 if you go micro).
That’s it. Risk capped, reward mapped. Max loss? $1,750. Max gain? $4,250.
And yes, the breakeven is… drumroll… 66.8. Same line as the chart breakout. Love when math and pictures line up.
Plot Twist: Cheaper Now, But…
Here’s the kicker: because price dipped back into support, the spread might actually be cheaper right now. Sounds good, right?
But there’s a catch. Waiting for the breakout confirmation could make the spread pricier later, shrinking your reward-to-risk. Classic trading dilemma: do you want cheaper tickets with less confirmation, or more expensive tickets after the bouncer checks your ID?
Risk in 3 Sentences
Keep your trade size sane.
Don’t marry the setup if price dumps below the bottoms.
If CL rushes toward 70, take the money and run (or at least roll the short strike higher).
Bottom Line
Crude Oil is still building its base. Maybe it’s a Triple Bottom. Maybe it becomes the rare Quadruple Bottom collectors dream about. Either way, the play is the same: breakout above 66.68, aim for 70.63, and do it with a defined-risk Bull Call Spread that doesn’t keep you up at night.
Sometimes the market is dramatic. That’s why we trade it. 🎭
Want More Depth?
If you’d like to go deeper into the building blocks of trading, check out our From Mystery to Mastery trilogy, three cornerstone articles that complement this one:
🔗 From Mystery to Mastery: Trading Essentials
🔗 From Mystery to Mastery: Futures Explained
🔗 From Mystery to Mastery: Options Explained
When charting futures, the data provided could be delayed. Traders working with the ticker symbols discussed in this idea may prefer to use CME Group real-time data plan on TradingView: www.tradingview.com - This consideration is particularly important for shorter-term traders, whereas it may be less critical for those focused on longer-term trading strategies.
General Disclaimer:
The trade ideas presented herein are solely for illustrative purposes forming a part of a case study intended to demonstrate key principles in risk management within the context of the specific market scenarios discussed. These ideas are not to be interpreted as investment recommendations or financial advice. They do not endorse or promote any specific trading strategies, financial products, or services. The information provided is based on data believed to be reliable; however, its accuracy or completeness cannot be guaranteed. Trading in financial markets involves risks, including the potential loss of principal. Each individual should conduct their own research and consult with professional financial advisors before making any investment decisions. The author or publisher of this content bears no responsibility for any actions taken based on the information provided or for any resultant financial or other losses.

XAUUSD: A Golden Opportunity to Buy TodayHello everyone, Kilian here!
Gold is looking very attractive. After a strong surge, the price has come back to test and confirm the strong buying pressure, and this has been confirmed beautifully.
The price is currently at an important level where the sellers pushed the price down. If the buyers manage to break through this level and repeat the same pattern (coming back to test and confirm), this indicates strong buying pressure, meaning the price is likely to continue rising.
Wish you happy trading and profitable results!

SPY MONEY PRINTER GO BRRR|LONG|
✅SPY with the FED lowering rates, liquidity injections perspective fuel risk assets. Price has broken out above the key level, signaling bullish order flow. SMC outlook suggests momentum could push into new all-time highs as money printer effects unfold. Time Frame 1H.
LONG🚀
✅Like and subscribe to never miss a new idea!✅

USDSEK: Price Crosses Below HTL AgainUSDSEK traded below the daily HTL, but there's weakness after price crossed back above.
On the other hand, the H1 timeframe is showing weakness. Price is failing to make higher high so I'm betting on downside momentum to pick up.
Reduced position size since we are nearing New York rollover.
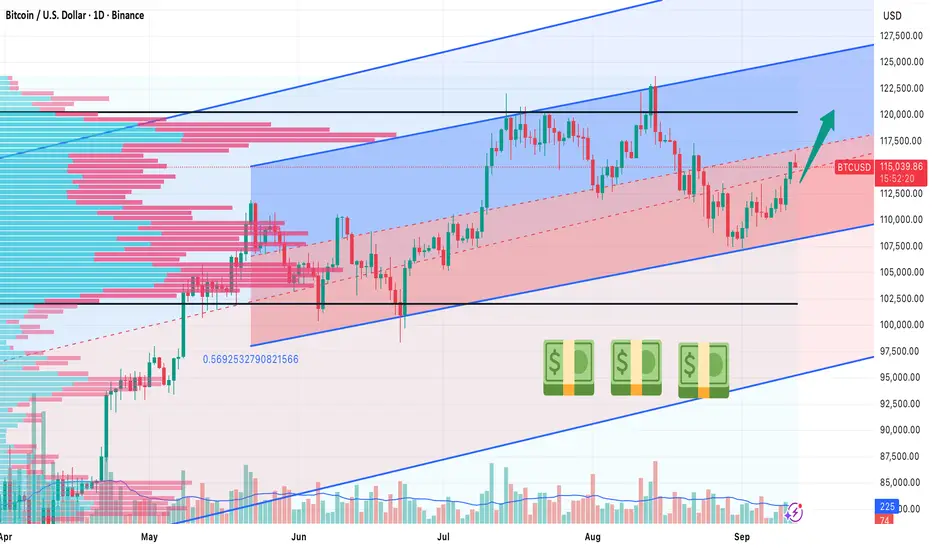
BTC/USD Near the Median of Weekly and Daily Regression TrendsHow to Approach the Setup
Long‑term bias: bullish (weekly regression channel slopes upward, daily channel is flat‑to‑slightly bullish).
Typical trader mindset: wait for an upward breakout with strong volume or place a buy‑limit order around the round‑number level of 115,000 USD and aim for an initial target near 120,000 USD (+4%).
Price action and technical context
BTC is currently trading close to the median line of two overlapping regression‑trend channels:
Weekly Timeframe: Channel slope Upward - Interpretation : Long‑term bullish pressure
Daily Timeframe: Channel slope Flat‑to‑slightly up - Interpretation : Short‑term equilibrium, slight upside bias.
The price sits in a narrow corridor bounded by the upper and lower regression lines. Because the weekly channel is tilted upward, the overall market structure still favors higher highs. The daily channel’s flatness suggests that any move will need a catalyst—typically a surge in buying volume or a breakout above the weekly upper trend line.
Key technical reference points
Upper daily regression line: ~125,000 USD – the first resistance level that, if breached with volume, could trigger a sustained rally.
Median (current price area): ~117,000 USD – a psychologically clean round number that also aligns with the median of both channels.
Lower daily regression line: ~108,000 USD – a safety net; a break below would invalidate the bullish bias.
Trade‑the‑setup options
1. Wait for a breakout – Enter the trade when the price closes above the weekly upper regression line and the accompanying volume is at least 1.5 times the 20‑day average. This condition confirms that the bullish bias is actually materialising and helps avoid false “whipsaw” moves. In practice, traders use a market order or place an aggressive limit order just above the breakout level (around 118,600 USD).
2. Buy‑limit at 115,000 – Set a limit order at the round‑number median of 115,000 USD. The round number acts as a natural “magnet,” and because the price is already near the median, this approach works well in a range‑bound market. The typical execution is a limit order at 115,000 USD with an initial profit target of 120,000 USD, representing roughly a +4 % gain.
Both methods assume the trader will monitor volume and short‑term momentum (RSI, MACD) to confirm that the move is not a temporary spike.
Momentum and volume cues
RSI(14): Values climbing above 55 support the bullish bias; a dip below 45 warns of potential reversal.
MACD: A bullish crossover (MACD line crossing above the signal line) on the daily chart adds confidence to a breakout or limit‑order fill.
Volume: A surge to at least 150 % of the 20‑day average on the day of the breakout dramatically raises the probability of a sustained move.
Risk considerations
Stop placement: If the price falls below the lower weekly regression line (≈111,000 USD) or breaches the median downward with a sharp volume spike, exit the position.
Position sizing: Because BTC’s volatility can be extreme, allocate a modest percentage of the portfolio (e.g., 2‑3 % of equity) to this speculative play.
Alternative defined‑risk structures: Traders uncomfortable with outright exposure can use a debit call spread (e.g., buy the 115,000 USD call, sell the 120,000 USD call) to cap downside while preserving upside to the first target.
Bottom line
When BTC/USD hovers near the median of a bullish weekly regression channel and a flat‑to‑slightly bullish daily channel, the market is in a neutral‑to‑bullish equilibrium. The prudent approach is either:
Patience: Wait for a volume‑driven breakout above the weekly upper trend line, or
Precision: Place a buy‑limit order at the clean 115,000 USD level and target the first upside milestone at 120,000 USD (+4%).
Both strategies rely on confirming momentum and volume before committing capital, while keeping a tight stop below the lower weekly regression line to protect against a sudden reversal.
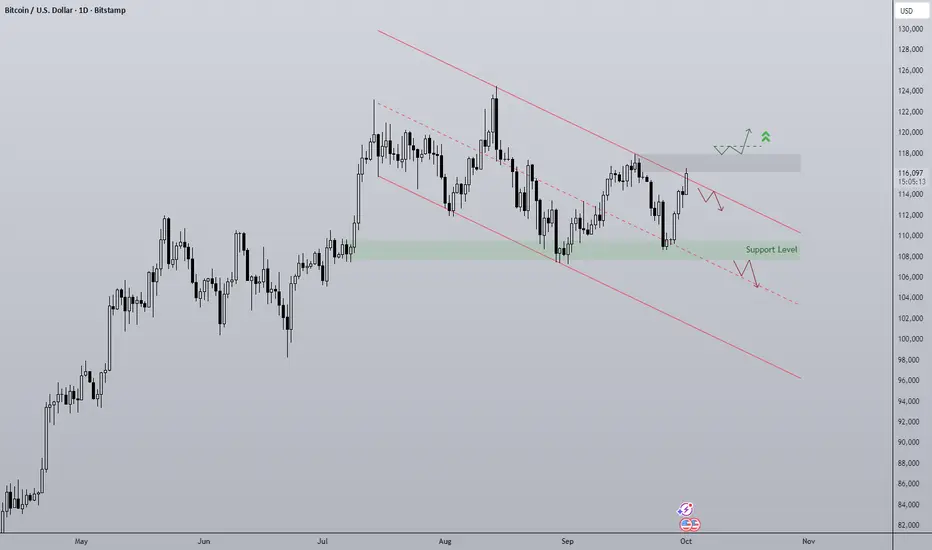
Bitcoin in Q4 As "Uptober" begins the layout for Bitcoin is as follows:
- Downtrend on the daily officially since 18th September but really it began after the SFP of ATH on August 14th.
- The origin of the rally to ATH has served as support twice since at $108,000
- Diagonal trendline resistance being tested as Q4 begins, seasonality shows October is very strong for returns, 21.89% average since 2019.
- Compression of the range inevitably leads to a breakout in either direction.
Bullish scenario is reclaim of $117,500 to push towards ATH.
Bearish scenario is a loss of $108,000
USDCAD: Uptrend ContinuationThis trade is not near a major daily level, but I think it does have potential.
Daily Timeframe
Price made a very clean break above the HTL
Bearish move only lasted two days, which is an indication of weak momentum
H1 Timeframe
Price crosses above EMA20 and continues accelerating away
EMA20 is accelerating away from EMA60
Price also crossed DTL, but caution that this was not a clean break

$DPRO - Dragonfly, Inc - $8.60 Retest - $9.25 PTNASDAQ:DPRO broke out this morning, retesting the $8.60s before consolidating throughout the premarket. Based on current projections, we're targeting a $9.25 Price Target on the trade, look for a re-entry on that lower-level support trend.
This comes after NASDAQ:DPRO announced landing a US Army Deal for Flex FPV Drone Systems. With the increase used of drone's in today's moderinzed warfare, DPRO looks set to win for the time being.

SILVER Free Signal! Sell!
Hello,Traders!
SILVER Triple-top rejection at premium levels confirms distribution phase. SMC shows liquidity sweep above highs before sharp drop through neckline, shifting order flow bearish.
-------------------
Stop Loss: 4,721$
Take Profit: 4,537$
Entry: 4,632$
Time Frame: 3H
-------------------
Sell!
Comment and subscribe to help us grow!
Check out other forecasts below too!
Disclosure: I am part of Trade Nation's Influencer program and receive a monthly fee for using their TradingView charts in my analysis.

EUR-NZD Bearish Breakout! Sell!
Hello,Traders!
EURNZD price has broken down from a rising wedge structure, signaling Smart Money shift from accumulation to distribution. SMC suggests bearish momentum towards the 2.0180 target zone. Time Frame 2H.
Sell!
Comment and subscribe to help us grow!
Check out other forecasts below too!
Disclosure: I am part of Trade Nation's Influencer program and receive a monthly fee for using their TradingView charts in my analysis.

GBPAUD: Late EntryDaily Timeframe
Price is crossing HTL
Overall structure is ranging so it's possible that this will pull back quick
H1 Timeframe
Price crossed ATL
Entry is a bit late so stop loss need to be set wider to accommodate intraday pullback move
