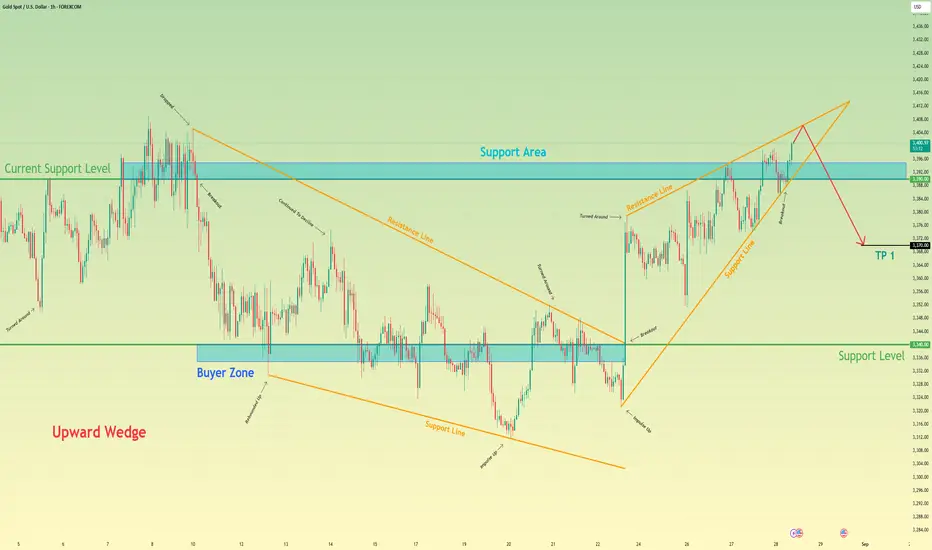
Gold will start to decline and then exit from wedgeHello traders, I want share with you my opinion about Gold. The market dynamic for XAUUSD has seen a significant evolution, transitioning from a corrective falling wedge into a new bullish phase after a powerful breakout from the lows. This upward trend has since matured and taken the shape of a large upward wedge, a pattern that has been guiding the price higher through a series of rebounds and corrections. This formation, while bullish in the short term, often signals potential trend exhaustion as it approaches its apex. Currently, the price action for XAU is at a critical juncture, pushing up against the upper resistance line of this wedge. The primary working hypothesis is a short scenario, which is predicated on the common bearish resolution of a rising wedge pattern. It is anticipated that the asset will be rejected from this resistance line, signalling that buying momentum is waning. A confirmed failure at this peak would likely trigger a sharp reversal, with enough selling pressure to cause a breakdown below the wedge's ascending support line and the current support level of 3390. This structural failure would validate the bearish thesis and initiate a new downward leg. Therefore, the TP is logically set at 3370 points, representing a prudent first objective for the price to achieve following the anticipated breakdown of the wedge structure. Please share this idea with your friends and click Boost 🚀
Breakout
SILVER BULLISH BREAKOUT|LONG|
✅SILVER is going up currently
And the price broke the key structure level of 39.52$
Which is now a support, and after the pullback
And the retest, I think the price will go up
LONG🚀
✅Like and subscribe to never miss a new idea!✅

AUD_USD WILL GO UP|LONG|
✅AUD_USD is going up
Now and the pair made a bullish
Breakout of the key horizontal
Level of 0.6525 and the breakout
Is confirmed so we are bullish
Biased and we will be expecting
A further bullish move up
LONG🚀
✅Like and subscribe to never miss a new idea!✅

NZD-USD Will Keep Growing! Buy!
Hello,Traders!
NZD-USD is going up
And the pair made a bullish
Breakout of the key horizontal
Level around 0.5880 and the
Breakout is confirmed so
We are bullish biased
And we will be expecting
A further bullish move up
On Monday!
Buy!
Comment and subscribe to help us grow!
Check out other forecasts below too!
Disclosure: I am part of Trade Nation's Influencer program and receive a monthly fee for using their TradingView charts in my analysis.

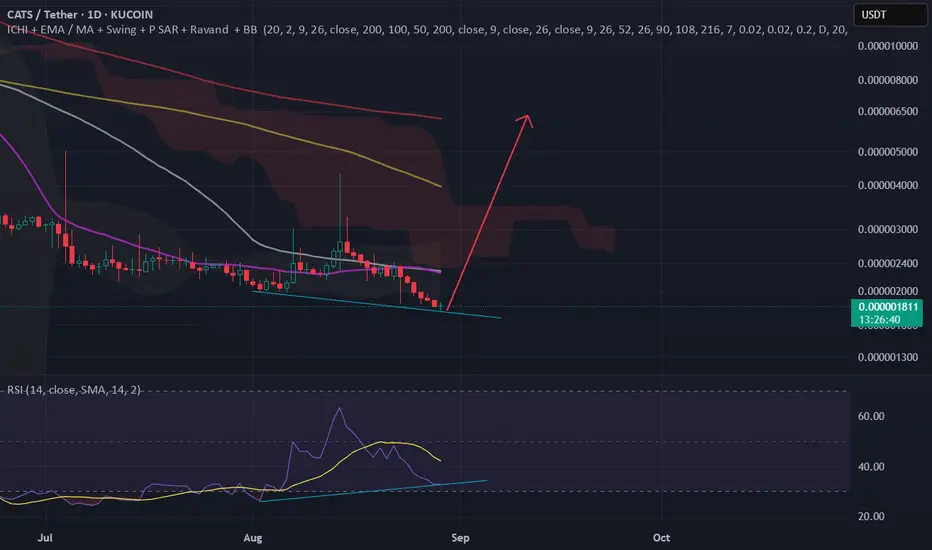
CATSUSDTat technically RSI in daily Chart has Positive Divergence , Break out Excepted , Buy before Explode About to 4x For First
XAUUSD: Price Rebound from Support line to $3440Hello everyone, here is my breakdown of the current Gold setup.
Market Analysis
From a broader perspective, we've seen a clear shift in control on the chart. The market successfully reversed a prior downtrend by breaking out of a Downward Channel. This breakout was significant and has established the current bullish market structure, which has been guiding the price higher.
This new bullish phase has formed a well-defined Upward Wedge. The price has been respecting its boundaries, making higher highs and higher lows. Currently, the price is undergoing a corrective pullback and is testing the ascending support line of this wedge, which aligns with the Support zone around the 3390 level.
My Scenario & Strategy
My scenario is built on the expectation that this upward wedge structure will remain intact. The current pullback to the support line presents a classic opportunity within an established uptrend.
I'm anticipating a clear bounce from the current support zone. This should initiate a rally back towards the wedge's resistance line. The key part of this scenario is that I expect the buying pressure to be strong enough to force a breakout above that resistance, signaling an acceleration of the trend. The primary target for this breakout scenario is 3440 points.
That's the setup I'm tracking. Thank you for your attention, and always manage your risk.

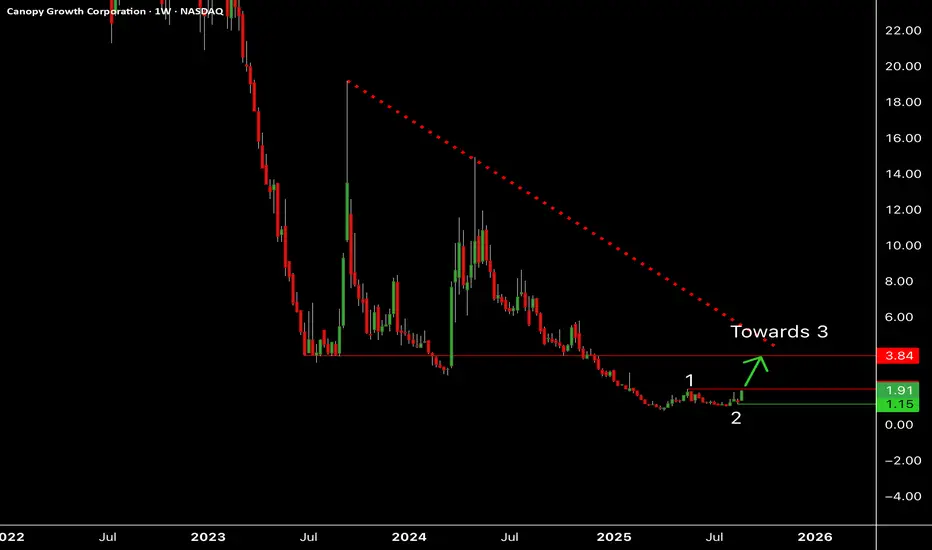
Canaopy Growth looking to break outCannabis stocks are finally starting to wake up after rumours that Trump will finally legalize weed in the country.
A break above $1.99 should open $3.84 where the line linking the tops and the former lows should act as important resistances.
A break below $1.15 should invalidate this view.
GBP-CAD Bearish Breakout! Sell!
Hello,Traders!
GBP-CAD made a bearish
Breakout of the key horizontal
Level of 1.8640 and the
Breakout is confirmed so
We are bearish biased and
We will be expecting a
Further bearish move down
Sell!
Comment and subscribe to help us grow!
Check out other forecasts below too!
Disclosure: I am part of Trade Nation's Influencer program and receive a monthly fee for using their TradingView charts in my analysis.

EUR_CAD BEARISH BREAKOUT|SHORT|
✅EUR_CAD broke the
Key structure level of 1.6070
While trading in an local downtrend
Which makes me bearish
And as the retest of the level is complete
Bearish continuation will follow
SHORT🔥
✅Like and subscribe to never miss a new idea!✅

K-Pop: Demon Hunters to Drive Netflix Higher?The recent success of global hits like K-Pop: Demon Hunters and strong fundamentals give the stock a tailwind, and technically, the corrective and consolidative phase appears to be maturing.
Netflix is consolidating between $1198 and $1243, after rebounding from the $1,144 support level, which has proven to be a strong floor following the sharp correction from the $1341 high.
Price is currently trading under the 50% Fibonacci retracement of the last down leg. The structure suggests that the market is in a decision phase.
The RSI on the 4H timeframe is stabilizing in mid-range territory.
If the price continues to hold above $1198, this keeps the bias bullish.
A breakout above $1243 would likely trigger a move and possible retest of the prior high near $1341.
In my view, the most probable scenario is a move higher as long as the support holds.
My projection is for a period of consolidation, followed by a breakout toward $1340 in the coming weeks, provided $1198 is not broken.

GBPNZD: Trend ContinuationAugust has been a slow month, which I'm hoping volatility with pick up in September. While most pairs have been ranging, GBPNZD has a relatively cleaner trend.
Daily Timeframe:
Over on the daily timeframe, price crossed above a key level that it held below for several months. After crossing up, it found another minor resistance level, which it made another clean break above.
Given the clean breakouts above the resistance levels, this is an indication that the market is pretty one sided. We're not seeing fakeouts or any other indications that sellers still want control.
Hourly Timeframe:
The intraday timeframe is used to optimized my proposed entry. There are two key details here.
The EMA20 is crossing above EMA 60, which is an indication confluence where the intraday trend is aligned with the daily trend.
The pink trendline helps indicate the end of the counter-trend movement. When price crosses above this trendline, it also indicates that I can expect further upside (or that it's very likely).

Revenge on the mind? The Most Expensive Trade You'll Ever TakeThe most expensive trade isn’t that first loss of the session.
It’s the second one, the one you took trying to get it back.
The chart here is one of a sideways consolidation. Easy in hindsight right? But if you're a break out trader, or one that is looking to get involved but is caught in the noise - it's easy to get collected and feel irritated and out of sorts. How it shows up in behaviour is that one might increase size - double down - move stops (to name but a few examples).
That moment of being picked off feels electric:
You’re angry at the market.
You want to erase the red.
You convince yourself the setup is “still good.”
But it isn’t trading anymore. It’s revenge.
I’ve seen traders burn accounts this way.
It doesn’t matter whether you’re trading a $1k retail account or a $10M book, the loop looks the same.
Here’s the truth most won’t admit:
👉 Losing isn’t the problem.
👉 How you react to the loss defines your career.
So how do you break the loop? Three quick checks:
The Pause Rule : After a loss, step away for 5 minutes. If you feel an urge to “get it back,” you’re not trading you’re reacting. Take a walk. Breathe. Let that urge simmer down.
The Red Line: Decide before you start how many trades or a max loss per session you’ll allow. Hit that line? Walk away. Live to trade another day.
The Reset: Write down what just happened, in one sentence. Putting it on paper shifts you out of the emotional loop and back into analysis.
If you’ve felt the pull of revenge trading, hit follow this is where we break down the emotional traps behind every chart. Let me know if you've experienced this too.
Please note - this is not a Trade Idea. I'm exploring the mindset behind trading using this chart as an example.

TESLA WILL KEEP GROWING|LONG|
✅TESLA is going up
Now and the stock made a bullish
Breakout of the key horizontal
Level of 346.00$ and the breakout
Is confirmed so we are bullish
Biased and we will be expecting
A further bullish move up
LONG🚀
✅Like and subscribe to never miss a new idea!✅

EUR-CHF Bearish Breakout! Buy!
Hello,Traders!
EUR-CHF made a bearish
Breakout of the key horizontal
Level of 0.9361 so we are
Bearish biased and we
Will be expecting a
Further bearish move down
Sell!
Comment and subscribe to help us grow!
Check out other forecasts below too!
Disclosure: I am part of Trade Nation's Influencer program and receive a monthly fee for using their TradingView charts in my analysis.

NZDCHF: Downtrend MomentumSimilar to NZDCAD, there's a very similar signal on NZDCHF.
Daily Timeframe:
Unlike with NZDCAD, price broke through support very cleanly. It is currently holding below with no indication of a fakeout.
Likewise, EMA20 remains firmly below EMA60, which is the other indication that this is a downtrend.
Hourly Timeframe:
I use an ascending intraday trendline to indicate when the counter-trend movement is coming to an end. As price breaks below the intraday trendline, that's a good indication of confluence in the overall trend direction.
The EMA crossover is not great, which is a little bit of a concern to me. Will need to reduce risk and potential scale into a position depending on how this trade goes.

S&P (CASH500) | 30min Inverse Head & Shoulders | GTradingMethodHello Traders.
Welcome to today’s trade idea by GTradingMethod.
🧐 Market Overview:
Following Friday’s sharp rally after Jackson Hole, the S&P 500 may be forming a bull flag. If confirmed, this setup could drive an equal measured move higher, with the inverse head & shoulders pattern acting as a potential breakout structure.
📊 Trade Plan:
Risk/Reward: 3.6
Entry: 6460.1
Stop Loss: 6453.8
Take Profit 1 (50%): 6481
Take Profit 2 (50%): 6489
💡 GTradingMethod Tip:
Always wait for confirmation of breakout patterns to avoid false moves.
📌 Please note:
This is not financial advice. This content is to track my trading journey and for educational purposes only.

Energy Fuels, the most bullish chart in the market ? AMEX:UUUU $EFR.TO Energy Fuels, the most bullish chart in the market ? With China controlling 90% of the rare earths market and the arrival of robots, domestic US supply needs to increase quickly. Energy Fuels is one of the few plays.

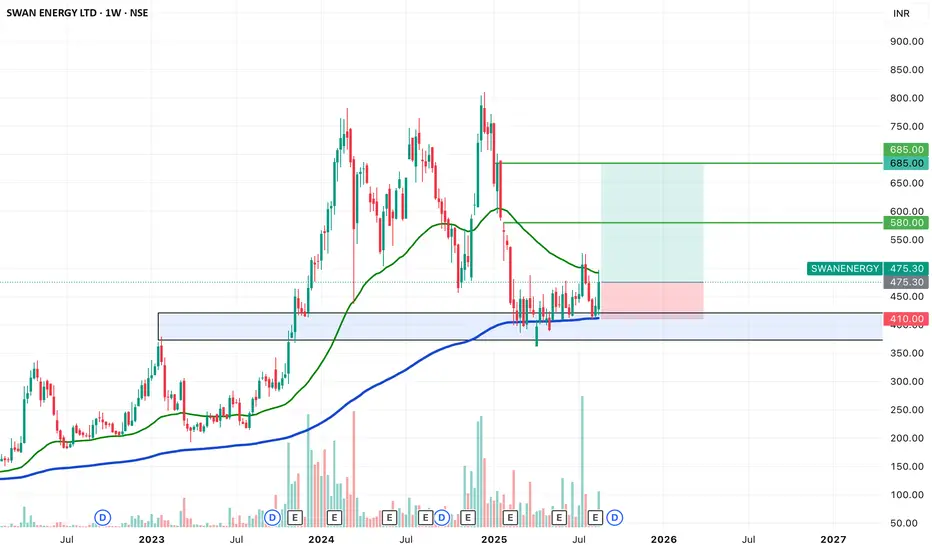
SWING IDEA - SWAN ENERGYSwan Energy , a diversified company with interests across textiles, energy, and real estate, is showcasing a strong swing trade opportunity backed by reliable technical signals.
Reasons are listed below :
The 450 zone has acted as a strong support, and price is now attempting a breakout from a 6-month Darvas box consolidation.
A strong bullish engulfing candle on the weekly timeframe signals renewed buying interest.
The 200 EMA on the weekly chart is acting as a solid support.
The stock is also bouncing from the golden 0.618 Fibonacci retracement zone.
Target - 580 // 685
Stoploss - weekly close below 410
DISCLAIMER -
Decisions to buy, sell, hold or trade in securities, commodities and other investments involve risk and are best made based on the advice of qualified financial professionals. Any trading in securities or other investments involves a risk of substantial losses. The practice of "Day Trading" involves particularly high risks and can cause you to lose substantial sums of money. Before undertaking any trading program, you should consult a qualified financial professional. Please consider carefully whether such trading is suitable for you in light of your financial condition and ability to bear financial risks. Under no circumstances shall we be liable for any loss or damage you or anyone else incurs as a result of any trading or investment activity that you or anyone else engages in based on any information or material you receive through TradingView or our services.
@visionary.growth.insights
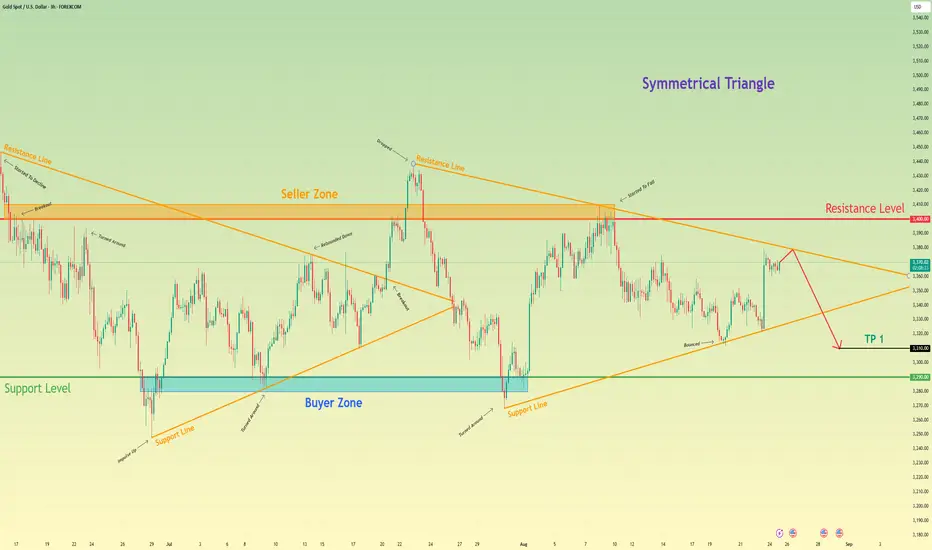
Gold will drop from resistance line of triangle to 3310 pointsHello traders, I want share with you my opinion about Gold. The market for Gold is currently defined by a large symmetrical triangle, a pattern of equilibrium that has formed after a strong rebound from the 3290 buyer zone halted the previous downward trend. This new market structure indicates a period of contracting volatility, with the price action for XAU being methodically squeezed between a descending resistance line and an ascending support line. These boundaries are anchored by the major seller zone around the 3400 resistance level and the aforementioned 3290 buyer zone. At present, the asset is at a critical inflection point, having rallied to test the descending resistance line of this triangle. The primary working hypothesis is a short scenario, based on the expectation that the 3400 seller zone will hold and that sellers will re-emerge to defend this territory. A confirmed rejection from this upper boundary would validate the integrity of the symmetrical triangle and likely initiate another major downward rotation within the pattern. This fall would target the ascending support line and the underlying horizontal support. Therefore, the TP for this rotational play is logically placed at 3310 points. Please share this idea with your friends and click Boost 🚀
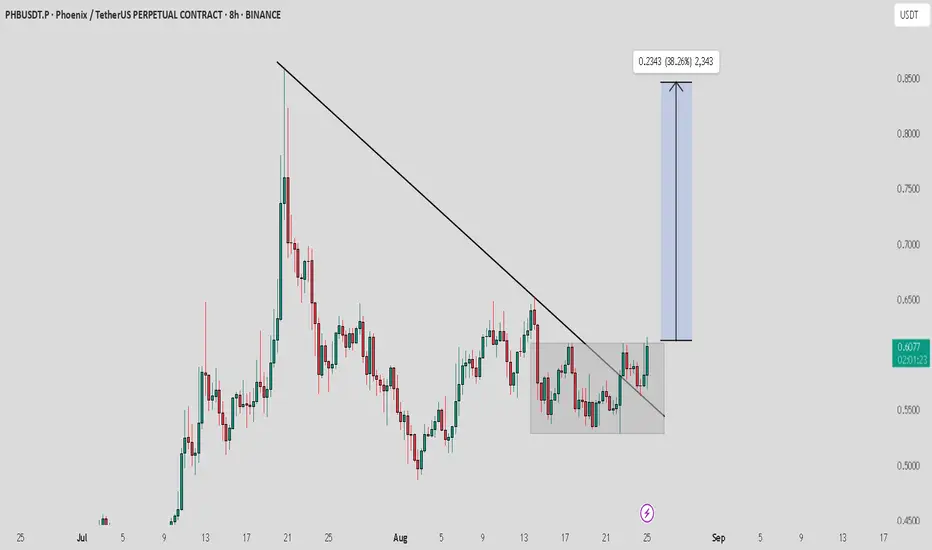
PHB / USDT : Looking bullish..Waiting for box breakoutPHB/USDT has broken above its trendline resistance after a period of consolidation. This breakout is showing strong potential, and if momentum sustains, price could rally toward the $0.80–0.85 zone.
Best approach: Wait for confirmation on retest or a strong bullish candle with volume before entering to avoid fake breakouts. Always manage risk properly.
GOLD to $3,450? The Most Important Breakout of 2025
🔥 Gold has been one of the most talked-about assets in 2025, and now it’s testing the critical $3,370 resistance zone once again (price at $3,372 as of Aug 24).
📈 Bullish Case:
If gold breaks and closes above $3,370, we could see momentum push toward $3,390–$3,395 in the short term.
📉 Bearish Case:
If rejected here, support remains strong around $3,325–$3,330, aligned with the 100-day SMA.
👉 Do you think gold will finally break higher this week, or get rejected again? Drop your thoughts in the comments
Disclaimer:
This is not financial advice. Shared for educational purposes only.

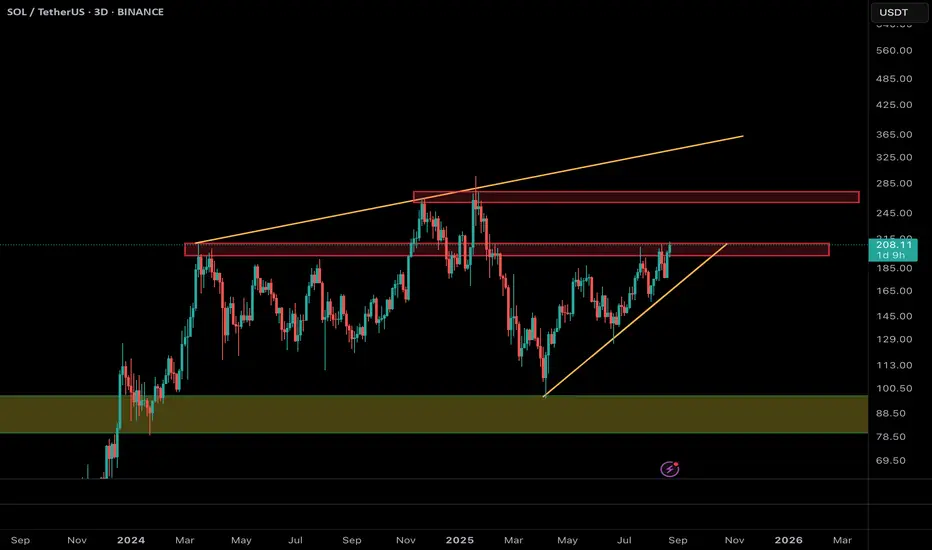
Solana at Make-or-Break: Can $213 Unlock the Rally to $270?Solana (SOL/USDT) has been recovering strongly since bouncing from the $110 area and is now testing the critical resistance zone around $205–213. This level has acted as a major barrier multiple times in the past, making it a true “make-or-break” point.
📌 Bullish Scenario (more likely if $213 holds):
• A confirmed breakout and daily/3D close above $213 could trigger a rally toward the next major resistance at $270.
• A successful move beyond $270 may even open the path toward the long-term resistance trendline near $320–340.
📌 Bearish / Alternative Scenario:
• If Solana fails to hold above $213, a pullback toward $180–175 is possible.
• Stronger support lies around $100, which remains the key level to defend for bulls.
⚡ Conclusion:
As long as SOL stays above $200, the structure remains bullish. A breakout above $213 would confirm momentum and unlock a potential move toward $270, while rejection could mean another corrective dip before the next attempt.
SUDARSHANCHEMSUDARSHANCHEM showing very good strength and consolidating since a month near ATH. Result is expected tomorrow on 25-Aug. If it declares bumper result then we may see next leg of steep rally. In recent time accumulation has been observed. Provided that if it closes above 1380 level then one may get very good risk-reward trade from hereon. Keep a stock in watch list. Just a small volume may push it above resistance line.
