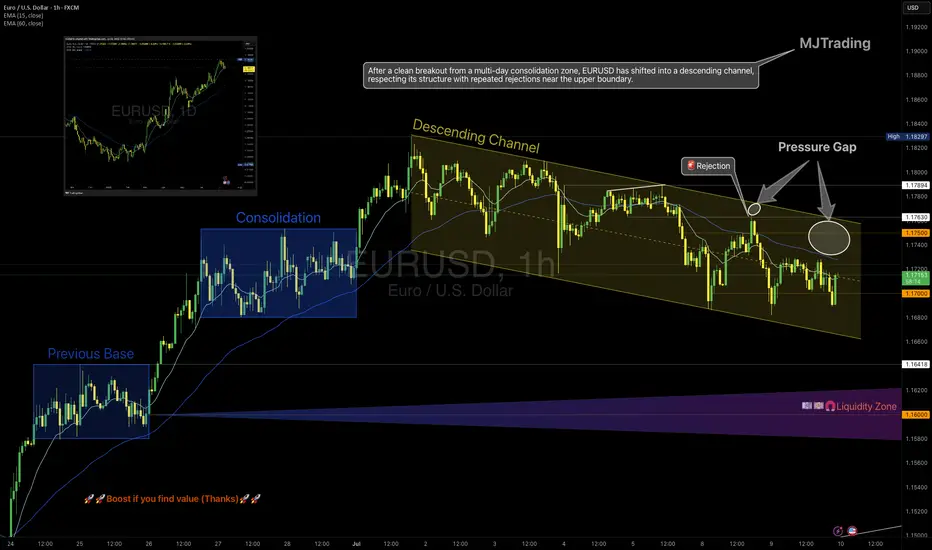
EURUSD – From Structure to Shift
1H Technical Outlook by MJTrading
EURUSD moved cleanly through a sequence of structural phases:
• Previous Base
• Multi-day Consolidation (potential quiet accumulation)
• Transition into a well-respected Descending Channel
Price has since shown repeated rejections from the upper boundary, including a decisive selloff from the 1.1750 zone, forming what we now label a "Pressure Gap" — a space where aggressive sellers overwhelmed price.
🧭 Key Scenarios Ahead:
🔻 Bearish Continuation:
Breakdown below 1.1700 opens room toward:
• 1.1640 (channel bottom)
• 1.1600 Liquidity Zone
Watch for impulsive sell candles + EMA rejection
🔁 Short-Term Bounce or Trap:
Holding above 1.1700 could spark a rebound toward 1.1750
This may serve as a final test before another leg lower
Only a clean break and hold above 1.1763 flips structure bullish
🔍 Bonus Confluence:
1D Chart shows broader bullish context (inset)
EMAs tightening = expect volatility burst
Well-defined structure gives clear invalidation and targets
Every trend tells a story — from base building to breakout, and now a possible breakdown. Trade the structure, not the prediction.
#EURUSD #Forex #TradingView #TechnicalAnalysis #PriceAction #DescendingChannel #LiquidityZone #SmartMoney #MJTrading
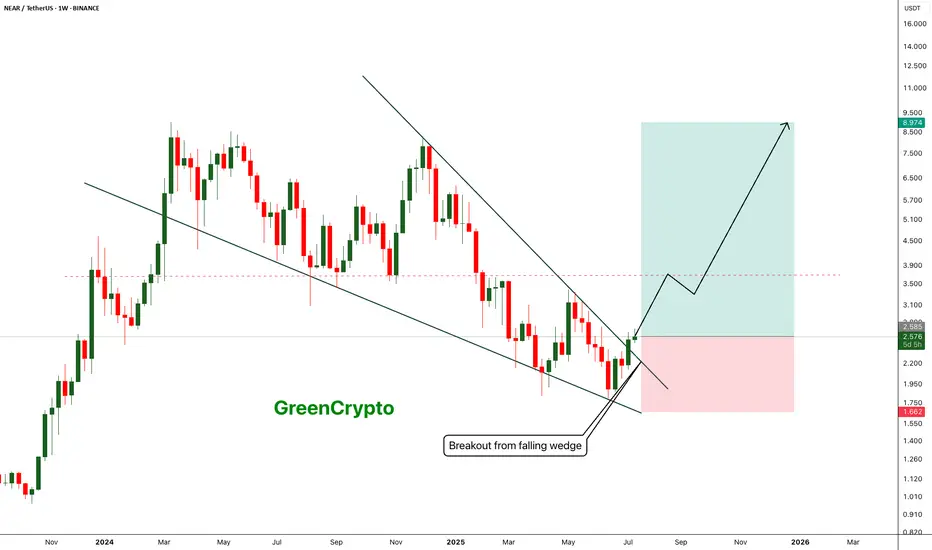
Breakout
NEAR - Breakout from falling wedge pattern- Near has successfully broken out from the falling wedge pattern and now heading towards the next minor resistance around 3.6 range
- breakout from the minor resistance should push price towards the 9$ range
Entry Price: 2.57
Stop Loss: 1.66
TP1:2.935
TP2: 3.256
TP3: 3.986
TP4: 5.461
TP5: 7.102
TP6: 8.948
Stay tuned for more updates.
Cheers
GreenCrypto
ASTS massive daily bull flagWith the cult like following on this ticker, a 4H break out and hold of this bull flag to the upside could see massive retail money piling in to send the price back to $54 ATH. RSI is also showing potential bullish confluence. The 4H chart has daily EMAs overlayed. The price is currently sitting above the daily 7EMA. Breakout above ATH and it's clear blue skies with no resistance. Huge potential.

CRV ANALYSIS🔮 #CRV Analysis 💰💰
🌟🚀 As we can see that #CRV is trading in a symmetrical triangle and given a perfect breakout. But there is an instant resistance. If #CRV breaks the resistance 1 then we will see a good bullish move in few days . 🚀🚀
🔖 Current Price: $0.7280
⏳ Target Price: $1.0800
#CRV #Cryptocurrency #DYOR

ETHEREUM WILL KEEP GROWING|LONG|
✅ETHEREUM is going up
Now and the coin made a bullish
Breakout of the key horizontal
Level of 3000$ and the breakout
Is confirmed so we are bullish
Biased and we will be expecting
A further bullish move up
LONG🚀
✅Like and subscribe to never miss a new idea!✅
Disclosure: I am part of Trade Nation's Influencer program and receive a monthly fee for using their TradingView charts in my analysis.

CRUDE OIL Bearish Flag Breakout! Sell!
Hello,Traders!
CRUDE OIL is trading in a local
Downtrend and formed a bearish
Flag pattern and now we are
Seeing a bearish breakout
So we are bearish biased
And we will be expecting
A further bearish move down
Sell!
Comment and subscribe to help us grow!
Check out other forecasts below too!
Disclosure: I am part of Trade Nation's Influencer program and receive a monthly fee for using their TradingView charts in my analysis.

SUI - Breakout of the year- SUI is currently trading near the resistance line. Price was reject around this resistance line in the previous pump.
- Given the current bullish market, price is expected to breakout from this resistance easily
Entry Price: 4.04
StopLoss: 3.2
TP1: 4.5059
TP2: 5.3810
TP3: 6.5106
TP4: 7.8772
TP5: 10+
Don't forget to set stoploss.
Stay tuned for more updates
Cheers
GreenCrypto

EUR_USD BEARISH BREAKOUT|SHORT|
✅EUR_USD was trading along
The rising support line but
Now we are seeing a strong bearish
Breakout and the breakout is
Confirmed so we are bearish
Biased and we will be expecting
A further bearish move down
After the potential pullback
SHORT🔥
✅Like and subscribe to never miss a new idea!✅
Disclosure: I am part of Trade Nation's Influencer program and receive a monthly fee for using their TradingView charts in my analysis.

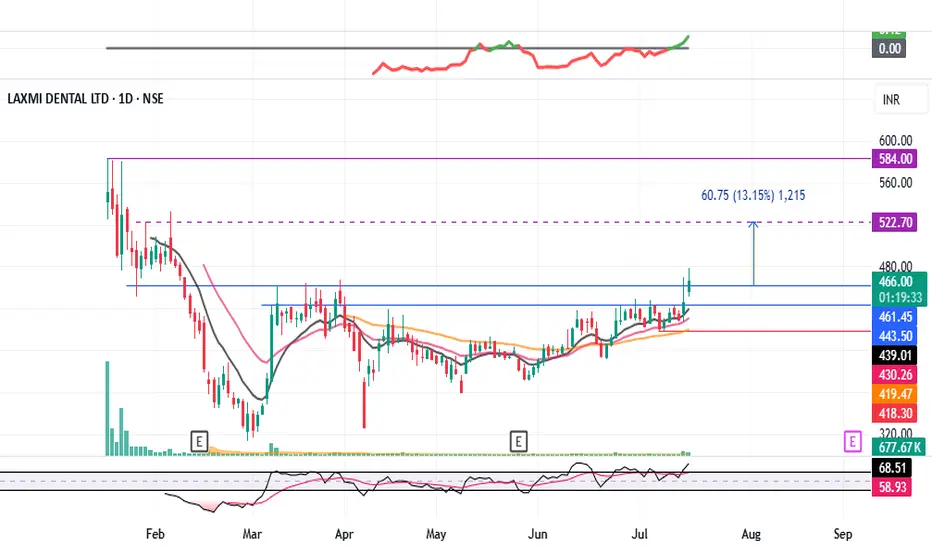
LAXMIDENTL : Consolidation Breakout#LAXMIDENTL #breakout #breakouttrading #ipostock
LAXMIDENTL : Swing Trade
>> Consolidation Breakout
>> Volumes Building up
>> Stock in Momentum
>> Good Strength in stock
>> Trending setup
Swing Traders can lock profit at 10% and keep trailing
Pls Boost, Comment & Follow for more analysis
Disc : Charts shared are for Learning purpose not a Trade Recommendation, Take postions only after consulting your Financial Advisor or a SEBI Registered Advisor.
Wooow DOGEUSDT breakout happening Major resistance which is 0.22$ and is also channel resistance is breaking and BINANCE:DOGEUSDT would be nonstop bullish after that at least for a while to the targets like 0.40$ and 0.60$.
As we can see on the chart here is last valid and strong resistance zone after that i am expecting nonstop rise for This token which is still sleep and soon will follow the market and also lead with daily +15% candles.
DISCLAIMER: ((trade based on your own decision))
<<press like👍 if you enjoy💚

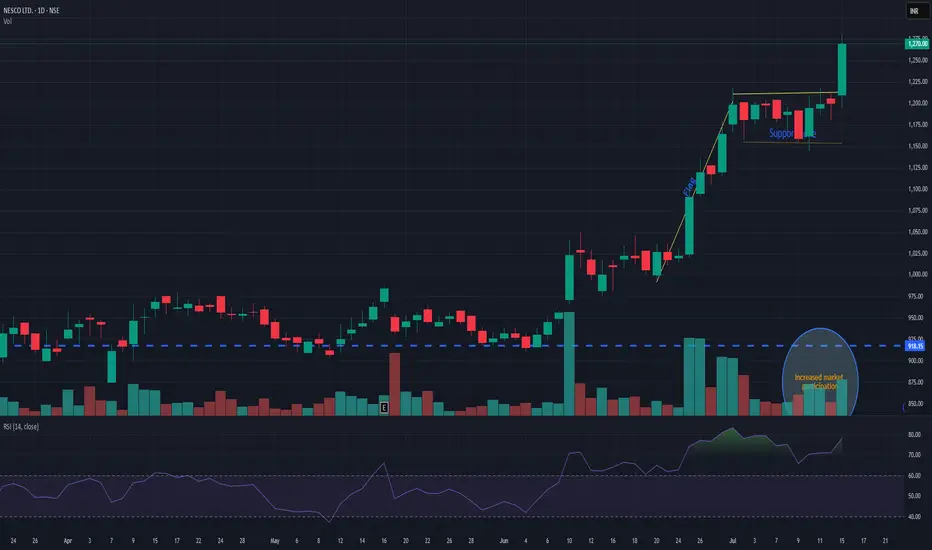
NESCONESCO giving flag pattern breakout with decent volume. Support is seen nr 1180. while pole initiation can be seen near 1010. Currently trading near 1270. It has a potential for new momentum. Keep it on radar.
ETH - Confirmed target is 4100- After successfully breakout from the major resistance price is heading towards the next resistance line.
- From the previous all time high, we have a clear resistance around 4100 range.
- We can expect this bullish trend to continue easily and reach the next resistance around 4100.
Stay tuned for more updates
Cheers
GreenCrypto

ADA - Beginning of something crazy- ADA is looking forward to the successfully breakout of the trendline resistance.
- A clean breakout from this resistance must to fuel the bullish trend.
- I'm expecting a target of 3$ from this trend.
Entry Price: 0.72
Stop Loss: 0.4838
TP1: 0.8602
TP2: 1.0342
TP3: 1.3379
TP4: 2.0144
TP5: 2.4818
TP6: 3.0329
Stay tuned for more updates
Cheers
GreenCrypto

SUI on its way to the teal pennants breakout targetSui has joined the bullishness here as it has brown up from the pennant and well on its way to the target. *not financial advice*

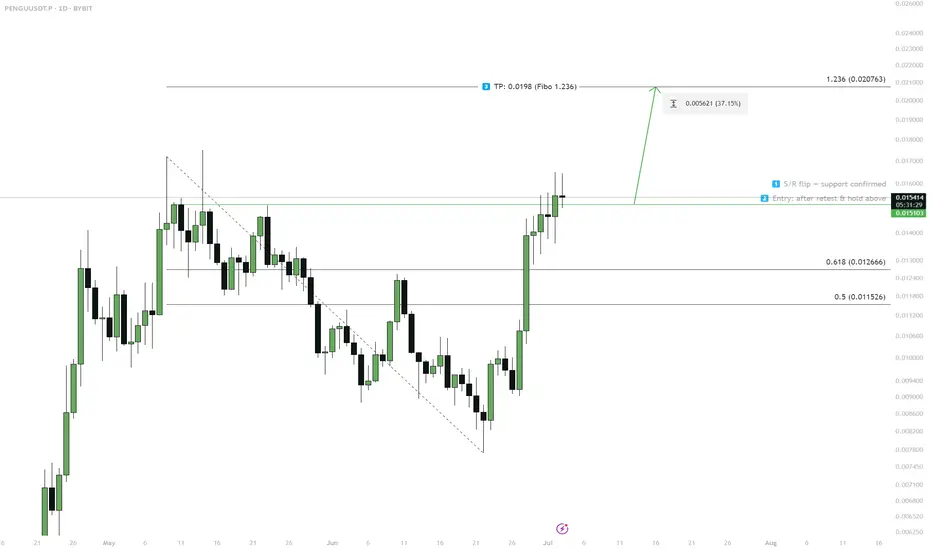
PENGU — S/R Flip & Breakout Scenario1. S/R flip at 0.0151 — wait for retest
2. Enter on successful hold above 0.0151
3. Target: 0.0198 (Fibo 1.236)
4. If fails to hold above 0.0151 — scenario invalid
$HIMS - ORBCLEAN breakout for NYSE:HIMS today.
DP_ORB Indicator marked it at candle close outside of ORB Zone, with confirmation bias from a higher high, and volume. All take profits were hit!
If you want the DP_ORB Indicator for FREE:

BTC Massive SetupConsolidation for months between 91k and 106k
- Classic Wyckoff setup as an accumulation/distribution
- Price targets of: 121.878 (122k is the popular target) to the upside with 75,827 on the down
- Saylor today put out news to be raising another $2 billion to buy BTC. Either he is going to be able to hold the floor or get washed out
- Trade can be taken with confirmation of breakout on either side pretty easily as momentum will be so strong that being on the wrong side will most likely be an immediate stop out

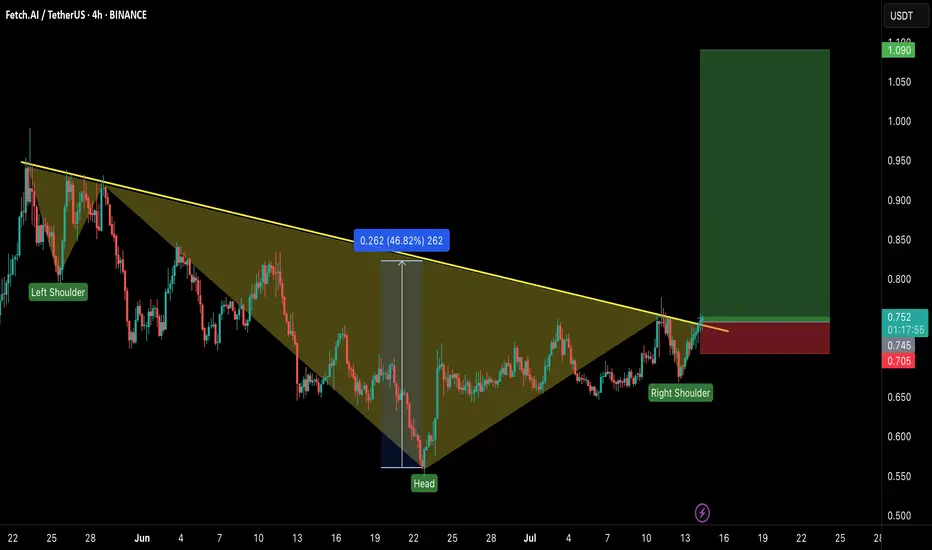
FET/USDT – Head & Shoulders Breakout!Hey Traders — if you're into high-conviction setups with real momentum, this one’s for you.
ONDO is trading inside a falling wedge on the daily chart — a classic bullish structure that often leads to explosive breakouts. 📈
FET just broke out of a classic inverse head & shoulders pattern — a strong bullish reversal structure! The breakout looks clean with a confirmed close above the neckline and volume starting to pick up.
💼 Entry: CMP ($0.75)
🎯 Targets: $0.85 / $0.95 / $1.09
🛑 Stop-loss: $0.705
📈 Risk-Reward: Favorable
🧠 Why it matters:
Clean breakout above resistance
Strong trend reversal structure
Potential for 40%+ move ahead.
💬 Are you in this breakout play or watching from the sidelines? Let’s talk below!
👉 Smash that LIKE and FOLLOW for more real-time setups!
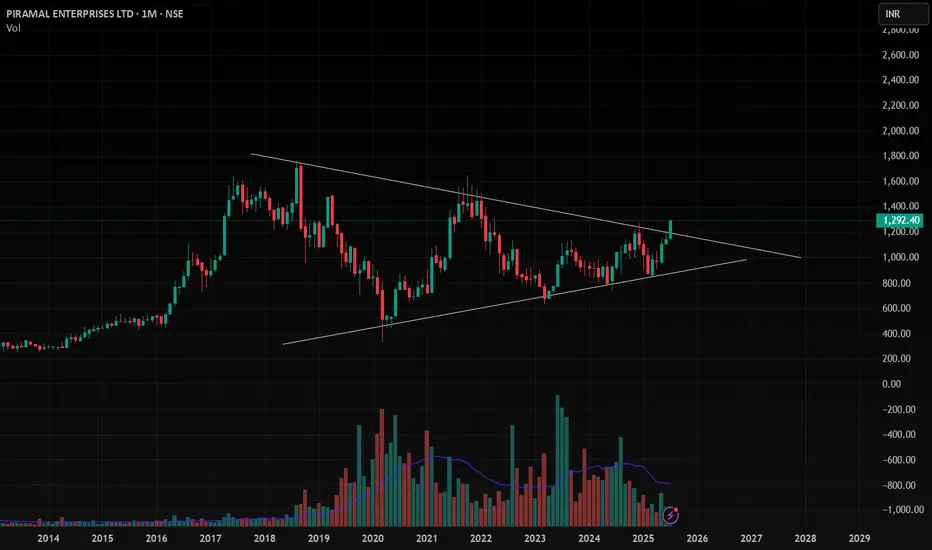
PEL , 1M , BullishThe Triangle Pattern is Breaking Out in Monthly Time Wait for Strong and Perfect close in Weekly Time and Enter after Confirmation .
Take Risk According to your capital
Follow for more ideas like this
New Week on Gold! Will the Bullishness continue?I was bullish on gold and price ended up doing as expected last week and looking for it to continue this week. But i have to sit on hands for now to see how they want to play Monday. Will they move to create a Low for the week first? or will they break out to start early on new highs? I have to see some type of confirmation first. Then we can get active.

FET — AI Market Wake-Up Above $0.801. Watch for breakout & close above $0.80
2. Enter on confirmed weekly hold > $0.80
3. TP: $1.12–1.25 (major resistance)
4. Key support: $0.73–0.71 (must hold)
5. Stop: below $0.71

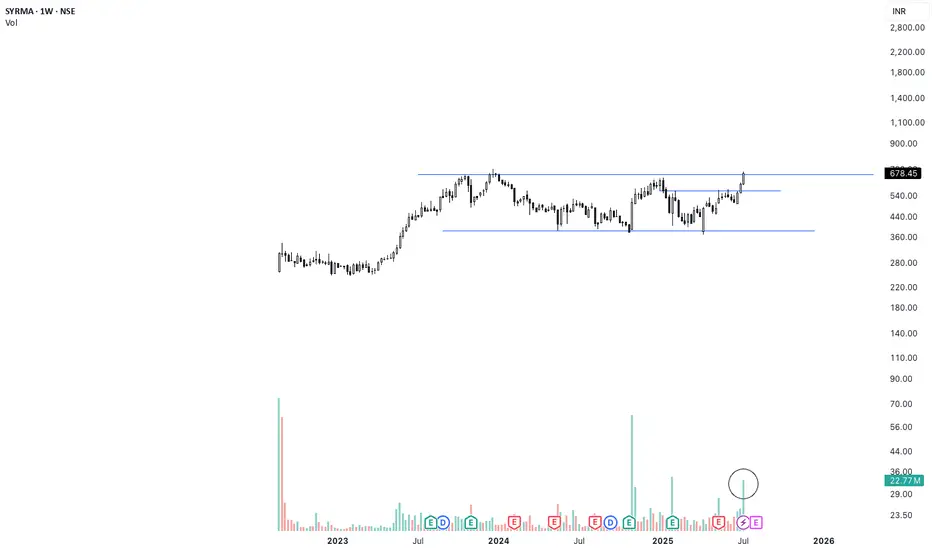
SYRMA Weekly Breakout | High Volume + 1.5-Year Base Structure🚨 Breakout Alert on SYRMA (Weekly)
After 1.5 years of sideways consolidation, SYRMA has finally broken out with strong conviction. The breakout is supported by the highest weekly volume seen in months — signaling smart money accumulation.
📊 Technical Setup:
🔹 1.5-year base formation now broken
🔹 Breakout candle closed above resistance with strength
🔹 Volume spike confirms breakout validity (HVE)
🔹 Structure resembles classic Stage 2 breakout
🟢 Ideal retest zone: ₹670–₹680
🛑 Support zone: ₹635–₹645
Fundamental Snapshot:
✅ Revenue: ₹2,000 Cr → ₹3,800 Cr in 2 years
✅ Net Profit up 50% YoY
✅ EPS (TTM): ₹9.57
✅ Promoter holding: ~46%
✅ Dominant player in EMS & IoT hardware
⚡Macro trend supports domestic electronics manufacturing — still early in the cycle.
GBP-CHF Bearish Breakout! Sell!
Hello,Traders!
GBP-CHF is trading in a strong
Downtrend and the pair
Broke the key horizontal
Level around 1.0780 which
Reinforces our bearish
Bias and we will be
Expecting a further
Bearish move down
On Monday!
Sell!
Comment and subscribe to help us grow!
Check out other forecasts below too!
Disclosure: I am part of Trade Nation's Influencer program and receive a monthly fee for using their TradingView charts in my analysis.
