AUDUSD: Weak DowntrendKey Observations:
Price is holding below the daily HTL, which gives me a bearish sentiment
The latest reaction from the daily HTL is a bit weaker, which gives me a small point of concern
This is going to be another attempt to trade the price acceleration from the EMA band to the downside
If price fails to make a significant low, I think it's safe to say that we'll see a reversal and stronger likelihood to the upside
Breakout

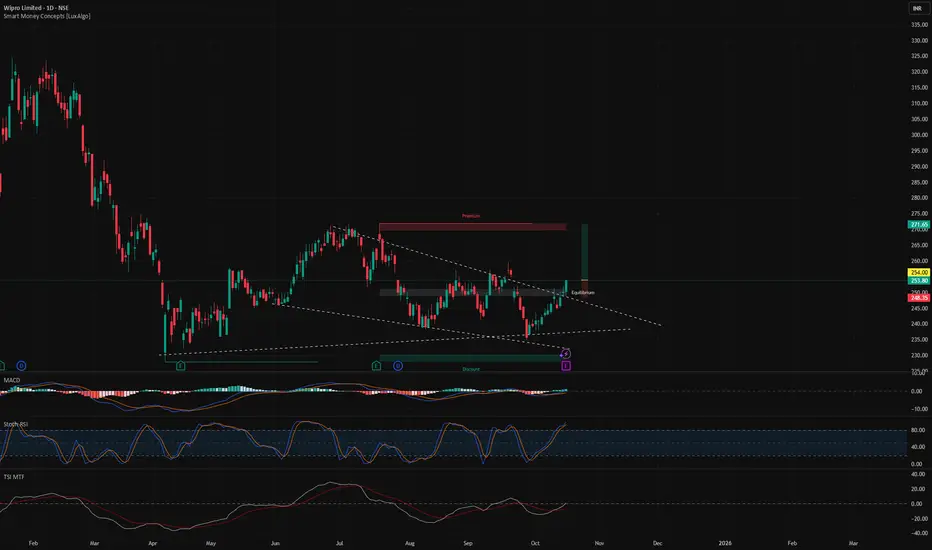
Breakout in WIPROBreakout in WIPRO.
Entry - 254
Targets - 270, 285 & 310
SL - 248
DISCLAIMER: I am not SEBI registered and the ideas posted are only for educational purpose. Do a proper analysis and always trade with STOP LOSS.
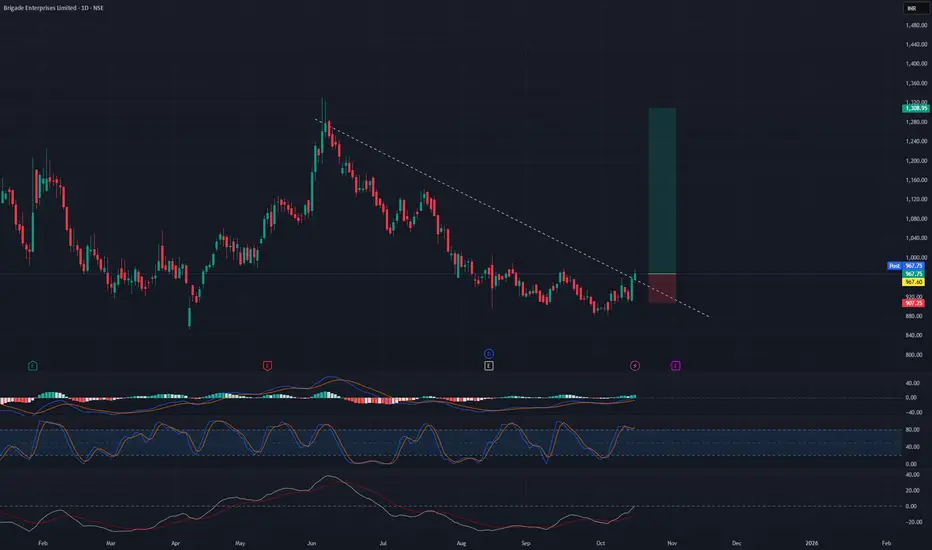
Breakout trading in BRIGADESwing trading opportunity in BRIGADE.
Entry - 970
Targets - 1130 & 1300
SL - 904
DISCLAIMER: I am not SEBI registered and the ideas posted are only for educational purpose. Do a proper analysis and always trade with STOP LOSS.
ADM 1W - Bulls back in the field Weekly chart shows ADM breaking through the long-term trendline and holding above the support zone - a clean breakout + retest setup.
EMAs are stacked below the price, confirming bullish control. RSI remains healthy, leaving room for continuation.
✅ Support zone: 55–60
🎯 Target 1: 80
🎯 Target 2: 98.8
As long as price holds above the 60 level, momentum may continue toward the next resistance around 80, and eventually to 98.8.
Fundamentally , ADM stays strong in the agricultural and food supply chain - from grain processing to biofuels - sectors that remain essential regardless of market cycles.
In short: bulls are planting seeds for a solid harvest 🌾📈

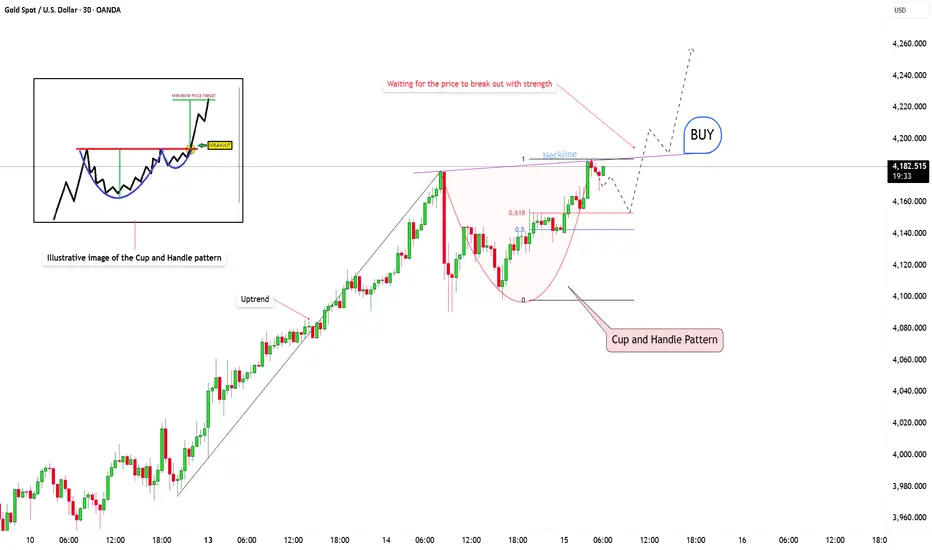
XAUUSD detects the Cup and Handle patternThe market context on XAUUSD is still clearly bullish. The latest movement has shown a stable recovery, pushing towards the expected channel top. But let's pay attention to what happens at this price level.
The price tested it once... and then bounced down.
It’s coming back...
And now, for the third time, we’re waiting for buyers to defend this level again...
This looks a lot like a Cup and Handle pattern, a strong signal that buyers are building significant bullish momentum.
Now, let’s break it down: The real confirmation comes when the price breaks through the neckline, the resistance level connecting the peaks.
That breakout tells us the change is real! Strong and clear.
And right now, the market is consolidating.
This is the Cup and Handle pattern: a continuation pattern signaling an uptrend. When the price breaks out of the handle, it’s the confirmation that buyers are back, and the new bullish trend is starting.
GBPCHF: Price Breach Daily HTLKey Observations
Daily Timeframe:
Price recently tested the daily HTL and made a weak reaction, indicating that buying strength at this level is very lackluster
H1 Timeframe:
Price is breaching the intraday ATL, signals counter-trend move is coming to an end and we're seeing confluence with the daily downtrend
Price is also accelerating away from the EMA band as another signal of momentum picking up

AUDUSD: Price Holds Below Daily HTLKey Observations
Daily Timeframe:
Price remains below HTL, which signals lack of strength to try and trade above it
Downside momentum is likely to pick up as price is below EMAs and EMA20 is threatening to cross back below EMA60
H1 Timeframe:
Price remains bearish as indicated by it's inability to trade above the EMA band and sustain that momentum
Price crossed back below the EMA band with a strong bearish candle so the entry is based on the current pullback move

EURUSD Short: Trend Continuation After BreakdownHello, traders! The prior market structure for EURUSD has shifted to a bearish bias following a major reversal from the supply 2 level near 1.1835. The failure of a prior ascending channel initiated a new downtrend, which has been guiding the price auction lower through a series of complex breakdowns and consolidations.
Currently, the price action has shown significant weakness by breaking below the key horizontal support at the 1.1580 level. After multiple failed attempts by buyers to hold this level, sellers have successfully pushed the price below this critical area. The auction is now in a corrective pullback, approaching this broken support level from below for a classic retest.
My scenario for the development of events is a continuation of the downtrend. I believe this rally is a corrective retest that will fail upon reaching the 1.1580 level, which should now act as strong resistance. In my opinion, a confirmed rejection from this area will validate the bearish control and trigger the next impulsive move down. The take-profit is therefore set at 1.1510. Manage your risk.

EURUSD: Down Trend will Continue in ChannelHello everyone, here is my breakdown of the current Euro setup.
Market Analysis
EURUSD has shifted to a bearish structure. This happened after a 'fake breakout' to a new All-Time High was aggressively sold off, leading to a sharp reversal. This sell-off has since been contained within a well-defined Downward Channel, creating a series of lower highs and lower lows.
Currently, the price is in a corrective rally phase. After finding support near the 1.1550 level, the price has bounced and is now directly testing the descending resistance line of this channel. This is a critical area where the dominant downtrend could resume.
My Scenario & Strategy
I'm looking for the price to complete this corrective rally, possibly with one small final push higher, and then show a clear sign of rejection from the resistance line. This failure to break out would be the key signal that sellers are stepping back in.
Therefore, the strategy is to watch for this rejection. A confirmed reversal would validate the short scenario. The primary target for the subsequent decline is 1.1525, aiming for a new low within the channel's structure, near the Support zone.
That's the setup I'm tracking. Thank you for your attention, and always manage your risk.

USD/CAD: Bearish Loonie SlideUSD/CAD: Bearish Loonie Slide Amid #Fed Cut Hype and #Forex Volatility Buzz? 1.39 Breakout Target in Sight?
USD/CAD is trading at 1.3795 today, up 0.17% amid a rebound from 1.3728 lows as markets eye the Fed's rate decision later, with 65% odds of a 50bps cut to 4.00-4.25% pressuring the dollar but offset by BoC's own easing signals.
This follows a 0.25% CAD gain earlier in the week on CPI data, but the pair remains range-bound with analysts forecasting a bearish tilt to 1.35 by year-end if Fed cuts deepen.
Just as #Fed surges with 15K mentions on X amid rate speculation, and #Forex trends spotlight policy divergence (e.g., BoC vs. Fed easing), USD/CAD's sensitivity to oil and CAD vulnerability position it for choppy action in the $1.8T daily forex market.
But with volatility at 3.88%, is USD/CAD undervalued for a bull run to 1.39, or will dovish Fed trigger a CAD rebound? Let's break down the fundamentals, SWOT, charts, and setups for September 18, 2025.
Fundamental Analysis
USD/CAD's trajectory hinges on diverging central bank paths, with the BoC's recent cuts weakening the loonie while Fed easing caps USD upside—yet oil prices above $70/bbl support CAD via Canada's export reliance.
Analysts project a 2025 average of 1.35, bearish on CAD amid #Fed cuts, but short-term resistance at 1.3800 could hold if US data softens. With #Forex volatility buzzing, the pair's undervaluation shines in a risk-on environment if Fed delivers 50bps, but sticky US inflation (2.6% core) risks a hawkish pivot.
- **Positive:**
- BoC easing and CAD vulnerability amid #Forex hype project USD strength to 1.3863 if Fed holds steady.
- Oil tailwinds and EM inflows (e.g., SA bonds) bolster CAD floors, undervaluing the pair at current levels vs. 1.40 peaks.
- Broader #Fed trends favor USD if dot plot signals fewer cuts, eyeing 0.5% monthly gains.
- **Negative:**
- Dovish Fed expectations weaken USD, clashing with #Fed optimism if 50bps cut confirms CAD rebound.
- Canada CPI resilience (2.0% YoY) could strengthen CAD if BoC pauses, pressuring the pair lower.
SWOT Analysis
**Strengths:** Policy divergence favors USD with Fed's relative hawkishness vs. BoC, amplified by #Fed relevance in dollar sentiment.
**Weaknesses:** High oil correlation exposes CAD upside; overbought momentum vulnerable in #Forex-shifting markets post-Fed.
**Opportunities:** Fed cut confirmation narrows spreads, with undervalued bull potential to 1.3891 amid #Fed boom.
**Threats:** Hawkish BoC surprises eroding gains; competition from AUD/CAD if commodity trends capitalize on #Forex volatility.
Technical Analysis
On the daily chart, USD/CAD rebounds in an ascending channel from 1.3728 support, with a pivot at 1.3800 mirroring #Fed volatility spikes. The weekly shows neutral bias with 1.3889 as key breakout. Current price: 1.3795, with VWAP at 1.3770 as intraday balance.
Key indicators:
- **RSI (14-day):** At 55, neutral—potential bull signal amid #Fed surge. 📈
- **MACD:** Histogram positive, crossover holding for upside.
- **Moving Averages:** Price above 21-day EMA (1.3750) but testing 50-day SMA (1.3820)—bullish if holds.
Support/Resistance: Support at 1.3728 (recent low), resistance at 1.3863 and 1.3891. Patterns/Momentum: Channel bounce targets 1.3863; fueled by #Forex momentum. 🟢 Bullish signals: Higher lows on volume. 🔴 Bearish risks: Failure at 1.3800 eyes 1.36.
Scenarios and Risk Management
- **Bullish Scenario:** Break above 1.3863 on hawkish Fed targets 1.3891; long on pullbacks to 1.3728, especially if #Fed signals fewer cuts.
- **Bearish Scenario:** Drop below 1.3728 eyes 1.3538; watch for CAD cross amid #Forex fade on dovish pivot.
- **Neutral/Goldilocks:** Range-bound 1.3728–1.3863 if dot plot mixed and #Fed cools.
Risk Tips: Use stops at 1.3700. Risk 1-2% per trade. Diversify to avoid correlation traps with #Fed-linked pairs like EUR/USD.
Conclusion/Outlook
Overall, a bullish bias if USD/CAD holds 1.3728, supercharged by today's #Fed and #Forex trends, with 0.7% upside to 1.39 on policy divergence. But watch the Fed outcome for confirmation—this fits September's rate volatility theme amid easing hype.
What’s your take? Bullish on USD/CAD amid #Fed cuts or fading the loonie? Share in the comments!

BORORENEWLooks good on Chart.
Breakout soon...
Above all key EMA.
Good for Short Term.
Target 840,1030.
Do Like ,Comment , Follow for regular Updates...
Keep Learning ,Keep Earning...
Disclaimer : This is not a Buy or Sell recommendation. I am not SEBI Registered. Please consult your financial advisor before making any investments . This is for Educational purpose only.

SGDCAD: Price Holds Above Daily HTLKey Observations
Daily Timeframe:
Price tested this daily HTL as resistance a few times. The last break was very strong.
After price reverted below this daily HTL, it did not make a new lower low. Instead, it traded above this level rather quickly.
Overall, this gives me an indication that selling pressure is weakening.
H1 Timeframe:
Price crossed below EMA20, but this was shortlived
As price exits the EMA band, this is an indication that momentum might pick up
Realistically, I might close this trade and re-open in order to bypass the the 5PM rollover spike in spreads

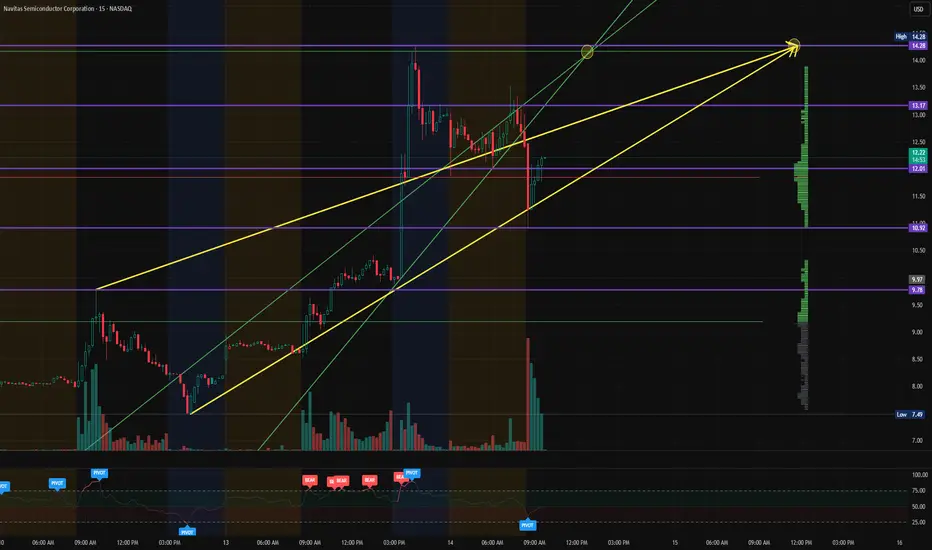
$NVTS - Navitas Semiconductor - $14.28 RetestNASDAQ:NVTS broke out on Friday to $5.78 before pushing up to $14.28 in yesterday's After-Hours. It consolidated to $10.92 before pushing back forward. We're looking for a Continuation to retest $14.28.
$DFLI - Dragonfly Energy - $2.26Entered NASDAQ:DFLI at $1.53 after seeing Volume Spikes and Push to break the $1.58 Price Levels. We are looking to the reaction at $1.64 with a $2.26 PT

BTCUSD: Price can Rebound Up from Support line of PennantHello everyone, here is my breakdown of the current Bitcoin setup.
Market Analysis
Bitcoin has been through an incredibly volatile cycle. After reversing from a major low near the 109400 Support, we saw a powerful rally that led to a new ATH around 126000. Since that peak, the market has been in a deep and complex corrective phase.
Currently, this correction has taken the shape of a large pennant or wedge pattern. The price is consolidating and coiling within this structure. After a recent test of the upper boundary, the price is now pulling back towards the ascending support line for what I see as a critical test.
My Scenario & Strategy
I view the current pullback to the support line as a healthy correction and a logical place for buyers to show interest and defend the structure. A confirmed and strong bounce from this dynamic support would be the key signal for me that the pullback is over and the market is ready to challenge the highs again.
Therefore, the strategy is to watch for this bounce. A successful rebound is expected to lead to a rally that will break the intermediate Resistance at 117300. The primary target for the subsequent move is 118600, which aligns with the resistance line of the pennant.
That's the setup I'm tracking. Thank you for your attention, and always manage your risk.

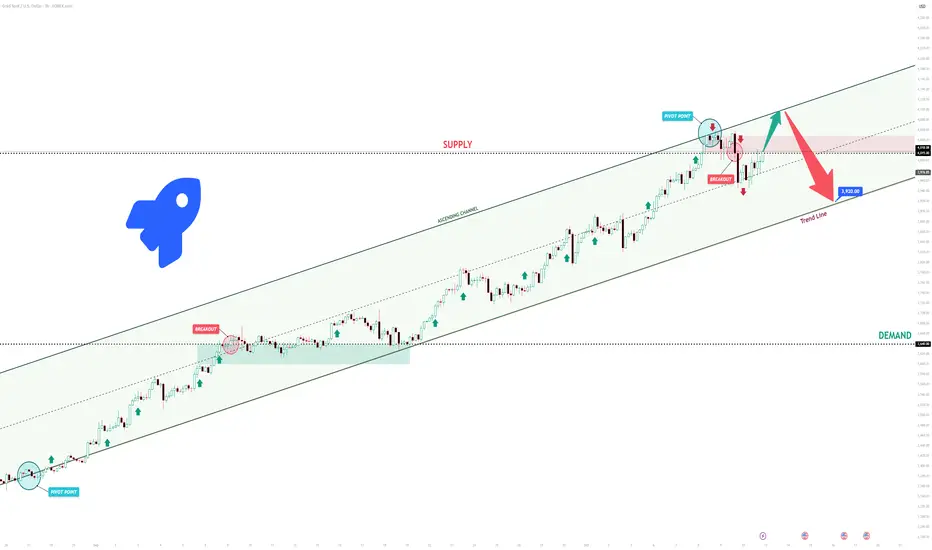
XAUUSD Short: Correction to 3920 Expected from the HighsHello, traders! The price auction for XAUUSD has been dominated by a strong bullish trend, which has been clearly defined by a large ascending channel. The market has consistently made higher highs and higher lows, breaking through key resistance levels like 3640 and showing that the buyer initiative has been in firm control of the trend.
Currently, the auction has reached a major point of contention at the 4015 supply level. The price is consolidating here, right below the upper resistance line of the ascending channel, after a failed initial attempt to break higher. This area represents a significant test for the continuation of the uptrend.
My scenario for the development of events is a 'blow-off top' followed by a correction. I believe the price will make one final push, breaking the 4015 level to touch the channel's upper resistance line. In my opinion, this move will be exhaustive, and a sharp reversal will occur from that line. The take-profit is therefore set at 3920, targeting a retest of the nearby trend line. Manage your risk!
Gold may revisit 4,100 after strong buying pressureOANDA:XAUUSD is trading within a clearly defined ascending channel, with price action currently testing the upper boundary. This level could act as dynamic resistance, and a rejection here could trigger a pullback toward the support zone at 4,100.
If buyers can hold this support, the bullish structure will remain intact, with the potential to continue pushing towards higher levels. However, if price breaks below this area, a deeper correction toward the lower boundary of the channel could unfold.
Monitoring candlestick patterns and volume in this key area is crucial to identify buying opportunities. Risk should be managed appropriately, always confirming your setups and trading with proper risk management strategies.
If you have any thoughts on this setup or additional insights, feel free to share them in the comments!

Buy Kfin Technologies above 1,145 INR Buy Kfin Technologies above 1,145 INR.
Target: 1,180 / 1,220 INR.
Stoploss: 1,078 INR.

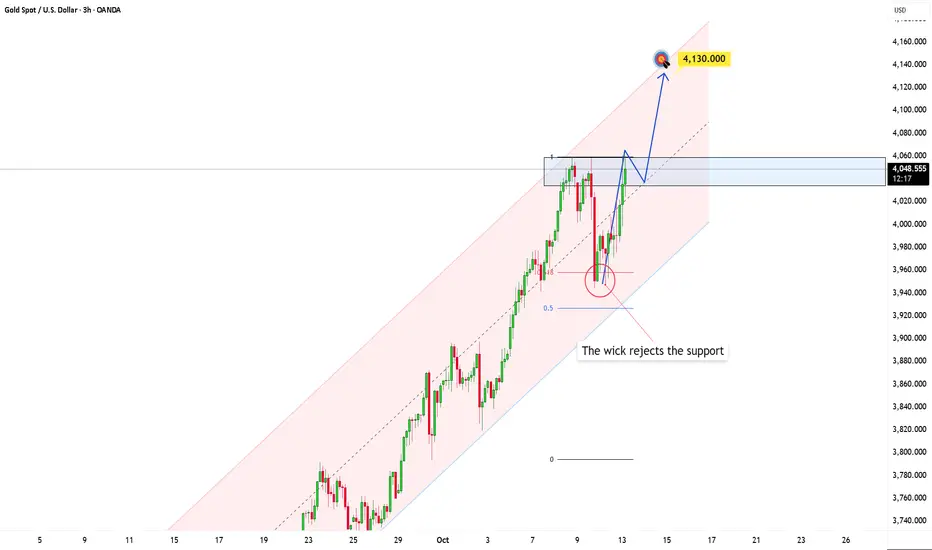
Gold has the potential to set a new highHey everyone, it's Kilian here!
Gold is at a very interesting phase right now. After experiencing a strong price surge within a parallel ascending channel, the market is now showing signs of consolidation at these high levels. This suggests that the buyers still have control, and the bullish momentum remains intact for now.
If the price manages to break through this area with a strong bullish candle and high volume, it will confirm the dominance of the buyers and open up the potential for a new rally towards the target around 4.130, which aligns with the upper boundary of the channel.
However, if the price fails to break through and is instead rejected by strong selling pressure, the appearance of a large bearish candle could signal that the upward momentum is weakening. In this scenario, the price may fall back to test the lower boundary of the channel.
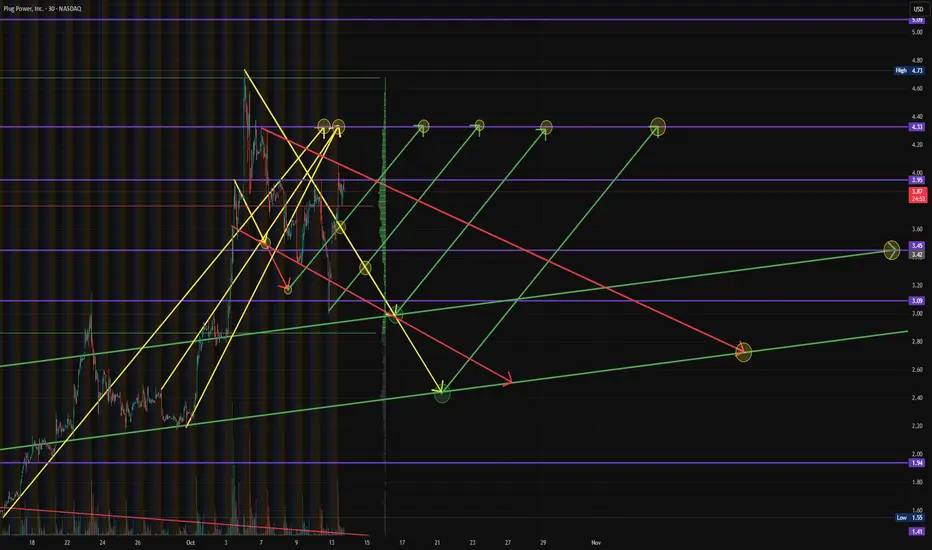
$PLUG - Plug Power - $4.33 PTNASDAQ:PLUG consolidated to chart the $3.09 and found support like we initially targeted and rebounded to $3.95 before showing potential consolidation for additional entries.
Still holding a $4.31 RT to breakout to that $5.09 PT will potentially providing re-entry at $3.45 if it does consolidate again first.
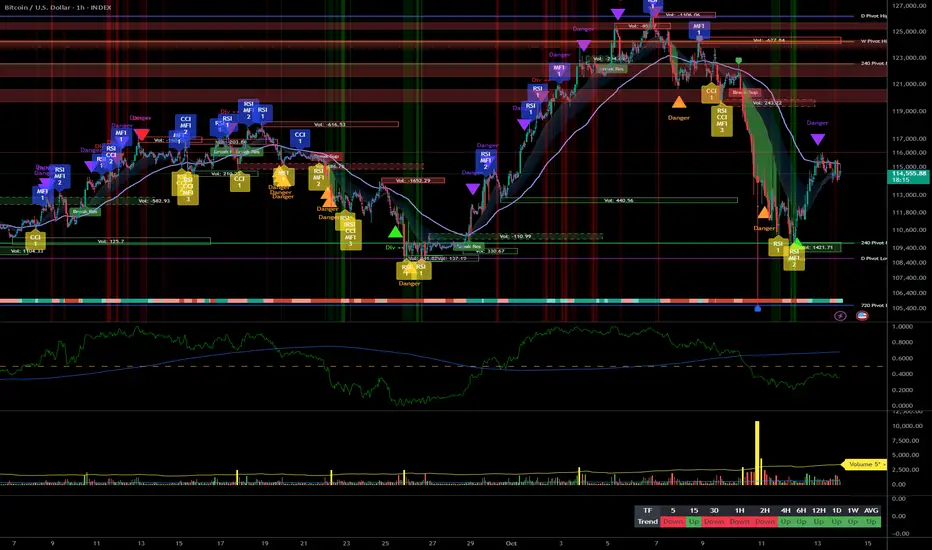
Deleveraging done, waiting for a 116k confirmation__________________________________________________________________________________
Market Overview
__________________________________________________________________________________
BTC recovered a chunk of Friday’s wipeout and is ranging back below 116k, with leverage reset and volatility still elevated.
Momentum: 📈 Technical rebound but still a range under 116k; upside needs a clean reclaim above 116k.
Key levels:
- Resistances (STF/MTF): 115.8–116.2k (pivot) • 119.9–120.5k • 124–126k (HTF).
- Supports (STF/HTF): 114.0–114.3k • 110.8–111.5k (pivot cluster) • 108.8–109.0k.
Volumes: Very high on 4H/6H during capitulation, only moderate on 1D so far.
Multi-timeframe signals: 1D/12H filter is Up, while 6H→1H sit in NEUTRE VENTE until 116k is reclaimed; 15m ticks NEUTRE ACHAT only for execution.
Risk On / Risk Off Indicator context: Overall NEUTRE VENTE — it contradicts the HTF bullish filter and argues for patience under 116k.
__________________________________________________________________________________
Trading Playbook
__________________________________________________________________________________
Primary stance: higher-timeframe bullish, but capped under 116k — stay progressive and let price confirm.
Global bias: Cautious bullish above 111k with validation >116k; swing invalidation on a daily close <111k.
Opportunities:
- Buy breakout: Go long on 4H/2H close >116.2k targeting 117.8k then 119.9–120.5k.
- Breakout add-on: Add if 118–120k flips to support (pullback holds) toward 122k.
- Tactical sell: Short clean rejections at 115.8–116.2k or loss of 114k, targeting 112.5k/111.1k.
Risk zones / invalidations:
- A confirmed break <111k reopens 108.8k then 105.6k (bullish invalidation).
- Repeated 116–118k rejections with the Risk On / Risk Off Indicator at NEUTRE VENTE favor range fades.
Macro catalysts (Twitter, Perplexity, news):
- US–China: 100% tariff rhetoric followed by a softer tone → headline volatility.
- Gold at ATH and Middle-East détente → risk appetite and hedging coexist.
- Fed/BoE: easing bias in the backdrop, but Fed tone remains mixed.
Action plan:
- Long (116.2k breakout): Entry 116.0–116.3k / Stop 114.8k / TP1 117.8k, TP2 119.9–120.5k, TP3 122k • R/R ~2R→3R.
- Short (116k rejection or <114k): Entry 115.6–116.0k or <114.0k / Stop 116.6k / TP1 114.0k, TP2 112.5k, TP3 111.1k • R/R ~1.8R→3R.
__________________________________________________________________________________
Multi-Timeframe Insights
__________________________________________________________________________________
HTFs stay constructive if 111k holds, while mid/low TFs chop below 116k awaiting confirmation.
1D/12H (filter Up): Bullish structure intact above 110.8–111.5k; sustained acceptance >115.8–116.2k opens 118–120k.
6H/4H/2H/1H (NEUTRE VENTE): Range 113.5–116k; 4H/6H “Very High” volume on the flush suggests a base, but no 116.2k close = still defensive.
30m/15m (execution): Compression below 116k; 15m flips NEUTRE ACHAT on trigger. Clean 30m/15m >116.2k + rising volume creates MTF confluence.
Significance: Bullish confluence = defended 111k + 116.2k breakout + expanding volume; divergence = Risk On / Risk Off Indicator stuck NEUTRE VENTE under 116k.
__________________________________________________________________________________
Macro & On-Chain Drivers
__________________________________________________________________________________
Leverage has been cleansed and macro détente is tentative, supporting the bounce while risk appetite remains selective.
Macro events:
- US–China: 100% tariff headlines then softer messaging; de-escalation possible but reversible.
- Geopolitics: hostage releases/ceasefire signals lower tail risk; gold at a new ATH underscores persistent hedging demand.
- Central banks: BoE leaning to cuts; Fed’s tone mixed despite an easing bias.
Bitcoin analysis:
- Historic leverage flush on Friday, rebound to ~115k from ~111.4k → cleaner positioning.
- Must reclaim 116k then 118–120k before the prior breakdown area below ~122k.
- Flows/treasuries: USDT injections (e.g., 100M to Kraken) and MARA +400 BTC add liquidity, not strictly directional.
On-chain data:
- Massive OI wipe and record liquidations; sentiment back to “Fear”.
- Strong on-chain support 117–120k; above it, confluence improves materially.
Expected impact:
- “Cautious détente” + deleveraging = conditional bullish bias; technically, confirmation is >116k then >118–120k.
__________________________________________________________________________________
Key Takeaways
__________________________________________________________________________________
The market stabilized after a record flush, but 116k remains the gatekeeper.
- Trend: HTF bullish, STF neutral until 116k is reclaimed.
- Best setup: Confirmed breakout >116.2k with volume toward 117.8k then 120k.
- Key macro: US–China détente and gold at ATH — supportive yet hedged risk tone.
Stay nimble: act on signals, protect below 114k, and watch 111k as swing invalidation.
GBPUSD: Testing Daily HTLKey Observations
Daily Timeframe
EMA20 crosses below EMA60 > signals a weak downtrend
Overall, this pair is topping out given the lower high formed
H1 Timeframe
Price fails to hold above the EMA band as it quickly cross below it
Very likely momentum to the downside will pick up

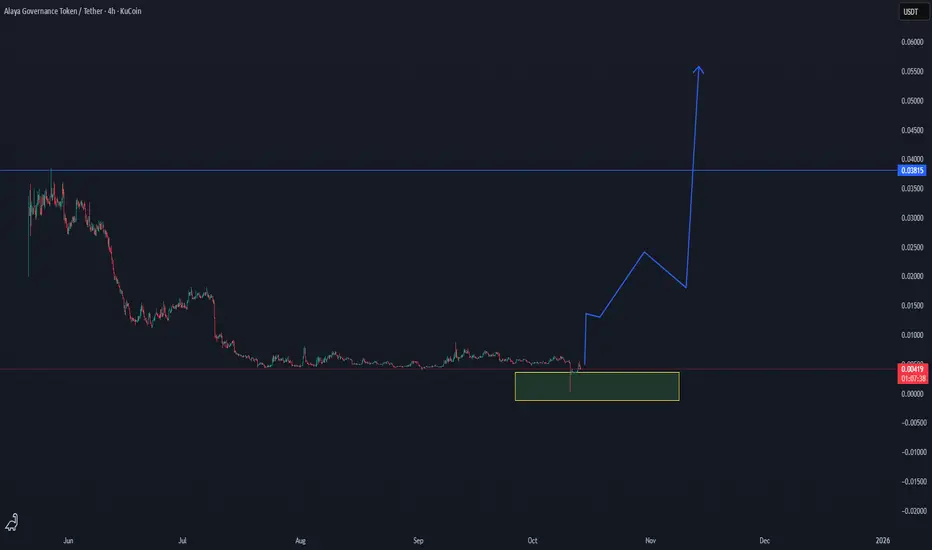
AGT/USDT — Breakout Formation from Accumulation Zone ImminentAGT/USDT — Breakout Formation from Accumulation Zone Imminent 🚀
AGT has entered a strong accumulation zone after a prolonged downtrend, showing the first technical signs of a potential trend reversal. The current consolidation within the highlighted support block suggests that buyers are stepping in, preparing for a possible breakout phase.
Low time frame confirmation is here
📊 Current Price: $0.0042
🟢 Accumulation Zone: $0.0038 – $0.0045
🔹 Breakout Target: $0.038
The chart shows a typical bottoming structure, with a long accumulation base forming under historical resistance. Once AGT confirms a breakout above $0.006, momentum could accelerate rapidly — targeting the $0.02 → $0.038 zones.
This setup mirrors classic early-cycle patterns seen before major upward expansions in similar low-cap assets. A strong breakout candle with volume will serve as confirmation of the next phase.
📈 Technical Outlook:
Accumulation structure in place
Breakout trigger above $0.006–$0.007
Main breakout target around $0.038
Summary:
AGT/USDT is building strength at the bottom of its range. If volume confirms, a major reversal cycle could be underway, opening the path toward a breakout to $0.038 and beyond.
🎯 Targets: $0.02 → $0.038
📊 Bias: Bullish — Breakout Setup Forming