Next report date
—
Report period
—
EPS estimate
—
Revenue estimate
—
5.01USD
3.48 BUSD
93.97 BUSD
474.89 M
About Archer-Daniels-Midland Company
Sector
Industry
CEO
Juan Ricardo Luciano
Website
Headquarters
Chicago
Founded
1902
FIGI
BBG000BB6WG8
Archer-Daniels-Midland Co. engages in the production of oilseeds, corn, wheat, cocoa, and other agricultural commodities. It operates through the following segments: Ag Services and Oilseeds, Carbohydrate Solutions, Nutrition, and Other. The Ag Services and Oilseeds segment includes activities related to the origination, merchandising, transportation, and storage of agricultural raw materials, and the crushing and further processing of oilseeds such as soybeans and soft seeds cottonseed, sunflower seed, canola, rapeseed, and flaxseed into vegetable oils and protein meals. The Carbohydrate Solutions segment consists of corn and wheat wet and dry milling and other activities. The Nutrition segment serves various end markets including food, beverages, nutritional supplements, and feed and premix for livestock, aquaculture, and pet food. The Other segment refers to the company's remaining operations. The company founded in 1902 and is headquartered in Chicago, IL.
Great Entry into ADMADM has a great entry setup I give stop loss 10% which fits with the support level and a clear breakout target on the right shoulder in the $70 range which should potentially yield a quick trip back through the levels if a bullish movement is reached resulting in a great long term hold.

ADM still being sold. Looks good at $63 and better at $67.Really love what this company does, you already know this is a staple stock, but we need to break this channel and I'd take a small position at $63 and add on at $67.
Other than that, keep it on watch.
Also look at key level around $68

Target 68.25Following weekly chart.
Got a long signal from indicator.
TP1 64.09
TP2 68.25
SL - Close under 58.95 candle close.


Archer Daniels Midland (ADM) Rises as Accounting Probe ConcludesArcher Daniels Midland Co. ( NYSE:ADM ), the agricultural powerhouse based in Chicago, saw a surge in its stock price after announcing the completion of an internal investigation into accounting irregularities within its nutrition business. While this development removed a significant overhang on th

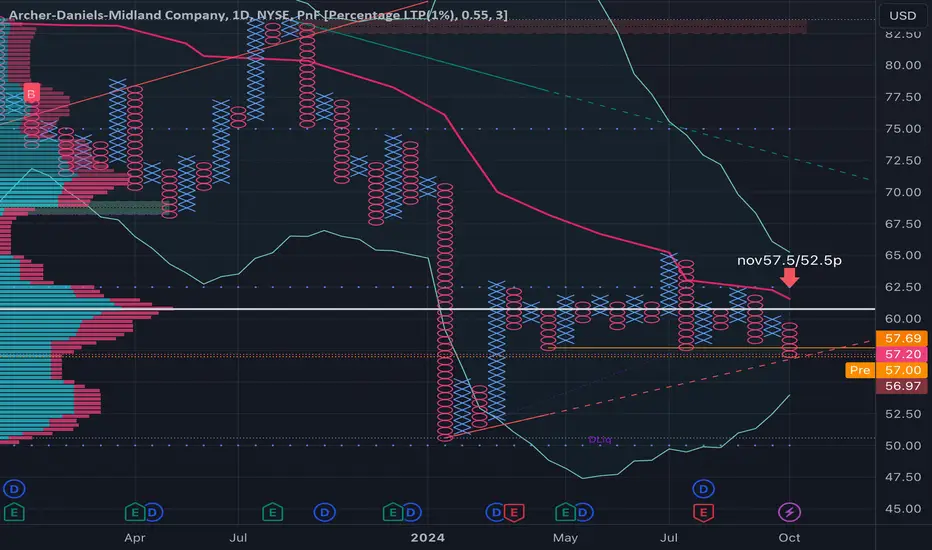
ADM: Bullish Harami on the Weekly at a Bullish Gartley HOP LevelArcher-Daniels-Midland is sitting at the HOP level of a Bullish Gartley aligning with support with a Bullish Harami Visible on the Weekly Timeframe after setting record-breaking weekly volume into the test of the Support Zone.
ADM will close and confirm the Weekly Harami in less than an hour and f

ADM is oversold!Start accumulating daily/weekly!
I plan to trade ADM the exact same way as I traded Pfizer stock a month ago. I drop a link below.

ADM - Long Dear traders,
ADM is too oversold, lets find entry orders at least with a target to fill the gap around 70,
The general trend is bullish and it already touched the previous level of resistance, which is a good level for thinking in open a buying position.
best of trading,

Advanced Micro Devices, Inc (symbol ‘AMD’), Daily
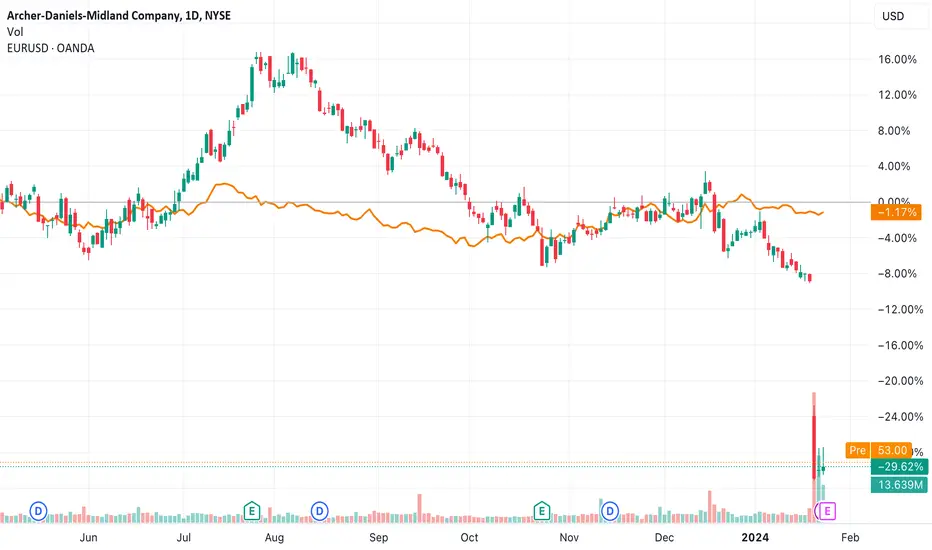
Shares of Advanced Micro Devices, Inc (symbol ‘AMD’) rose by around 10% in the third quarter of the year. The company’s earnings report for the fiscal quarter ending December 2023 is expected to be released on Tuesday 30th of January, after market close. The consensus EPS is $0.58, against $0.54 o
See all ideas
An aggregate view of professional's ratings.
Displays a symbol's price movements over previous years to identify recurring trends.
ADM.GJ
Archer-Daniels-Midland Company 6.95% 15-DEC-2097Yield to maturity
6.18%
Maturity date
Dec 15, 2097
ADM.GW
Archer-Daniels-Midland Company 5.765% 01-MAR-2041Yield to maturity
5.39%
Maturity date
Mar 1, 2041
ADM4540771
Archer-Daniels-Midland Company 3.75% 15-SEP-2047Yield to maturity
5.36%
Maturity date
Sep 15, 2047
ADM4773867
Archer-Daniels-Midland Company 4.5% 15-MAR-2049Yield to maturity
5.31%
Maturity date
Mar 15, 2049
ADM.GS
Archer-Daniels-Midland Company 6.45% 15-JAN-2038Yield to maturity
5.24%
Maturity date
Jan 15, 2038
ADM3963760
Archer-Daniels-Midland Company 4.016% 16-APR-2043Yield to maturity
5.22%
Maturity date
Apr 16, 2043
ADM3827213
Archer-Daniels-Midland Company 4.535% 26-MAR-2042Yield to maturity
5.22%
Maturity date
Mar 26, 2042
ADM.GP
Archer-Daniels-Midland Company 5.375% 15-SEP-2035Yield to maturity
4.89%
Maturity date
Sep 15, 2035
ADM5564429
Archer-Daniels-Midland Company 4.5% 15-AUG-2033Yield to maturity
4.84%
Maturity date
Aug 15, 2033
Explore more bonds
Curated watchlists where ADM is featured.


Frequently Asked Questions
The current price of ADM is 56.56 USD — it has increased by 0.11% in the past 24 hours. Watch Archer-Daniels-Midland Company stock price performance more closely on the chart.
Depending on the exchange, the stock ticker may vary. For instance, on NYSE exchange Archer-Daniels-Midland Company stocks are traded under the ticker ADM.
ADM stock has fallen by −3.40% compared to the previous week, the month change is a −6.90% fall, over the last year Archer-Daniels-Midland Company has showed a −20.48% decrease.
We've gathered analysts' opinions on Archer-Daniels-Midland Company future price: according to them, ADM price has a max estimate of 66.00 USD and a min estimate of 57.00 USD. Watch ADM chart and read a more detailed Archer-Daniels-Midland Company stock forecast: see what analysts think of Archer-Daniels-Midland Company and suggest that you do with its stocks.
ADM stock is 1.38% volatile and has beta coefficient of 0.44. Track Archer-Daniels-Midland Company stock price on the chart and check out the list of the most volatile stocks — is Archer-Daniels-Midland Company there?
Today Archer-Daniels-Midland Company has the market capitalization of 27.04 B, it has decreased by −2.61% over the last week.
Yes, you can track Archer-Daniels-Midland Company financials in yearly and quarterly reports right on TradingView.
Archer-Daniels-Midland Company is going to release the next earnings report on Nov 5, 2024. Keep track of upcoming events with our Earnings Calendar.
ADM earnings for the last quarter are 1.03 USD per share, whereas the estimation was 1.22 USD resulting in a −15.39% surprise. The estimated earnings for the next quarter are 1.27 USD per share. See more details about Archer-Daniels-Midland Company earnings.
Archer-Daniels-Midland Company revenue for the last quarter amounts to 22.25 B USD, despite the estimated figure of 23.12 B USD. In the next quarter, revenue is expected to reach 21.50 B USD.
ADM net income for the last quarter is 486.00 M USD, while the quarter before that showed 729.00 M USD of net income which accounts for −33.33% change. Track more Archer-Daniels-Midland Company financial stats to get the full picture.
Yes, ADM dividends are paid quarterly. The last dividend per share was 0.50 USD. As of today, Dividend Yield (TTM)% is 3.45%. Tracking Archer-Daniels-Midland Company dividends might help you take more informed decisions.
Archer-Daniels-Midland Company dividend yield was 2.49% in 2023, and payout ratio reached 28.01%. The year before the numbers were 1.72% and 20.76% correspondingly. See high-dividend stocks and find more opportunities for your portfolio.
As of Oct 27, 2024, the company has 41.80 K employees. See our rating of the largest employees — is Archer-Daniels-Midland Company on this list?
EBITDA measures a company's operating performance, its growth signifies an improvement in the efficiency of a company. Archer-Daniels-Midland Company EBITDA is 3.85 B USD, and current EBITDA margin is 4.20%. See more stats in Archer-Daniels-Midland Company financial statements.
Like other stocks, ADM shares are traded on stock exchanges, e.g. Nasdaq, Nyse, Euronext, and the easiest way to buy them is through an online stock broker. To do this, you need to open an account and follow a broker's procedures, then start trading. You can trade Archer-Daniels-Midland Company stock right from TradingView charts — choose your broker and connect to your account.
Investing in stocks requires a comprehensive research: you should carefully study all the available data, e.g. company's financials, related news, and its technical analysis. So Archer-Daniels-Midland Company technincal analysis shows the sell today, and its 1 week rating is sell. Since market conditions are prone to changes, it's worth looking a bit further into the future — according to the 1 month rating Archer-Daniels-Midland Company stock shows the sell signal. See more of Archer-Daniels-Midland Company technicals for a more comprehensive analysis.
If you're still not sure, try looking for inspiration in our curated watchlists.
If you're still not sure, try looking for inspiration in our curated watchlists.