EUR/USD – Rising Wedge Breakdown Signaling Deeper BearishThis EUR/USD 2H chart shows a classic rising-wedge distribution, a pattern that often forms before a strong bearish move. Price rallied inside a rising channel, but the momentum weakened near the upper resistance zone, creating lower highs and showing sellers stepping in early.
A clean breakout below the wedge support confirms that buyers lost control. After the drop, price pulled back for a retest of the broken structure — exactly where sellers typically reload positions. That retest (highlighted in yellow) shows rejection, signaling bearish continuation.
The market is now expected to push toward the 1.15400 support zone, which aligns with previous demand and high-volume areas. If that level fails, the larger support near 1.14700 becomes the next major target.
This setup reflects a textbook bearish transition:
Breakout → Retest → Continuation.
Breakoutretest

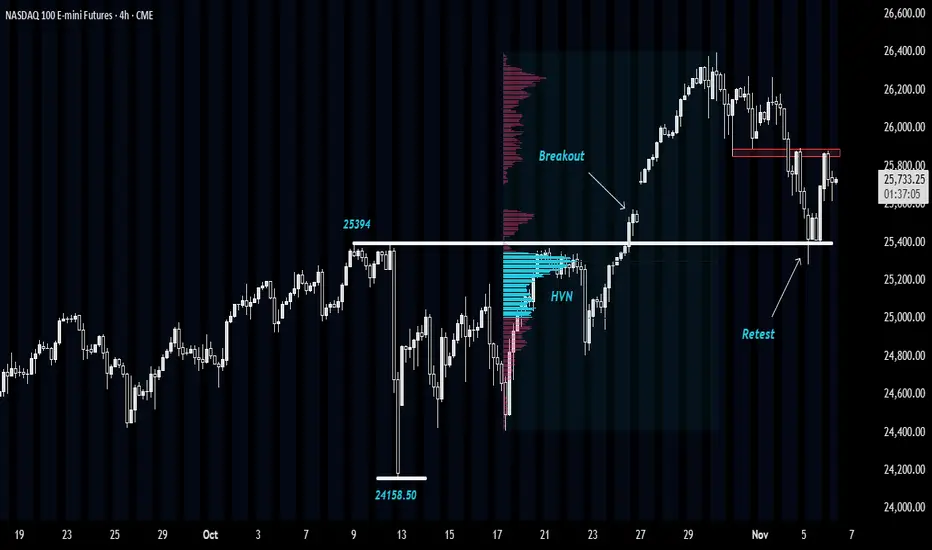
NASDAQ: Retesting Breakout ZoneThis idea is based upon successful Breakout Retest scenario near a High-Volume Node (HVN).
Let's first get to the basics:
A successful Breakout Retest -
A breakout retest scenario occurs when the price breaks through a key level of support or resistance and then returns to test that same level before continuing in the breakout direction.
For example, if the price breaks above a resistance zone, traders wait to see if the price comes back down to that zone. If it holds as new support and shows rejection candles or strong buying, that’s called a successful retest.
At a successful retest, several things typically happen:
➡The old resistance acts as new support (or vice versa in case of breakdown).
➡Traders who missed the initial breakout enter the trade, adding momentum.
➡Weak hands or short-term traders exit, cleaning up the order flow.
➡The price often accelerates in the direction of the breakout with stronger conviction and volume.
In simple terms, a successful retest confirms that the breakout was genuine and not a false move.
High Volume Node -
HVN is a price level or zone on a volume profile where a large amount of trading activity has occurred. It represents an area where buyers and sellers actively agreed on price, leading to high transaction volume.
These zones usually act as balance areas- price tends to pause, consolidate, or even reverse near them because many traders have open positions there. When price revisits an HVN, it often encounters strong support or resistance, as market participants react to protect or exit their earlier trades.
In short, an HVN marks a fair value area on the chart where market consensus was strongest.
NASDAQ Analysis -
In the Nasdaq E-mini chart, we can observe a sharp decline from 25,394 to 24,158, but without any meaningful follow-through on the downside.
Subsequently, the price reacted once again from this same zone on 21st and 22nd October, before eventually breaking above 25,394 with strong momentum to form new highs.
At present, the market has pulled back to the 25,394 level, which previously acted as resistance. This area is now holding as support, suggesting a successful retest and presenting a potential buying opportunity.
Moreover, this retest is aligning with a HVN around 25,300, further reinforcing the support zone.
In the short term, the price is facing resistance near 25,900. A conservative long entry could be considered after a sustained move above 25,900, while an aggressive low-risk entry could be initiated around 25,500, closer to support.
📣Disclaimer:
Everything shared here is meant for education and general awareness only. It’s not financial advice, nor a recommendation to buy, sell, or hold any asset. Do your own research, manage your risk, and make sure you understand what you’re getting into.
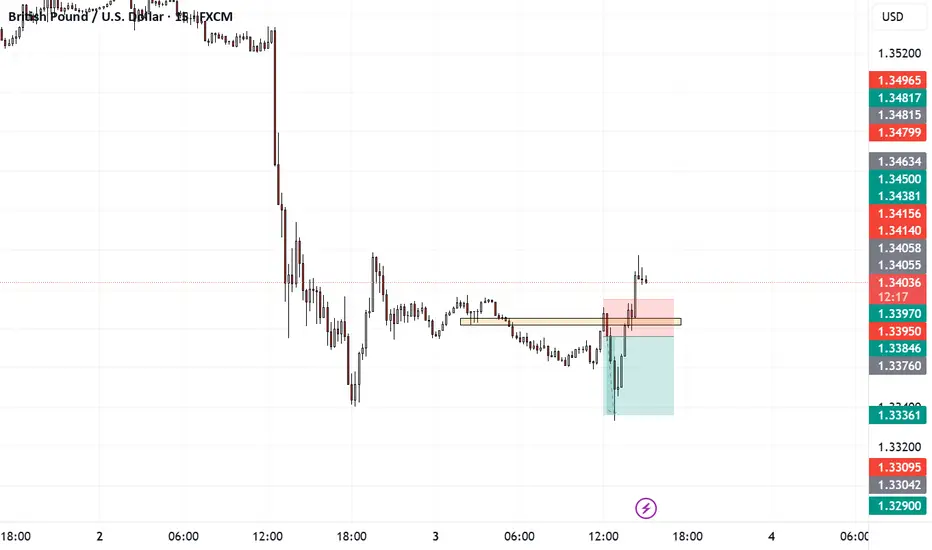
BreakOut ReTest StrategyI respected my zone + rejection entry rule (good).
Strong bearish impulse followed after my entry, so the idea was correct.
The sharp drop suggests momentum was in my favor, likely news-driven or liquidity sweep.
My stop placement looks safe above structure (not too tight).
✅ This looks like an A+ setup execution — clean zone, rejection confirmation, and follow-through.
XAUUSD · M15 · 24-Aug —Long Idea — Post-Spike LPS into 200 EMARetest the Launchpad
Long Idea — Post-Spike LPS into 200 EMA
Global Context: After a strong spike (Wyckoff SOS), look for the backup/LPS to the breakout block where the EMA200 (white) and Donchian trend (green) cluster below price.
Entry: 3,353 – 3,359 (first touch or bullish rejection)
Stop-Loss: 3,332 (below M15 base / green Donchian shelf)
Take Profits:
TP1: 3,378 (spike high) — scale partial, move SL→BE
TP2: 3,392 (momentum extension)
TP3: 3,### (measured move)
RRR (mid-entry 3,356): Risk = 24 → TP2 = 1:1.5, TP3 = 1:2.5 ✅
Triggers: Bullish rejection/engulfing + 8/21 EMA (orange/blue) hold on the pullback above EMA200 (white).
Risk: Max 0.5–1.0% per trade. Trail under the 8 EMA after TP2.
Invalidation: M15 close below 3,332.
Trade Confidence: ⭐⭐⭐⭐ (High-probability if the retest holds above EMA200 + 8/21 confirmation)
⚠️ Trading involves risk. Manage exposure and trade responsibly.
💬 What do you think of this setup? Share your thoughts!

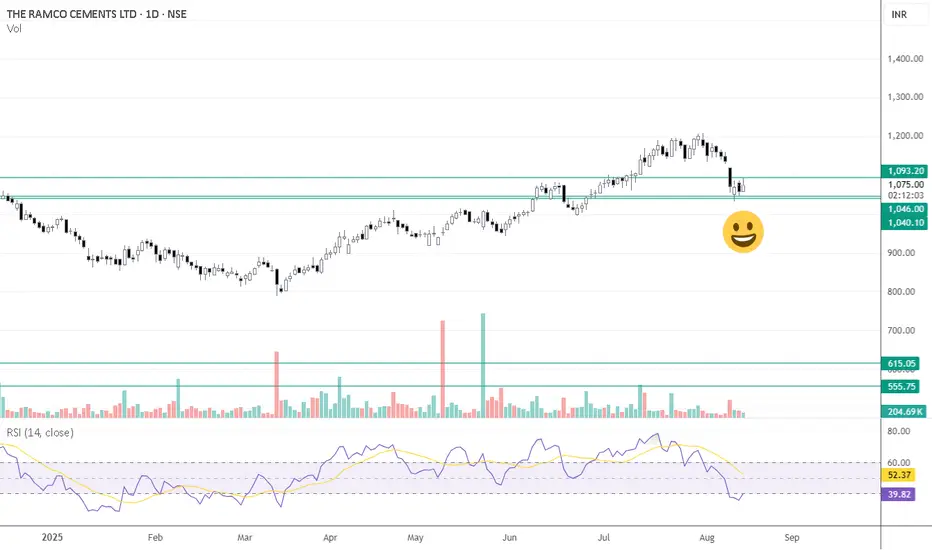
Ramco Cement — Trade SetupRamco Cement — Trade Setup Watchlist
Breakout: Confirmed on both monthly and weekly charts.
Current Move: Price has retraced back to the breakout zone.
Trade Idea: Monitor for potential long entry if price holds above the breakout level.
Reasoning: Pullback to breakout zone could offer an attractive risk–reward opportunity.
Key levels to watch:
Breakout support:
JPY/USD Breakout from Curve Line – Targeting Upper Resistance JPY/USD presents a classic curve bottom formation, which is a powerful technical structure indicating accumulation by smart money. It’s supported by key price action behaviors like support/resistance flips, retesting confirmation, and a well-defined target zone.
Let’s break it down piece by piece.
📉 1. Curve Formation – Accumulation Phase
The most noticeable element here is the parabolic (curve) structure formed between October 2024 and March 2025. This kind of structure often reflects a slow accumulation process:
Price dips over several months form a rounded bottom — also called a saucer pattern.
This shows institutional players are quietly accumulating, while retail traders are often trapped in sell-side positions.
As the curve matures, the volume and momentum begin to shift, signaling the beginning of a bullish breakout.
This accumulation curve is bullish by nature and becomes even more potent when followed by a breakout and retest.
🔄 2. SR Flip Zone (Support-Resistance Interchange)
One of the most critical concepts in price action is the SR flip — where old resistance turns into new support. In this case:
The yellow-shaded zone previously acted as resistance — confirmed by multiple rejections.
After the breakout, this same zone is being retested as support — a healthy technical confirmation that the market has accepted higher prices.
This flip zone is a launchpad for continuation to the upside.
📍 3. Retest Confirmation – Smart Entry Opportunity
Zooming into recent price action:
The market pulled back cleanly into the SR zone and the curve line.
The confluence of horizontal support and the curved trendline makes this an extremely strong retest zone.
Buyers stepped in with force, suggesting that demand is active at this level.
This retest is where risk-to-reward is optimized. The ideal entries usually happen when price confirms structure after a breakout — not before.
🎯 4. Target Zone – Next Bullish Objective
The next logical target is shown in the blue box above (~0.00705–0.00710). Here's why this zone is important:
It marks a previous supply/resistance area.
It aligns with psychological round numbers and past consolidation.
A measured move from the bottom of the curve also aligns with this target.
In essence, it is the profit-taking zone where the market is likely to pause or reverse temporarily.
🔎 5. Insider Supply & Central Zone – Institutional Traces
The chart labels an “Insider Supply” area at the base of the curve. This implies:
Hidden accumulation likely occurred at this level.
Institutions tend to trap retail sellers during these periods with false breakdowns.
Once they’ve loaded up, price shifts upward in a controlled fashion — exactly what has happened here.
The Central Zone is the battlefield — the area where prior indecision took place, which has now turned into a stepping stone for upward movement.
💡 Strategy Recap:
Parameter Value
Entry Retest of SR Flip (0.00680–0.00685)
Stop Loss Below curve base (~0.00670 or lower)
Target 0.00705–0.00710
R/R Ratio 1:2 or better
This strategy is technically sound, supported by structure, and has strong reward potential.
🧠 Market Psychology:
Smart money accumulates when price is quiet and sentiment is bearish.
After accumulation, a controlled markup begins, with retests engineered to confirm the breakout.
Retail traders tend to enter late or get faked out — while institutions already hold positions.
This chart is a textbook example of how professional traders operate and manage structure-based risk.
🏁 Final Thoughts:
This is a high-probability technical setup built on multiple layers of confluence:
Curve structure
SR flip
Demand zone retest
Momentum shift
If momentum continues, the 0.00710 zone is a very realistic short-term target. Traders should manage risk tightly and monitor price behavior near the upper resistance box.

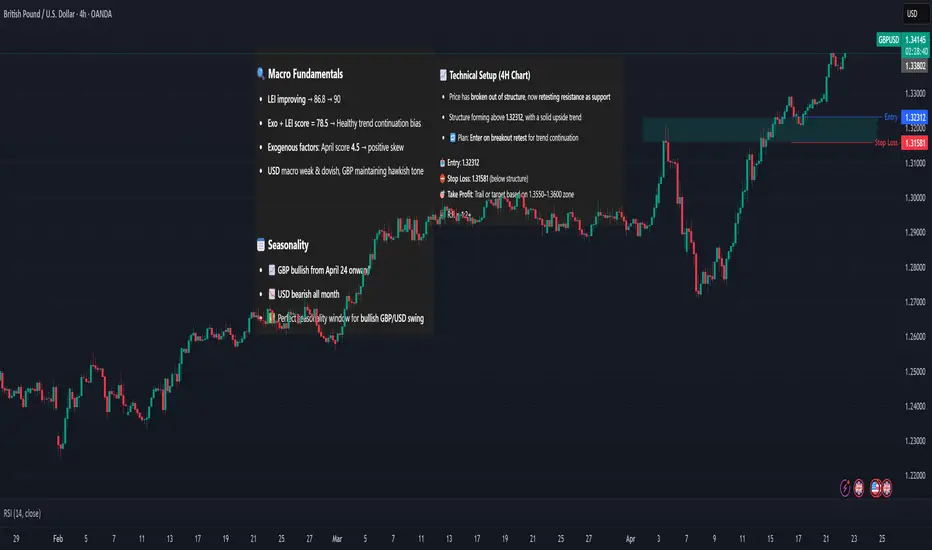
GBP/USD – Breakout Retest Setup🔍 Macro Fundamentals
LEI improving → 86.8 → 90
Exo + LEI score = 78.5 → Healthy trend continuation bias
Exogenous factors: April score 4.5 → positive skew
USD macro weak & dovish, GBP maintaining hawkish tone
📅 Seasonality
📈 GBP bullish from April 24 onward
📉 USD bearish all month
✅ Perfect seasonality window for bullish GBP/USD swing
📊 COT Sentiment
Both GBP and USD = ⚖️ Neutral
→ No positioning pressure, clean technical entry expected
📈 Technical Setup (4H Chart)
Price has broken out of structure, now retesting resistance as support
Structure forming above 1.32312, with a solid upside trend
🔁 Plan: Enter on breakout retest for trend continuation
📥 Entry: 1.32312
⛔ Stop Loss: 1.31581 (below structure)
🎯 Take Profit: Trail or target based on 1.3550–1.3600 zone
🧮 R:R ≈ 1:2+
COTI ANALYSIS 📊 #COTI Analysis
✅There is a formation of Descending Channel Pattern in weekly time frame in #COTI.
Also there is a perfect breakout and retest. Now we can expect a bullish move from major support zone. If not the we will see more bearish move and then a reversal in #COTI.
👀Current Price: $0.06390
🎯 Target Price : $0.08660
⚡️What to do ?
👀Keep an eye on #COTI price action and volume. We can trade according to the chart and make some profits⚡️⚡️
#COTI #Cryptocurrency #Breakout #TechnicalAnalysis #DYOR

A multi-year breakout retestIt has retested a multi-year breakout zone and now seems to have broken above a small base pattern. On the Elliott Wave front - it has started Wave 3 up.

LIC - retesting breakout levels. Looks good for long term.LIC - retesting breakout levels. Looks good for long term.

Looking for a breakout of ATH's and then retest for META.🔉Sound on!🔉
Thank you as always for watching my videos. I hope that you learned something very educational! Please feel free to like, share, and comment on this post. Remember only risk what you are willing to lose. Trading is very risky but it can change your life!

Birlasoft retestBirlasoft breakout retest on monthly time frame. It can give good returns in the years to come.

KayCee Industries - See the "C"s (Cups)Kaycee Industries - on Weekly has Interestingly repeating pattern. Something very similar to TRIL I noticed last year. After 4 repeated Cups, TRIL stopped creating Cups but rather flew away. Very similar structure here
Look at 4 different colored Fib retracements
1. Green - 0.618 retracement - precisely reached 1.618 target 9578 and fell
2. Orange - 0.618 retracement - precisely reached 1.618 target 14418 and fell
3. Blue - This time 0.5 retracement - with target of 23500, but fell slightly before
4. Pink - Again 0.618 retracement - precisely reached both 1.618 and 2.618 targets (32,900 and 43,726)
By this time the Parallel Channel is decisively broken on the upside, and now retracement journey starts
Very interesting structure - if the price gets reduced due to Bonus & Stock Splits - let's wait for the price change + wait for correction to retest the BO zone of Parallel channel and review again
Love this Chart - repetitions add to the credibility of the stock and technical analysis
Disclaimer:
3+ Years Teaching Experience in Stock Market - Technical Analysis, Behaviour Analysis, Advanced Patterns, Emotional Management, News based Trading...
We are NOT SEBI Registered and Our focus is NOT providing Buy/Sell Recommendations/calls. Primary Objective is to provide detailed analysis of how to review a chart, explain multi-timeframe views purely for Educational Purposes.
We strongly suggest our followers to "Learn to Ride the Tide irrespective of its Side"
*** Important *** Consult your Financial Advisors before taking any positions
If you like our detailed analysis, please do rate us with your Likes, Boost and share your comments
-Team Stocks-n-Trends

SAIL - The Steel that Sank the Titanic Vs Steel that Sails :) :)Its been 4 years since SAIL recovered from rock bottom price of 20. When late Big Bull Rakesh J took stakes in SAIL, it was trading somewhere around 90 and had reached a peak of 150+ and fell again to 65-70 levels
It took 2 years to complete the return journey back to 150+. Lets now compare the short- and long-term views and respective targets
Long Term View:
Quarterly Chart shows a Falling Parallel Channel Breakout + Retest & Strong Bounce
Long Term Targets are 235, 280
Short Term View:
On Daily chart, price has formed a Fresh Rounding Bottom BO above 170 for Target of 190
Summary:
Upcoming Targets - 190, 235, 280++
Disclaimer:
Stocks-n-Trends is NOT registered with SEBI. We do not provide Buy / Sell recommendations - rather we provide detailed analysis of how to review a chart, explain multi-timeframe views purely for Educational Purposes. We strongly suggest our followers to "Learn to Ride the Tide" and consult your Financial Advisors before taking any positions.
If you like our detailed analysis, please do rate us with your Likes, Boost and share your comments
-Team Stocks-n-Trends

Balmer Lawrie - The Bulldozing Lorry :)Balmer Lawrie - PSU Pick - Comparison on Monthly Vs Daily
*Monthly:* Rounding Bottom Breakout done for Target of 330. After BO, price completed 1st Target of 275 and had a FIB 50% Retracement back to the BO Zone. Next Fib Targets are 385, 495
*Daily:* On Daily, Price has Broken out of Textbook Inverted Head and Shoulders Pattern - for Target of 330 which is precisely matching the Rounding Bottom BO.
See How one pattern leads to Another ?
Disclaimer:
3+ Years Teaching Experience in Stock Market - Technical Analysis, Advanced Patterns, Emotional Management, News based Trading...
We are NOT SEBI Registered and Our focus is NOT providing Buy/Sell Recommendations/calls. Primary Objective is to provide detailed analysis of how to review a chart, explain multi-timeframe views purely for Educational Purposes.
We strongly suggest our followers to "Learn to Ride the Tide irrespective of its Side"
*** Important *** Consult your Financial Advisors before taking any positions
If you like our detailed analysis, please do rate us with your Likes, Boost and share your comments
-Team Stocks-n-Trends

SULA entered into demand zone, long term investing opportunitySULA entered into demand zone, long term investing opportunity.

Mining thru the Miner Stock - VedantaMulti-Timeframe Analysis of Vedanta:
Decoding the Dividend Yield
Vedanta Ltd has been a Cash Cow atleast for past 2-3 years from a Dividend Perspective. More than the Stock price gain - It has provided Dividend Yield of more than 40% since 2022. A large portion of Dividend yields was being utilized to settle the Parent Company's Debt in UK. It was like a Collateral "Gains" for us - the retail investors - who also got big chunk of Dividends. I used to say in a funny way "As long as Vedanta is in Debt - I will enjoy Hefty Dividends" :) This is real and realized profits unlike the stock prices which goes up and down
Flag Pole Break Out on Monthly Chart
As you can see, VEDL has completed a Flag Pattern BO on Monthly level with huge target of 488
Multi-Bullish Patterns on Daily Chart
On the Daily - there are multiple bullish Patterns
1. Cup and Handle - BO started today
2. Inv Head & Shoulder embedded inside the Cup - Target Reached
3. While forming the Handle portion - it also completed the BO - Retest of Flag Pattern which is a Very Healthy sign
Vedanta is all set to Shine Bright & Hot in the upcoming days - especially when the Metal Index is also on BO - there is no stopping for this beauty now :) :) :)

MBOX / USDT - Bullish Momentum ConfirmedTechnical Analysis:
Breakout and Retest of Range: MBOX/USDT has recently broken out of a key range and successfully retested the breakout level, indicating a strong bullish signal.
200 Moving Average Breakout: The 200-day moving average has been decisively breached, providing additional confirmation of the bullish trend.
Price Action and Trend Analysis:
The combination of a breakout and retest, along with the 200-day moving average breakout, suggests a robust uptrend. This strengthens the case for a sustained bullish movement.
Potential Targets:
Target 1: $0.3771
Target 2: $0.4060
Risk Management:
To manage risk, consider implementing stop-loss orders. Monitoring the price in relation to the 200-day moving average can also provide insights into the strength of the trend.

XAU/USD ↘️ Short Trade setup ↘️Hello Everyone 🙋🏽♂️
Triangle breakout retest
💲 Entry Point : 1950.414
🟢 TP 1950.414 🔴 SL 2081.549
We are not responsible of any losses for anyone, our trades are profitable more for long terms and we take losses as everyone,
manage your lot size as well and your SL and TP and my opinion is 0.01 lot for each 500 $.
Don't forget to hit the like bottom and write a comment to support us.
Follow us for more 🙋🏻♂️
Best Regard / EMA Trading .
Disclaimer:
----------------
It's not a financial advise, As everyone we take losses sometime but for long term trading we are profitable traders, so manage your account well with SL and TP and your lot size to keep your account safe and stay in the market

Brightcom Group, Debt free available at very attractive ValueBrightcom Group Ltd - Levels on the chart CMP-16.80 Target-32,50 SL-12
Sector IT, Digital Eco-system , IoT - Market Cap 3390+ Cr
Available at very attractive valuation - Debt Free company
PE 2.4, PB 0.46, Book value/share 36.28
FIIs Holding - 9.5%, Mutual funds increasing holdings
Clients - leading blue chip advertisers

BERGERPAINTS TRENDLINE BREAKOUT!!!!The price following descending trendline resistance from a very long time. Whenever the price reaches near the trendline price taking resistance and slopes down. Now finally price breaks the trendline and closes above the trendline with good breakout candle. The level of 550 is strong support for the price . Candle closes above the breakout level of 575 and holding itself at the higher levels. price showing good momentum for swing reversal . After the breakout possible targets are 615--633 & 650.
BERGERPAINTS📊
👉🏻Range + Trendline Breakout
👉🏻Support 572 & 548
👉🏻Add for swing reversal
👉🏻Target possible 615/633/650+

Long $DYDX for Financial Freedom #TheCryptocracyNot financial advice! God tier setup, doesn't get much better. Inverse head and shoulders, breakout retest, and golden cross. I am looooong! (macro market plz don't wrek me) #TheCryptocracy

Astra Microwave: breakout zone retest stock!Astra microwave is close to its breakout retesting zone. Keep an eye on this stock.
