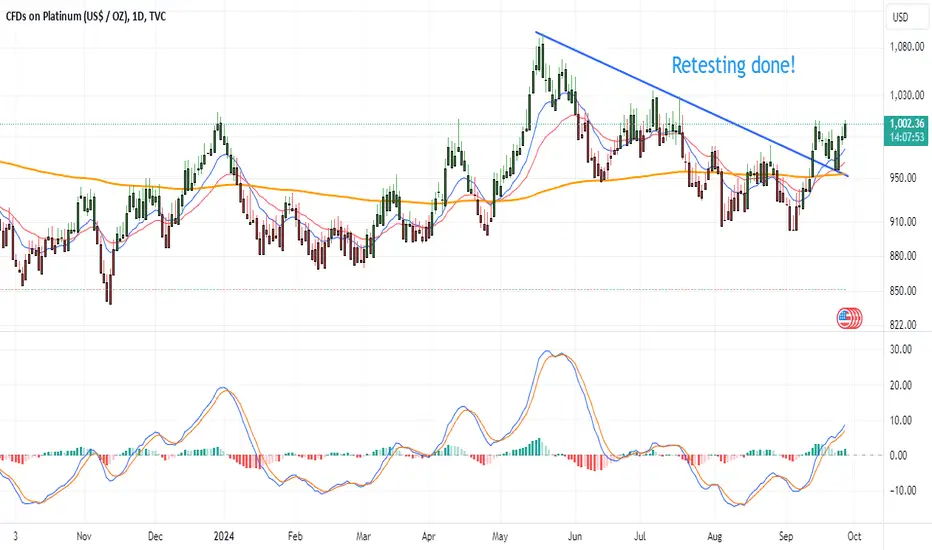
[PLATINUM] Breakout, checked....retest, checked...TVC:PLATINUM seems ready to go higher as it successfully retesting the downtrend line.
As with other commodities, the theme here is China's effort to boost its sluggish economy with its money printer.
Breakouts
86400 resistance #BTCSeems we are in a ascending broadening wedge pattern, with a missing 5 Elliot leg.
If confirmed, we might see a break out to the 86400$ resistance.

220% for Fet in 50Fet's looking to lead the AI charge in the coming weeks we have :
Reverse Head & Shoulders:
• We’ve got a clean Reverse Head & Shoulders pattern in play, which signals a strong bullish reversal. The base sits just above 1.00 USDT, and we’ve already seen a breakout confirmed at 1.309 USDT. This setup is often the precursor to a significant upward move.
Price Targets:
• First target sits at 2.032 USDT, a solid 58% gain from the breakout point.
• Beyond that, we’re looking at a long-term target of 4.180 USDT, marking a 220% potential increase. This target aligns with the projected upper channel, showing a clear path if bullish momentum continues.
Volume & Momentum:
• Volume is backing up the move—strong buying pressure is evident with a notable increase in green volume bars.
• The momentum indicators (likely MACD) are also bullish, reinforcing the strength of the breakout. This suggests there’s still room for the trend to run further.
Historical Reference:
• On the right side of the chart, there’s a past pattern with similar price action. After consolidating for 45 days, the price moved sharply higher. While past performance isn’t a guarantee, it’s definitely worth noting the similarities.
Strategy:
• For those looking to enter, a re-test around 1.309 USDT (now support) offers a solid entry point.
• A break above 2.032 USDT could ignite further momentum, potentially driving price toward 4.180 USDT in the coming weeks or months. Watch for sustained volume and bullish momentum to confirm the trend.
Summary: Fetch.AI is setting up for a strong move, with a clear bullish pattern and solid upside targets. If momentum continues, the next few weeks could see substantial gains. This is a trend worth watching closely.

JKCEMENT Ready for Breakout...NSE:JKCEMENT trade at 4670. You can watch for 5500-5600 level after breakout.

Unfilled bullish breakouts. Re-tests further down.The bearish breakouts from 11th June and 2nd August were filled before BTC continued further down.
Two bullish breakouts from 5th and 8th of August are still unfilled and I'm expecting price to reach down at least to the one from 8th of August before we will either see a bullish rejection or price will continue to fall.
If price breaks below the 50k level next support further down will be between 40-44k.

Play in a Range...NSE:ASIANPAINT trade at 3120. Support is @ 2700 Resistance is @ 3600.
stock trade in 900-1000 points since 3 years, You can watch its next resistance at 3600.

Looks promising!With exceptional ROE, strong interests from Institutions and with analysts recommending a buy, it seems like the stock will reach new highs.
I'm not a SEBI-certified advisor. My posts are just my ideas or trades I entered into. They may or may not work. I trade with a strict SL, and my RR is 3.

EurUsd → so bullishhello guys.
let's dive into eurusd
Breaking the Channel:
The price has broken out of a previous channel, which suggests a potential bullish momentum continuation. This breakout is marked as a significant event that has shifted the trend.
The Last High Broken:
The chart indicates that the last significant high around the $1.1169 level was broken. This breakout above the previous high is a strong bullish signal, suggesting further upward potential.
Internal Trendline:
There’s an internal trendline within the broader trend that could act as support if the price pulls back. The price might retest this trendline before moving higher.
Potential Bullish Move:
After breaking the last high, the price may retrace slightly to retest the breakout level or the internal trendline, before continuing its upward move.
The next potential target appears to be in the region of $1.1300, where the price may find the next significant resistance.
Current Price Action:
The price is currently hovering around $1.1166, slightly above the previous resistance, which now acts as support. This area will be critical in determining if the price continues its bullish trajectory or pulls back for a deeper retest.
This analysis underscores a bullish outlook for the EUR/USD pair, emphasizing the importance of the broken resistance level and the potential for further gains if the trend continues. Traders should watch for a retest of the breakout level to confirm the strength of the move.
___________________________
✓✓✓ Always do your research.
❒❒❒ If you have any questions, you can write them in the comments below, and I will answer them.
❤︎ ❤︎ ❤︎And please don't forget to support this idea with your likes and comment


AEROFLEX IND - INVERSE HEAD & SHOULDER PATTERN BREAKOUT INVERSE HEAD & SHOULDER PATTERN BREAKOUT STOCK FOR SWING TRADING
BUY PRICE : 174
SL : 158 (only for swing traders)
TARGET : 196, 230 (32%)
Disclaimer - All information on this page is for educational purposes only,
we are not SEBI Registered, Please consult a SEBI registered financial advisor for your financial matters before investing And taking any decision. We are not responsible for any profit/loss you made.

Massive Bull Flag on the Daily & Weekly, The breakout of this Bull Flag is going to bring BTC once again to heights we have yet to see. When we use a Trend Base Fib Ext, we can see the next Golden Pocket sitting up at $85.600. This is a continuation of the monster Cup & Handle we broke out from earlier this year.

GOlD → stick to the long positionhello guys.
I believe gold is still bullish and only long positions are logical.
Channel Breakout: The price of gold has broken out of the main ascending channel, indicating a strong bullish move.
Fake Divergence: A fake divergence was spotted, but the price continued to rise, rejecting bearish signals.
Support Zone: The price is currently hovering above a significant support zone (highlighted in blue), which could serve as a springboard for further upward movement.
Target: The next potential target lies near the upper boundary of the newly formed channel, around the $2,550 mark.
Summary
Breakout: Price broke above the main ascending channel.
Support: Holding above a key support zone.
Target: Aiming for $2,550 as the next potential resistance level.
___________________________
✓✓✓ Always do your research.
❒❒❒ If you have any questions, you can write them in the comments below, and I will answer them.
❤︎ ❤︎ ❤︎And please don't forget to support this idea with your likes and comment

Westcost paper seems breaking out.It looks like a good short term breakout. My idea is to exit at the 2nd leg.

Grasim Weekly TF Breakout First Resistance -- 2709.6
Second Resistance --- 2734.3
Third Resistance --- 2776.5
First Support --- 2642.7
Second Support --- 2600.5
Third Support --- 2575.8
Positional long
Daily Avg. Delivery Volume %
21 Aug, 2024
68.0%
Week
56.5%
Month
59.0%

I'm buying thisI missed the dip but still time to buy this. If it pulls back I'll buy more. It's testing the demand zone after break out. Was consolidating since 10/2023. Is not done going up.

ICICI Bank Ltd: Ascending Trend Line and Potential Bullish BreakTechnical View
➡ Ascending trend line providing strong support
➡ Retrace from demand zone near 1150
➡ Next resistance at 1247
➡ Bullish breakout possible above 1192
➡ RSI at 52, indicating neutral momentum

#GLENAMRK PHRMA WEEKLY BREAKOUT #Glenmark
Buy level as how in charge.
Short term idea:- hold for position
Educational Purpose

XRP doubts for long positionI am trying to create a plan for XRP. As far as I know, this cryptocurrency carries a high level of risk. However, the chart appears to be very bullish to me after a prolonged period of consolidation. My strategy is to wait for it to reach one of the current fair value gaps on either the 4-hour or daily timeframe, and then make a move. XRP has already formed a swing low, so I anticipate a new swing high to be reached soon. BINANCE:XRPUSDT

Will USDCAD Fall ?Hey there,
We see in the weekly Chart USDCAD at the Strong Resistance level.....
In hourly timeframe we see market breakout the lower line of the trend.....and taking retest
we expect the big move....
Wait for the Confirmation
Good Luck

Descending Channel on USD/CHF @ D1This descending channel pattern has formed on the daily chart of the USD/CHF pair following a rising trend that lasted from the start of the year till May 1. The pattern's borders are marked with the yellow lines. The potential entry level is at the cyan line. The potential take-profit level is at the green line. The stop-loss can be set to the low of the candle preceding the breakout candle. It's not shown SL isn't shown on the chart. I will ignore bearish breakouts from this descending channel formation.

GBPUSD under sell pressureBased on the chart on 1H timeframe , It expect that the support line hold the price above 1.2830 but this area break clearly and price dropped.
So I have bearish outlook to this chart.
If you are interested to access more charts, signals and updates, please like and subscribe.
Good luck!

INTRADAY, RIF, 0.11774, LONGIntraday idea.
The token is stronger than the market, sellers keep the price at the level itself and do not allow it to roll back, a large accumulation below the level can serve as a source of the initial breakout impulse.

Intraday, AMB, 0.008050, LONGIntraday idea.
The token is stronger than the market and does not react to BTC rollbacks, sellers keep the price at the level itself and do not allow it to roll back even after a false breakout, a large accumulation below the level can serve as a source of the initial breakout impulse. There is emptiness ahead; nothing will stop the token from moving forward.
